按js文件或cdn导入
javascript
<script src="https://cdn.jsdelivr.net/npm/echarts@5/dist/echarts.min.js"></script>在main.js中注册到全局的对象原型上
javascript
Vue.prototype.$echarts = window.echarts搭建echart模版
分拆option
分为数据,初始化,自适应三个方向
javascript
<script>
export default {
  data () {
    return {
      chartInstance: null,
      allData: null
   }
 },
  mounted () {
    this.initChart()
    this.getData()
    window.addEventListener('resize', this.screenAdapter)
    this.screenAdapter()
 },
  destroyed () {
    window.removeEventListener('resize', this.screenAdapter)
 },
  methods: {
  // 初始化chart
    initChart () {
      this.chartInstance = this.$echarts.init(this.$refs.trend_ref)
      const initOption = {}
      this.chartInstance.setOption(initOption)
   },
    async getData () {
  // 获取服务器的数据, 对this.allData进行赋值之后, 调用updateChart方法更新图表
      this.updateChart()
   },
    updateChart () {
      // 处理图表需要的数据
      const dataOption = {}
      this.chartInstance.setOption(dataOption)
   },
   // 自适应chart
    screenAdapter () {
      const adapterOption = {}
      this.chartInstance.setOption(adapterOption)
      this.chartInstance.resize()
   }
 }
}
</script>
使用import命令来导入echarts
完全导入
javascript
import * as echarts from 'echarts'后面操作一样
按需导入
官网说明
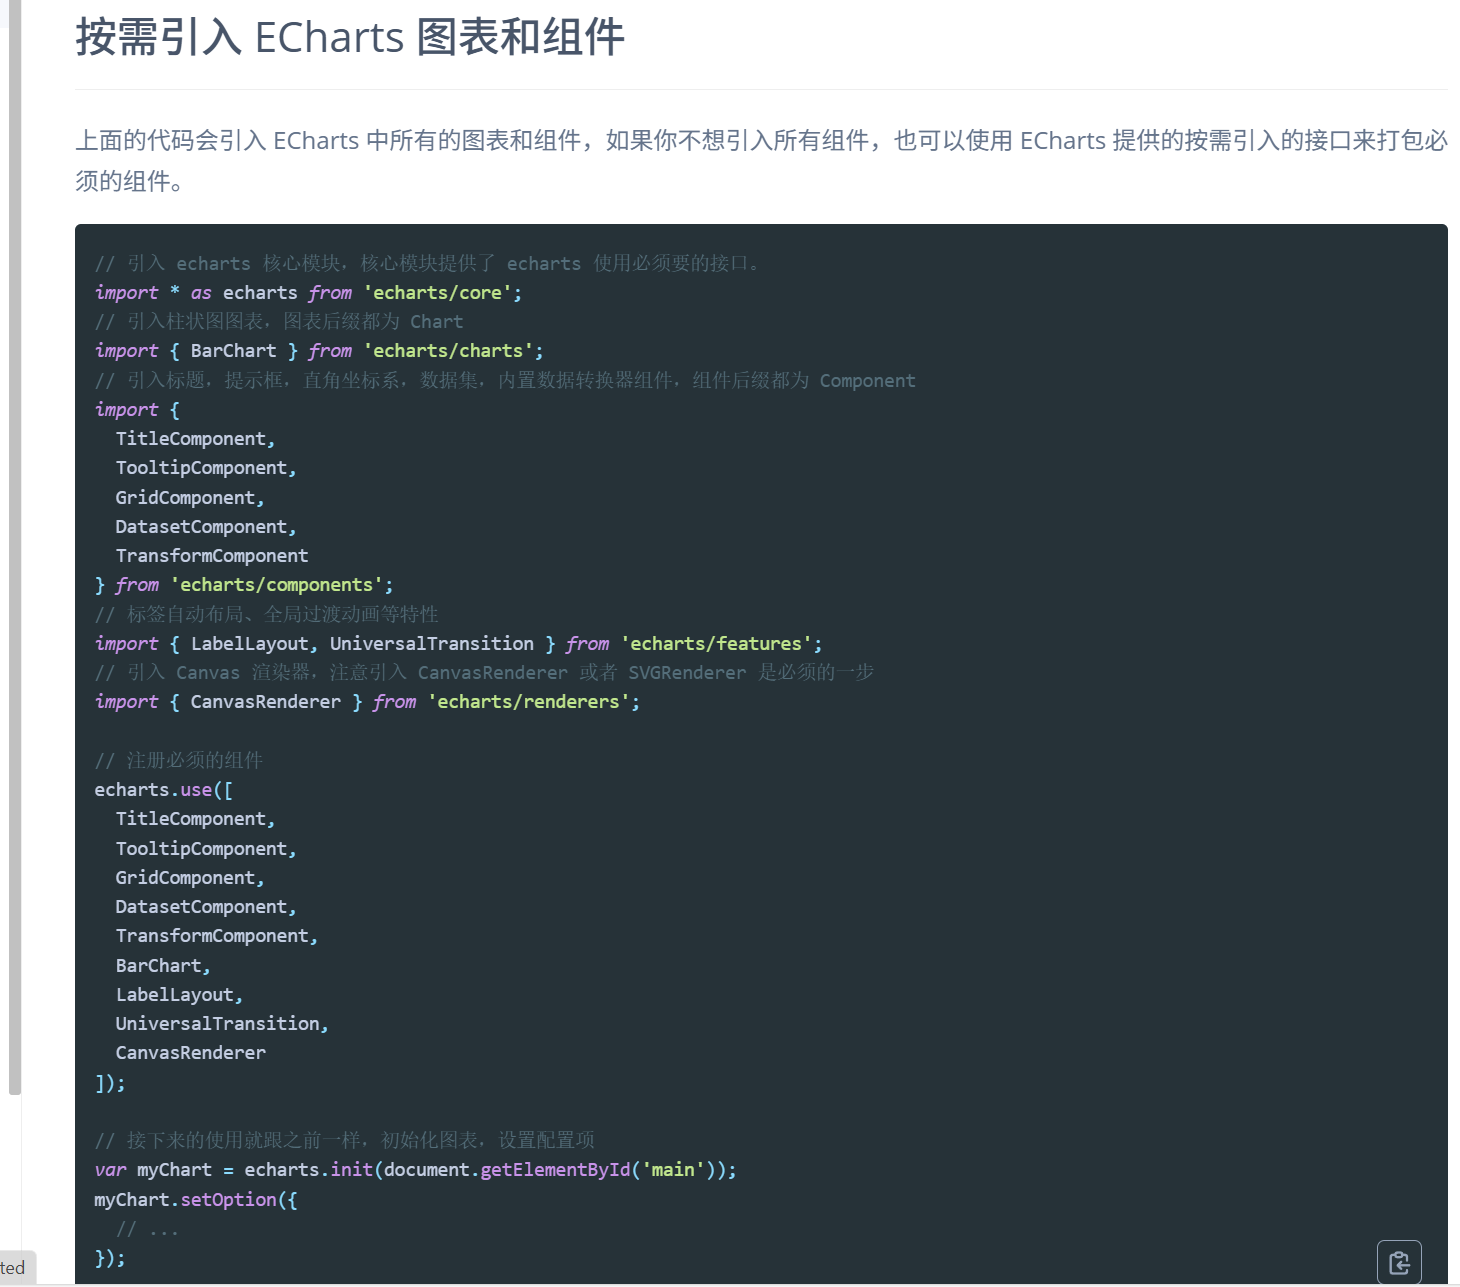
引入核心包
javascript
import * as echarts from 'echarts/core'引入图标类型
javascript
import { LineChart } from 'echarts/charts'引入需要使用的组件
javascript
import { GridComponent } from 'echarts/components' // 引入组件引入渲染器
javascript
import { CanvasRenderer } from 'echarts/renderers'注册所有引入
javascript
echarts.use([
  LineChart,
  GridComponent,
  CanvasRenderer
])
地图的使用步骤
首先获取json数据
init图表后,使用
javascript
this.$echarts.registerMap('china', res)创建地图实例
javascript
const initOption = {
        geo: {
          type: 'map',
          map: 'china'
        }
      }
在option中用geo绑定map的实例
javascript
this.chartInstance.setOption(initOption)创建图表
在地图中加入散点图
首先配置series
javascript
updataChart () {
      const seriesArr = this.mapData.map(item => {
        return {
          type: 'effectScatter',
          rippleEffect: {
            // 涟漪大小
            scale: 5,
            brushType: 'stroke' // 涟漪效果
          },
          name: item.name,
          data: item.children,
          //   散点使用地图坐标
          coordinateSystem: 'geo'
        }
      })
      const dataOption = {
        legend: {},
        series: seriesArr
      }
      this.chartInstance.setOption(dataOption)
    },
定义type为effectScatter
data为{name: xx, value: \[维度,维度},{ }, { }]格式 或 \[12, 14, 34, 50]直接这样的格式(具体看官网)
使用coordinateSystem: 'geo'绑定地图,使用地图坐标
legend会自动匹配给定的name
javascript
backChina () {
      const backOption = {
        geo: {
          map: 'china'
        }
      }
      this.chartInstance.setOption(backOption)
    },
对已有实例的图表只需要切换map就可以实现切换