文章的目的为了记录使用C# 开发学习的经历。开发流程和要点有些记忆模糊,赶紧记录,防止忘记。
相关链接:
推荐链接:
开源 C# .net mvc 开发(一)WEB搭建_c#部署web程序-CSDN博客
开源 C# .net mvc 开发(二)网站快速搭建_c#网站开发-CSDN博客
开源 C# .net mvc 开发(三)WEB内外网访问-CSDN博客
开源 C# .net mvc 开发(四)工程结构、页面提交以及显示-CSDN博客
开源 C# .net mvc 开发(五)常用代码快速开发_c# mvc开发-CSDN博客
开源 C# .net mvc 开发(六)发送邮件、定时以及CMD编程-CSDN博客
开源 C# .net mvc 开发(七)动态图片、动态表格和json数据生成-CSDN博客
开源 C# .net mvc 开发(八)IIS Express轻量化Web服务器的配置和使用-CSDN博客
开源 C# .net mvc 开发(九)websocket--服务器与客户端的实时通信-CSDN博客
本章节主要内容是:一个使用C# WinForms实现的实时波形图显示应用程序。展示了一个完整的实时数据可视化应用,包含了UI构建、事件处理、定时器管理和资源清理等关键环节。
1.源码分析
2.所有源码
3.效果演示
一、源码分析
- WaveformChart 类详细分析
1.1 构造函数和初始化
public WaveformChart()
{
    // 初始化数据系列 - 创建3个空的数据列表
    _dataSeries = new List<List<PointF>>();
    for (int i = 0; i < 3; i++)
    {
        _dataSeries.Add(new List<PointF>());
    }

    // 启用双缓冲防止闪烁
    this.DoubleBuffered = true;
    this.BackColor = _backgroundColor;
    this.Size = new Size(600, 400);

    // 生成测试数据
    InitializeTestData();
}
InitializeTestData() 函数:
private void InitializeTestData()
{
    Random rand = new Random();
    for (int series = 0; series < 3; series++)
    {
        for (int i = 0; i < 100; i++)
        {
            float x = i;
            // 生成带相位偏移和噪声的正弦波
            float y = (float)(Math.Sin(i * 0.1 + series * 2) * 0.8 + rand.NextDouble() * 0.2 - 0.1);
            _dataSeries[series].Add(new PointF(x, y));
        }
    }
}
1.2 数据操作函数
AddDataPoint() 函数:
public void AddDataPoint(int seriesIndex, float x, float y)
{
    // 参数验证
    if (seriesIndex < 0 || seriesIndex >= _dataSeries.Count)
        return;

    // 添加新数据点
    _dataSeries[seriesIndex].Add(new PointF(x, y));

    // 内存管理:限制数据点数量为500
    if (_dataSeries[seriesIndex].Count > 500)
    {
        _dataSeries[seriesIndex].RemoveAt(0); // 移除最旧的数据
    }

    // 自动调整X轴范围(滚动显示)
    if (x > _xMax)
    {
        _xMax = x + 10; // 预留10个单位的空间
    }

    Invalidate(); // 触发重绘
}
AddDataPoints() 函数:
public void AddDataPoints(int seriesIndex, IEnumerable<PointF> points)
{
    if (seriesIndex < 0 || seriesIndex >= _dataSeries.Count)
        return;

    _dataSeries[seriesIndex].AddRange(points); // 批量添加数据
    Invalidate();
}
ClearData() 函数:

csharp
public void ClearData(int seriesIndex = -1)
{
    if (seriesIndex == -1) // 清除所有系列
    {
        foreach (var series in _dataSeries)
        {
            series.Clear();
        }
    }
    else if (seriesIndex >= 0 && seriesIndex < _dataSeries.Count) // 清除指定系列
    {
        _dataSeries[seriesIndex].Clear();
    }

    Invalidate();
}
1.3 坐标转换函数
ValueToPixelX() 和 ValueToPixelY():
private float ValueToPixelX(float xValue)
{
    // 线性映射:数据值 → 像素坐标
    return _plotArea.Left + (xValue - _xMin) * _plotArea.Width / (_xMax - _xMin);
}

private float ValueToPixelY(float yValue)
{
    // Y轴需要反转(屏幕坐标从上到下,数学坐标从下到上)
    return _plotArea.Bottom - (yValue - _yMin) * _plotArea.Height / (_yMax - _yMin);
}
反向转换函数:
private float PixelToValueX(float xPixel)
{
    return _xMin + (xPixel - _plotArea.Left) * (_xMax - _xMin) / _plotArea.Width;
}

private float PixelToValueY(float yPixel)
{
    return _yMin + (_plotArea.Bottom - yPixel) * (_yMax - _yMin) / _plotArea.Height;
}
1.4 绘图函数
OnPaint() 主绘图函数:
protected override void OnPaint(PaintEventArgs e)
{
    base.OnPaint(e);
    Graphics g = e.Graphics;
    g.SmoothingMode = SmoothingMode.AntiAlias; // 抗锯齿

    // 计算绘图区域(扣除边距)
    _plotArea = new RectangleF(
        _chartMargin.Left,
        _chartMargin.Top,
        this.Width - _chartMargin.Horizontal,  // Width - (Left + Right)
        this.Height - _chartMargin.Vertical    // Height - (Top + Bottom)
    );

    // 分层绘制
    DrawBackground(g);     // 1. 背景
    DrawGrid(g);          // 2. 网格
    DrawAxes(g);          // 3. 坐标轴
    DrawDataSeries(g);    // 4. 数据线
    DrawLegend(g);        // 5. 图例
}
DrawGrid() 网格绘制函数:
private void DrawGrid(Graphics g)
{
    using (Pen gridPen = new Pen(_gridColor, 1))
    {
        gridPen.DashStyle = DashStyle.Dot; // 虚线网格

        // X轴网格线
        float xStep = (_xMax - _xMin) / _xGridCount;
        for (int i = 0; i <= _xGridCount; i++)
        {
            float xValue = _xMin + i * xStep;
            float xPixel = ValueToPixelX(xValue);
            g.DrawLine(gridPen, xPixel, _plotArea.Top, xPixel, _plotArea.Bottom);
        }

        // Y轴网格线
        float yStep = (_yMax - _yMin) / _yGridCount;
        for (int i = 0; i <= _yGridCount; i++)
        {
            float yValue = _yMin + i * yStep;
            float yPixel = ValueToPixelY(yValue);
            g.DrawLine(gridPen, _plotArea.Left, yPixel, _plotArea.Right, yPixel);
        }
    }
}
DrawAxes() 坐标轴绘制函数:
private void DrawAxes(Graphics g)
{
    using (Pen axisPen = new Pen(_axisColor, 2)) // 坐标轴更粗
    using (SolidBrush textBrush = new SolidBrush(_axisColor))
    {
        // 绘制X轴和Y轴
        g.DrawLine(axisPen, _plotArea.Left, _plotArea.Bottom, _plotArea.Right, _plotArea.Bottom);
        g.DrawLine(axisPen, _plotArea.Left, _plotArea.Top, _plotArea.Left, _plotArea.Bottom);

        // X轴刻度标签
        float xStep = (_xMax - _xMin) / _xGridCount;
        for (int i = 0; i <= _xGridCount; i++)
        {
            float xValue = _xMin + i * xStep;
            float xPixel = ValueToPixelX(xValue);

            // 刻度线
            g.DrawLine(axisPen, xPixel, _plotArea.Bottom, xPixel, _plotArea.Bottom + 5);

            // 标签文本(居中对齐)
            string label = xValue.ToString("F1");
            SizeF textSize = g.MeasureString(label, _axisFont);
            g.DrawString(label, _axisFont, textBrush,
                xPixel - textSize.Width / 2, _plotArea.Bottom + 8);
        }

        // Y轴刻度标签(类似X轴逻辑)

        // 坐标轴标题
        g.DrawString("时间 (s)", this.Font, textBrush, this.Width / 2 - 30, this.Height - 20);

        // Y轴标题旋转90度
        using (StringFormat format = new StringFormat())
        {
            format.Alignment = StringAlignment.Center;
            g.TranslateTransform(20, this.Height / 2);  // 移动坐标系
            g.RotateTransform(-90);                     // 旋转
            g.DrawString("幅度 (V)", this.Font, textBrush, 0, 0, format);
            g.ResetTransform();                         // 恢复坐标系
        }
    }
}
DrawDataSeries() 数据系列绘制函数:
private void DrawDataSeries(Graphics g, int seriesIndex)
{
    if (_dataSeries[seriesIndex].Count < 2) // 至少需要2个点才能画线
        return;

    using (Pen dataPen = new Pen(_seriesColors[seriesIndex], 2))
    {
        List<PointF> points = new List<PointF>();

        // 过滤和转换数据点
        foreach (PointF dataPoint in _dataSeries[seriesIndex])
        {
            float xPixel = ValueToPixelX(dataPoint.X);
            float yPixel = ValueToPixelY(dataPoint.Y);

            // 只添加可见区域内的点(优化性能)
            if (xPixel >= _plotArea.Left && xPixel <= _plotArea.Right)
            {
                points.Add(new PointF(xPixel, yPixel));
            }
        }

        // 使用DrawLines比多次DrawLine更高效
        if (points.Count >= 2)
        {
            g.DrawLines(dataPen, points.ToArray());
        }
    }
}- Form1 类详细分析
2.1 构造函数和初始化
public Form1()
{
    InitializeComponent();
    this.Text = "实时波形图演示";
    this.Size = new Size(900, 700);
    this.StartPosition = FormStartPosition.CenterScreen;

    SetupControls();  // 创建界面控件
    SetupTimer();     // 设置定时器
}
2.2 控件设置函数
SetupControls() 函数:
private void SetupControls()
{
    // 创建波形图控件
    waveformChart = new WaveformChart();
    waveformChart.Location = new Point(20, 80);
    waveformChart.Size = new Size(840, 500);
    this.Controls.Add(waveformChart);

    // 创建控制按钮
    btnStart = new Button() { Text = "开始", Location = new Point(20, 20), Size = new Size(80, 30) };
    btnStop = new Button() { Text = "停止", Location = new Point(110, 20), Size = new Size(80, 30) };
    btnClear = new Button() { Text = "清空", Location = new Point(200, 20), Size = new Size(80, 30) };

    // 按钮事件绑定
    btnStart.Click += (s, e) => dataTimer.Start();
    btnStop.Click += (s, e) => dataTimer.Stop();
    btnClear.Click += (s, e) => { waveformChart.ClearData(); timeCounter = 0; };

    this.Controls.AddRange(new Control[] { btnStart, btnStop, btnClear });

    AddAxisControls(); // 添加坐标轴控制
    // ... 状态标签等
}
AddAxisControls() 函数:
private void AddAxisControls()
{
    int yPos = 20;
    int xPos = 300;

    // X轴范围控件
    this.Controls.Add(new Label() { Text = "X轴:", Location = new Point(xPos, yPos + 5) });

    nudXMin = new NumericUpDown() { Location = new Point(xPos + 40, yPos), Size = new Size(60, 20) };
    nudXMin.Minimum = -1000m; nudXMin.Maximum = 1000m; nudXMin.Value = -10m;

    nudXMax = new NumericUpDown() { Location = new Point(xPos + 110, yPos), Size = new Size(60, 20) };
    nudXMax.Minimum = -1000m; nudXMax.Maximum = 1000m; nudXMax.Value = 100m;

    // 值改变事件
    nudXMin.ValueChanged += UpdateAxisRange;
    nudXMax.ValueChanged += UpdateAxisRange;

    // Y轴范围控件(类似逻辑)
    // ...
}
UpdateAxisRange() 函数:
private void UpdateAxisRange(object sender, EventArgs e)
{
    // 同步更新波形图的坐标轴范围
    waveformChart.XMin = (float)nudXMin.Value;
    waveformChart.XMax = (float)nudXMax.Value;
    waveformChart.YMin = (float)nudYMin.Value;
    waveformChart.YMax = (float)nudYMax.Value;
}
2.3 定时器相关函数
SetupTimer() 函数:
private void SetupTimer()
{
    dataTimer = new System.Timers.Timer(100); // 100ms间隔 = 10Hz更新频率
    dataTimer.Elapsed += OnTimerElapsed;
    dataTimer.SynchronizingObject = this; // 关键:确保在UI线程执行
}
OnTimerElapsed() 核心数据生成函数:

csharp
private void OnTimerElapsed(object sender, ElapsedEventArgs e)
{
    // 时间计数器递增
    timeCounter += 0.1f;

    // 系列1: 标准正弦波 + 噪声
    float y1 = (float)(Math.Sin(timeCounter) * 1.0 + random.NextDouble() * 0.2 - 0.1);
    waveformChart.AddDataPoint(0, timeCounter, y1);

    // 系列2: 频率减半的余弦波 + 噪声
    float y2 = (float)(Math.Cos(timeCounter * 0.5) * 0.8 + random.NextDouble() * 0.15 - 0.075);
    waveformChart.AddDataPoint(1, timeCounter, y2);

    // 系列3: 方波(基于正弦波符号) + 更大噪声
    float y3 = (float)((Math.Sin(timeCounter * 2) > 0 ? 0.5 : -0.5) + random.NextDouble() * 0.3 - 0.15);
    waveformChart.AddDataPoint(2, timeCounter, y3);

    // 更新状态显示
    lblStatus.Text = $"状态: 运行中 - 时间: {timeCounter:F1}s";
}- 关键技术和设计模式
3.1 性能优化技术
双缓冲:DoubleBuffered = true 防止闪烁
数据量控制:限制为500个数据点
局部绘制:只绘制可见区域内的点
批量绘图:使用DrawLines而非多次DrawLine
3.2 线程安全
SynchronizingObject = this 确保定时器回调在UI线程执行
避免跨线程访问UI控件的问题
二、所有源码
WaveformChart .cs文件源码
using System;
using System.Collections.Generic;
using System.Linq;
using System.Text;

using System.Drawing;
using System.Drawing.Drawing2D;
using System.Windows.Forms;

namespace _3_wave
{
    class WaveformChart : Control
    {
        #region 属性和字段

        // 数据系列
        private List<List<PointF>> _dataSeries;
        private Color[] _seriesColors = { Color.Red, Color.Green, Color.Blue };
        private string[] _seriesNames = { "系列1", "系列2", "系列3" };

        // 坐标轴设置
        private float _xMin = 0;
        private float _xMax = 100;
        private float _yMin = -1;
        private float _yMax = 1;

        // 外观设置
        private Color _backgroundColor = Color.Black;
        private Color _gridColor = Color.FromArgb(50, 100, 100, 100);
        private Color _axisColor = Color.White;
        private Font _axisFont = new Font("Arial", 8);

        // 网格设置
        private int _xGridCount = 10;
        private int _yGridCount = 8;

        // 边距
        private Padding _chartMargin = new Padding(60, 40, 20, 40);

        // 绘图区域
        private RectangleF _plotArea;

        #endregion

        #region 属性公开接口

        public float XMin
        {
            get => _xMin;
            set { _xMin = value; Invalidate(); }
        }

        public float XMax
        {
            get => _xMax;
            set { _xMax = value; Invalidate(); }
        }

        public float YMin
        {
            get => _yMin;
            set { _yMin = value; Invalidate(); }
        }

        public float YMax
        {
            get => _yMax;
            set { _yMax = value; Invalidate(); }
        }

        public Color[] SeriesColors
        {
            get => _seriesColors;
            set { _seriesColors = value; Invalidate(); }
        }

        public string[] SeriesNames
        {
            get => _seriesNames;
            set { _seriesNames = value; Invalidate(); }
        }

        #endregion

        #region 构造函数

        public WaveformChart()
        {
            // 初始化数据系列
            _dataSeries = new List<List<PointF>>();
            for (int i = 0; i < 3; i++)
            {
                _dataSeries.Add(new List<PointF>());
            }

            // 控件设置
            this.DoubleBuffered = true;
            this.BackColor = _backgroundColor;
            this.Size = new Size(600, 400);

            // 初始化测试数据
            InitializeTestData();
        }

        private void InitializeTestData()
        {
            // 为每个系列添加一些初始数据
            Random rand = new Random();
            for (int series = 0; series < 3; series++)
            {
                for (int i = 0; i < 100; i++)
                {
                    float x = i;
                    float y = (float)(Math.Sin(i * 0.1 + series * 2) * 0.8 + rand.NextDouble() * 0.2 - 0.1);
                    _dataSeries[series].Add(new PointF(x, y));
                }
            }
        }

        #endregion

        #region 数据操作

        public void AddDataPoint(int seriesIndex, float x, float y)
        {
            if (seriesIndex < 0 || seriesIndex >= _dataSeries.Count)
                return;

            _dataSeries[seriesIndex].Add(new PointF(x, y));

            // 限制数据点数量,避免内存过度增长
            if (_dataSeries[seriesIndex].Count > 500)
            {
                _dataSeries[seriesIndex].RemoveAt(0);
            }

            // 自动调整X轴范围
            if (x > _xMax)
            {
                _xMax = x + 10;
            }

            Invalidate();
        }

        public void AddDataPoints(int seriesIndex, IEnumerable<PointF> points)
        {
            if (seriesIndex < 0 || seriesIndex >= _dataSeries.Count)
                return;

            _dataSeries[seriesIndex].AddRange(points);
            Invalidate();
        }

        public void ClearData(int seriesIndex = -1)
        {
            if (seriesIndex == -1)
            {
                foreach (var series in _dataSeries)
                {
                    series.Clear();
                }
            }
            else if (seriesIndex >= 0 && seriesIndex < _dataSeries.Count)
            {
                _dataSeries[seriesIndex].Clear();
            }

            Invalidate();
        }

        #endregion

        #region 绘图方法

        protected override void OnPaint(PaintEventArgs e)
        {
            base.OnPaint(e);

            Graphics g = e.Graphics;
            g.SmoothingMode = SmoothingMode.AntiAlias;

            // 计算绘图区域
            _plotArea = new RectangleF(
                _chartMargin.Left,
                _chartMargin.Top,
                this.Width - _chartMargin.Horizontal,
                this.Height - _chartMargin.Vertical
            );

            // 绘制背景和网格
            DrawBackground(g);
            DrawGrid(g);
            DrawAxes(g);

            // 绘制数据系列
            for (int i = 0; i < _dataSeries.Count; i++)
            {
                DrawDataSeries(g, i);
            }

            // 绘制图例
            DrawLegend(g);
        }

        private void DrawBackground(Graphics g)
        {
            using (SolidBrush brush = new SolidBrush(_backgroundColor))
            {
                g.FillRectangle(brush, this.ClientRectangle);
            }
        }

        private void DrawGrid(Graphics g)
        {
            using (Pen gridPen = new Pen(_gridColor, 1))
            {
                gridPen.DashStyle = DashStyle.Dot;

                // 绘制垂直网格线
                float xStep = (_xMax - _xMin) / _xGridCount;
                for (int i = 0; i <= _xGridCount; i++)
                {
                    float xValue = _xMin + i * xStep;
                    float xPixel = ValueToPixelX(xValue);
                    g.DrawLine(gridPen, xPixel, _plotArea.Top, xPixel, _plotArea.Bottom);
                }

                // 绘制水平网格线
                float yStep = (_yMax - _yMin) / _yGridCount;
                for (int i = 0; i <= _yGridCount; i++)
                {
                    float yValue = _yMin + i * yStep;
                    float yPixel = ValueToPixelY(yValue);
                    g.DrawLine(gridPen, _plotArea.Left, yPixel, _plotArea.Right, yPixel);
                }
            }
        }

        private void DrawAxes(Graphics g)
        {
            using (Pen axisPen = new Pen(_axisColor, 2))
            using (SolidBrush textBrush = new SolidBrush(_axisColor))
            {
                // 绘制坐标轴
                g.DrawLine(axisPen, _plotArea.Left, _plotArea.Bottom, _plotArea.Right, _plotArea.Bottom); // X轴
                g.DrawLine(axisPen, _plotArea.Left, _plotArea.Top, _plotArea.Left, _plotArea.Bottom);   // Y轴

                // 绘制X轴刻度标签
                float xStep = (_xMax - _xMin) / _xGridCount;
                for (int i = 0; i <= _xGridCount; i++)
                {
                    float xValue = _xMin + i * xStep;
                    float xPixel = ValueToPixelX(xValue);

                    // 绘制刻度线
                    g.DrawLine(axisPen, xPixel, _plotArea.Bottom, xPixel, _plotArea.Bottom + 5);

                    // 绘制标签
                    string label = xValue.ToString("F1");
                    SizeF textSize = g.MeasureString(label, _axisFont);
                    g.DrawString(label, _axisFont, textBrush,
                        xPixel - textSize.Width / 2, _plotArea.Bottom + 8);
                }

                // 绘制Y轴刻度标签
                float yStep = (_yMax - _yMin) / _yGridCount;
                for (int i = 0; i <= _yGridCount; i++)
                {
                    float yValue = _yMin + i * yStep;
                    float yPixel = ValueToPixelY(yValue);

                    // 绘制刻度线
                    g.DrawLine(axisPen, _plotArea.Left - 5, yPixel, _plotArea.Left, yPixel);

                    // 绘制标签
                    string label = yValue.ToString("F1");
                    SizeF textSize = g.MeasureString(label, _axisFont);
                    g.DrawString(label, _axisFont, textBrush,
                        _plotArea.Left - textSize.Width - 5, yPixel - textSize.Height / 2);
                }

                // 绘制坐标轴标题
                g.DrawString("时间 (s)", this.Font, textBrush,
                    this.Width / 2 - 30, this.Height - 20);

                using (StringFormat format = new StringFormat())
                {
                    format.Alignment = StringAlignment.Center;
                    g.TranslateTransform(20, this.Height / 2);
                    g.RotateTransform(-90);
                    g.DrawString("幅度 (V)", this.Font, textBrush, 0, 0, format);
                    g.ResetTransform();
                }
            }
        }

        private void DrawDataSeries(Graphics g, int seriesIndex)
        {
            if (_dataSeries[seriesIndex].Count < 2)
                return;

            using (Pen dataPen = new Pen(_seriesColors[seriesIndex], 2))
            {
                List<PointF> points = new List<PointF>();

                foreach (PointF dataPoint in _dataSeries[seriesIndex])
                {
                    float xPixel = ValueToPixelX(dataPoint.X);
                    float yPixel = ValueToPixelY(dataPoint.Y);

                    // 只添加在可见区域内的点
                    if (xPixel >= _plotArea.Left && xPixel <= _plotArea.Right)
                    {
                        points.Add(new PointF(xPixel, yPixel));
                    }
                }

                if (points.Count >= 2)
                {
                    g.DrawLines(dataPen, points.ToArray());
                }
            }
        }

        private void DrawLegend(Graphics g)
        {
            using (SolidBrush textBrush = new SolidBrush(_axisColor))
            {
                float legendX = _plotArea.Right + 10;
                float legendY = _plotArea.Top;

                for (int i = 0; i < _seriesColors.Length; i++)
                {
                    using (SolidBrush colorBrush = new SolidBrush(_seriesColors[i]))
                    {
                        g.FillRectangle(colorBrush, legendX, legendY + i * 20, 15, 10);
                    }

                    g.DrawString(_seriesNames[i], _axisFont, textBrush, legendX + 20, legendY + i * 20);
                }
            }
        }

        #endregion

        #region 坐标转换

        private float ValueToPixelX(float xValue)
        {
            return _plotArea.Left + (xValue - _xMin) * _plotArea.Width / (_xMax - _xMin);
        }

        private float ValueToPixelY(float yValue)
        {
            return _plotArea.Bottom - (yValue - _yMin) * _plotArea.Height / (_yMax - _yMin);
        }

        private float PixelToValueX(float xPixel)
        {
            return _xMin + (xPixel - _plotArea.Left) * (_xMax - _xMin) / _plotArea.Width;
        }

        private float PixelToValueY(float yPixel)
        {
            return _yMin + (_plotArea.Bottom - yPixel) * (_yMax - _yMin) / _plotArea.Height;
        }

        #endregion

        protected override void OnResize(EventArgs e)
        {
            base.OnResize(e);
            Invalidate();
        }
    }
}
Form1.cs文件源码
using System;
using System.Collections.Generic;
using System.ComponentModel;
using System.Data;
using System.Drawing;
using System.Linq;
using System.Text;
using System.Windows.Forms;
using System;
using System.Drawing;
using System.Timers;
using System.Windows.Forms;
namespace _3_wave
{
public partial class Form1 : Form
{
private WaveformChart waveformChart;
private System.Timers.Timer dataTimer;
private Random random;
private float timeCounter = 0;
// 控件
private Button btnStart, btnStop, btnClear;
private NumericUpDown nudXMin, nudXMax, nudYMin, nudYMax;
private Label lblStatus;
public Form1()
{
InitializeComponent();
this.Text = "实时波形图演示";
this.Size = new Size(900, 700);
this.StartPosition = FormStartPosition.CenterScreen;
this.BackColor = Color.White;
SetupControls();
SetupTimer();
}
private void SetupControls()
{
// 创建波形图控件
waveformChart = new WaveformChart();
waveformChart.Location = new Point(20, 80);
waveformChart.Size = new Size(840, 500);
this.Controls.Add(waveformChart);
// 创建控制按钮
btnStart = new Button() { Text = "开始", Location = new Point(20, 20), Size = new Size(80, 30) };
btnStop = new Button() { Text = "停止", Location = new Point(110, 20), Size = new Size(80, 30) };
btnClear = new Button() { Text = "清空", Location = new Point(200, 20), Size = new Size(80, 30) };
btnStart.Click += (s, e) => dataTimer.Start();
btnStop.Click += (s, e) => dataTimer.Stop();
btnClear.Click += (s, e) => { waveformChart.ClearData(); timeCounter = 0; };
this.Controls.AddRange(new Control[] { btnStart, btnStop, btnClear });
// 创建坐标轴范围设置
AddAxisControls();
// 状态标签
lblStatus = new Label()
{
Text = "状态: 已停止",
Location = new Point(500, 25),
Size = new Size(200, 20),
ForeColor = Color.Blue
};
this.Controls.Add(lblStatus);
random = new Random();
}
private void AddAxisControls()
{
int yPos = 20;
int xPos = 300;
// X轴范围
this.Controls.Add(new Label() { Text = "X轴:", Location = new Point(xPos, yPos + 5), AutoSize = true });
nudXMin = new NumericUpDown()
{
Location = new Point(xPos + 40, yPos),
Size = new Size(60, 20)
};
// 先设置范围,再设置值
nudXMin.Minimum = -1000m;
nudXMin.Maximum = 1000m;
nudXMin.Value = -10m; // 现在这个值在范围内
nudXMax = new NumericUpDown()
{
Location = new Point(xPos + 110, yPos),
Size = new Size(60, 20)
};
nudXMax.Minimum = -1000m;
nudXMax.Maximum = 1000m;
nudXMax.Value = 100m;
nudXMin.ValueChanged += UpdateAxisRange;
nudXMax.ValueChanged += UpdateAxisRange;
// Y轴范围
this.Controls.Add(new Label() { Text = "Y轴:", Location = new Point(xPos + 190, yPos + 5), AutoSize = true });
nudYMin = new NumericUpDown()
{
Location = new Point(xPos + 230, yPos),
Size = new Size(60, 20),
DecimalPlaces = 1
};
nudYMin.Minimum = -100m;
nudYMin.Maximum = 100m;
nudYMin.Value = -1.5m;
nudYMax = new NumericUpDown()
{
Location = new Point(xPos + 300, yPos),
Size = new Size(60, 20),
DecimalPlaces = 1
};
nudYMax.Minimum = -100m;
nudYMax.Maximum = 100m;
nudYMax.Value = 1.5m;
nudYMin.ValueChanged += UpdateAxisRange;
nudYMax.ValueChanged += UpdateAxisRange;
this.Controls.AddRange(new Control[] { nudXMin, nudXMax, nudYMin, nudYMax });
}
private void UpdateAxisRange(object sender, EventArgs e)
{
waveformChart.XMin = (float)nudXMin.Value;
waveformChart.XMax = (float)nudXMax.Value;
waveformChart.YMin = (float)nudYMin.Value;
waveformChart.YMax = (float)nudYMax.Value;
}
private void SetupTimer()
{
dataTimer = new System.Timers.Timer(100); // 100ms间隔
dataTimer.Elapsed += OnTimerElapsed;
dataTimer.SynchronizingObject = this; // 确保在UI线程执行
}
private void OnTimerElapsed(object sender, ElapsedEventArgs e)
{
// 生成测试数据:三条不同的波形
timeCounter += 0.1f;
// 系列1: 正弦波
float y1 = (float)(Math.Sin(timeCounter) * 1.0 + random.NextDouble() * 0.2 - 0.1);
waveformChart.AddDataPoint(0, timeCounter, y1);
// 系列2: 余弦波
float y2 = (float)(Math.Cos(timeCounter * 0.5) * 0.8 + random.NextDouble() * 0.15 - 0.075);
waveformChart.AddDataPoint(1, timeCounter, y2);
// 系列3: 方波 + 噪声
float y3 = (float)((Math.Sin(timeCounter * 2) > 0 ? 0.5 : -0.5) + random.NextDouble() * 0.3 - 0.15);
waveformChart.AddDataPoint(2, timeCounter, y3);
// 更新状态
lblStatus.Text = $"状态: 运行中 - 时间: {timeCounter:F1}s";
}
protected override void OnFormClosing(FormClosingEventArgs e)
{
dataTimer?.Stop();
dataTimer?.Dispose();
base.OnFormClosing(e);
}
}
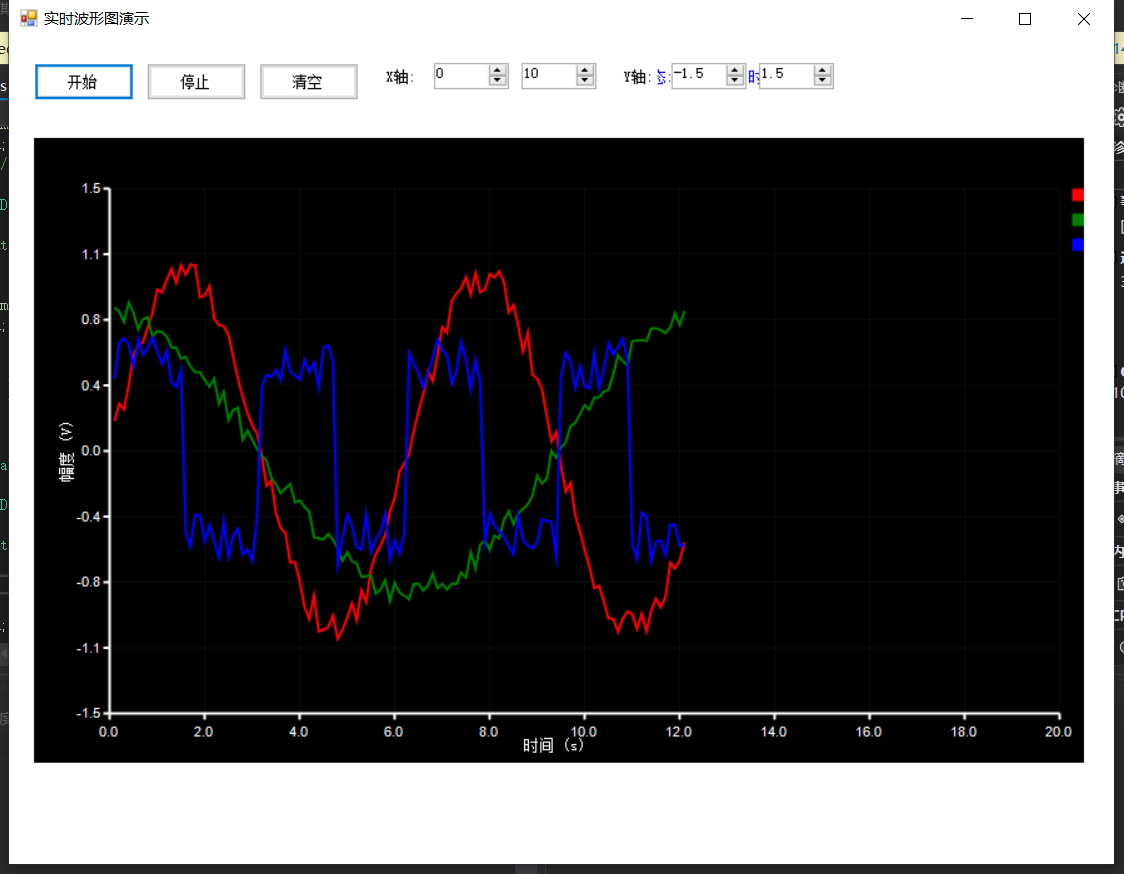
}三、效果演示
设置x轴,y轴,清空后开始,波形图开始刷新。