D3.js 是一个基于 JavaScript 的开源数据可视化库,由数据可视化专家 Mike Bostock 创建,旨在通过数据驱动的方式动态生成和操作文档。它利用 Web 标准(HTML、SVG 和 CSS)将数据转化为直观的图形,帮助开发者构建高度定制化、交互性强的可视化应用。
<!DOCTYPE html>
<html lang="en">
<head>
<meta charset="UTF-8">
<title>D3.js 简单柱状图</title>
<script src="https://d3js.org/d3.v7.min.js"></script>
<style>
.bar { fill: steelblue; }
.bar:hover { fill: orange; }
.axis-label { font-size: 12px; text-anchor: middle; }
</style>
</head>
<body>
<!-- 图表容器 -->
<svg width="500" height="300"></svg>
<script>
// 1. 准备数据
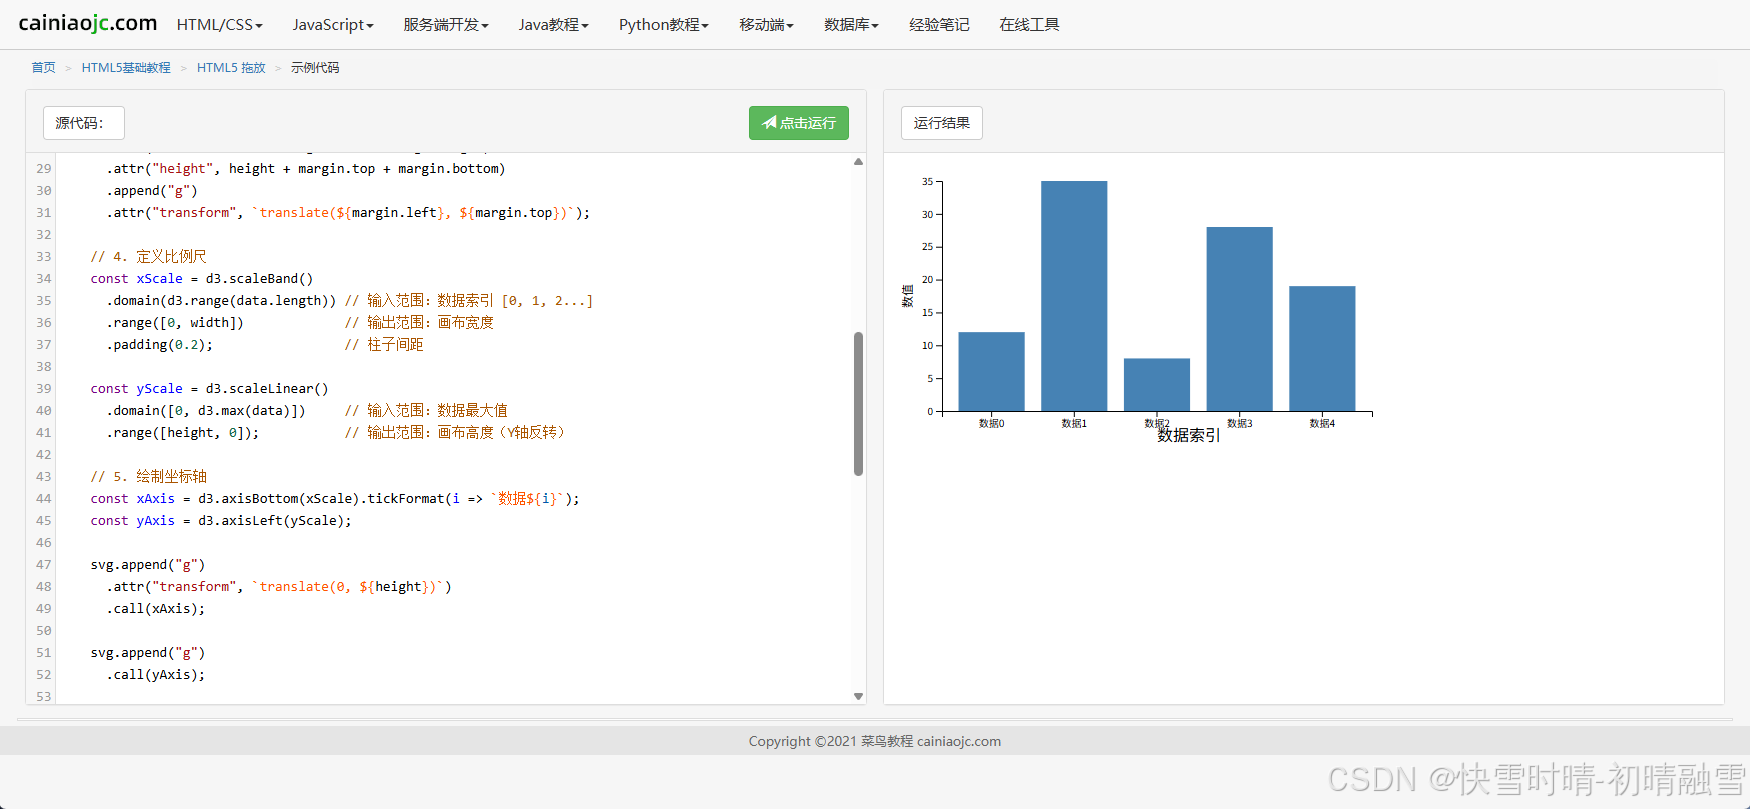
const data = [12, 35, 8, 28, 19];
// 2. 设置图表尺寸和边距
const margin = { top: 20, right: 20, bottom: 50, left: 50 };
const width = 500 - margin.left - margin.right;
const height = 300 - margin.top - margin.bottom;
// 3. 创建SVG画布并平移(留出边距)
const svg = d3.select("svg")
.attr("width", width + margin.left + margin.right)
.attr("height", height + margin.top + margin.bottom)
.append("g")
.attr("transform", `translate(${margin.left}, ${margin.top})`);
// 4. 定义比例尺
const xScale = d3.scaleBand()
.domain(d3.range(data.length)) // 输入范围:数据索引 [0, 1, 2...]
.range([0, width]) // 输出范围:画布宽度
.padding(0.2); // 柱子间距
const yScale = d3.scaleLinear()
.domain([0, d3.max(data)]) // 输入范围:数据最大值
.range([height, 0]); // 输出范围:画布高度(Y轴反转)
// 5. 绘制坐标轴
const xAxis = d3.axisBottom(xScale).tickFormat(i => `数据${i}`);
const yAxis = d3.axisLeft(yScale);
svg.append("g")
.attr("transform", `translate(0, ${height})`)
.call(xAxis);
svg.append("g")
.call(yAxis);
// 6. 添加坐标轴标签
svg.append("text")
.attr("class", "axislabel")
.attr("x", width / 2)
.attr("y", height + 30)
.text("数据索引");
svg.append("text")
.attr("class", "axis-label")
.attr("transform", "rotate(-90)")
.attr("x", -height / 2)
.attr("y", -30)
.text("数值");
// 7. 绑定数据并绘制柱子
svg.selectAll(".bar")
.data(data)
.enter()
.append("rect")
.attr("class", "bar")
.attr("x", (d, i) => xScale(i)) // X位置:索引映射
.attr("y", d => yScale(d)) // Y位置:数值映射
.attr("width", xScale.bandwidth()) // 宽度:自动计算
.attr("height", d => height - yScale(d)); // 高度:画布高度 - Y位置
// 8. 添加交互:鼠标悬停高亮
svg.selectAll(".bar")
.on("mouseover", function() {
d3.select(this).style("fill", "red");
})
.on("mouseout", function() {
d3.select(this).style("fill", "steelblue");
});
</script>
</body>
</html>