Grafana
Grafana是一款用开源数据可视化工具,可以做数据监控和数据统计,用于监控的可视化,带有告警功能。
Grafana 配置Dashboards(仪表板)
可以使用 Prometheus 监控, 在Grafana的仪表板上进行可视化。
详情见: https://blog.csdn.net/Hu_wen/article/details/136940949
Dashboards(仪表板)示例:
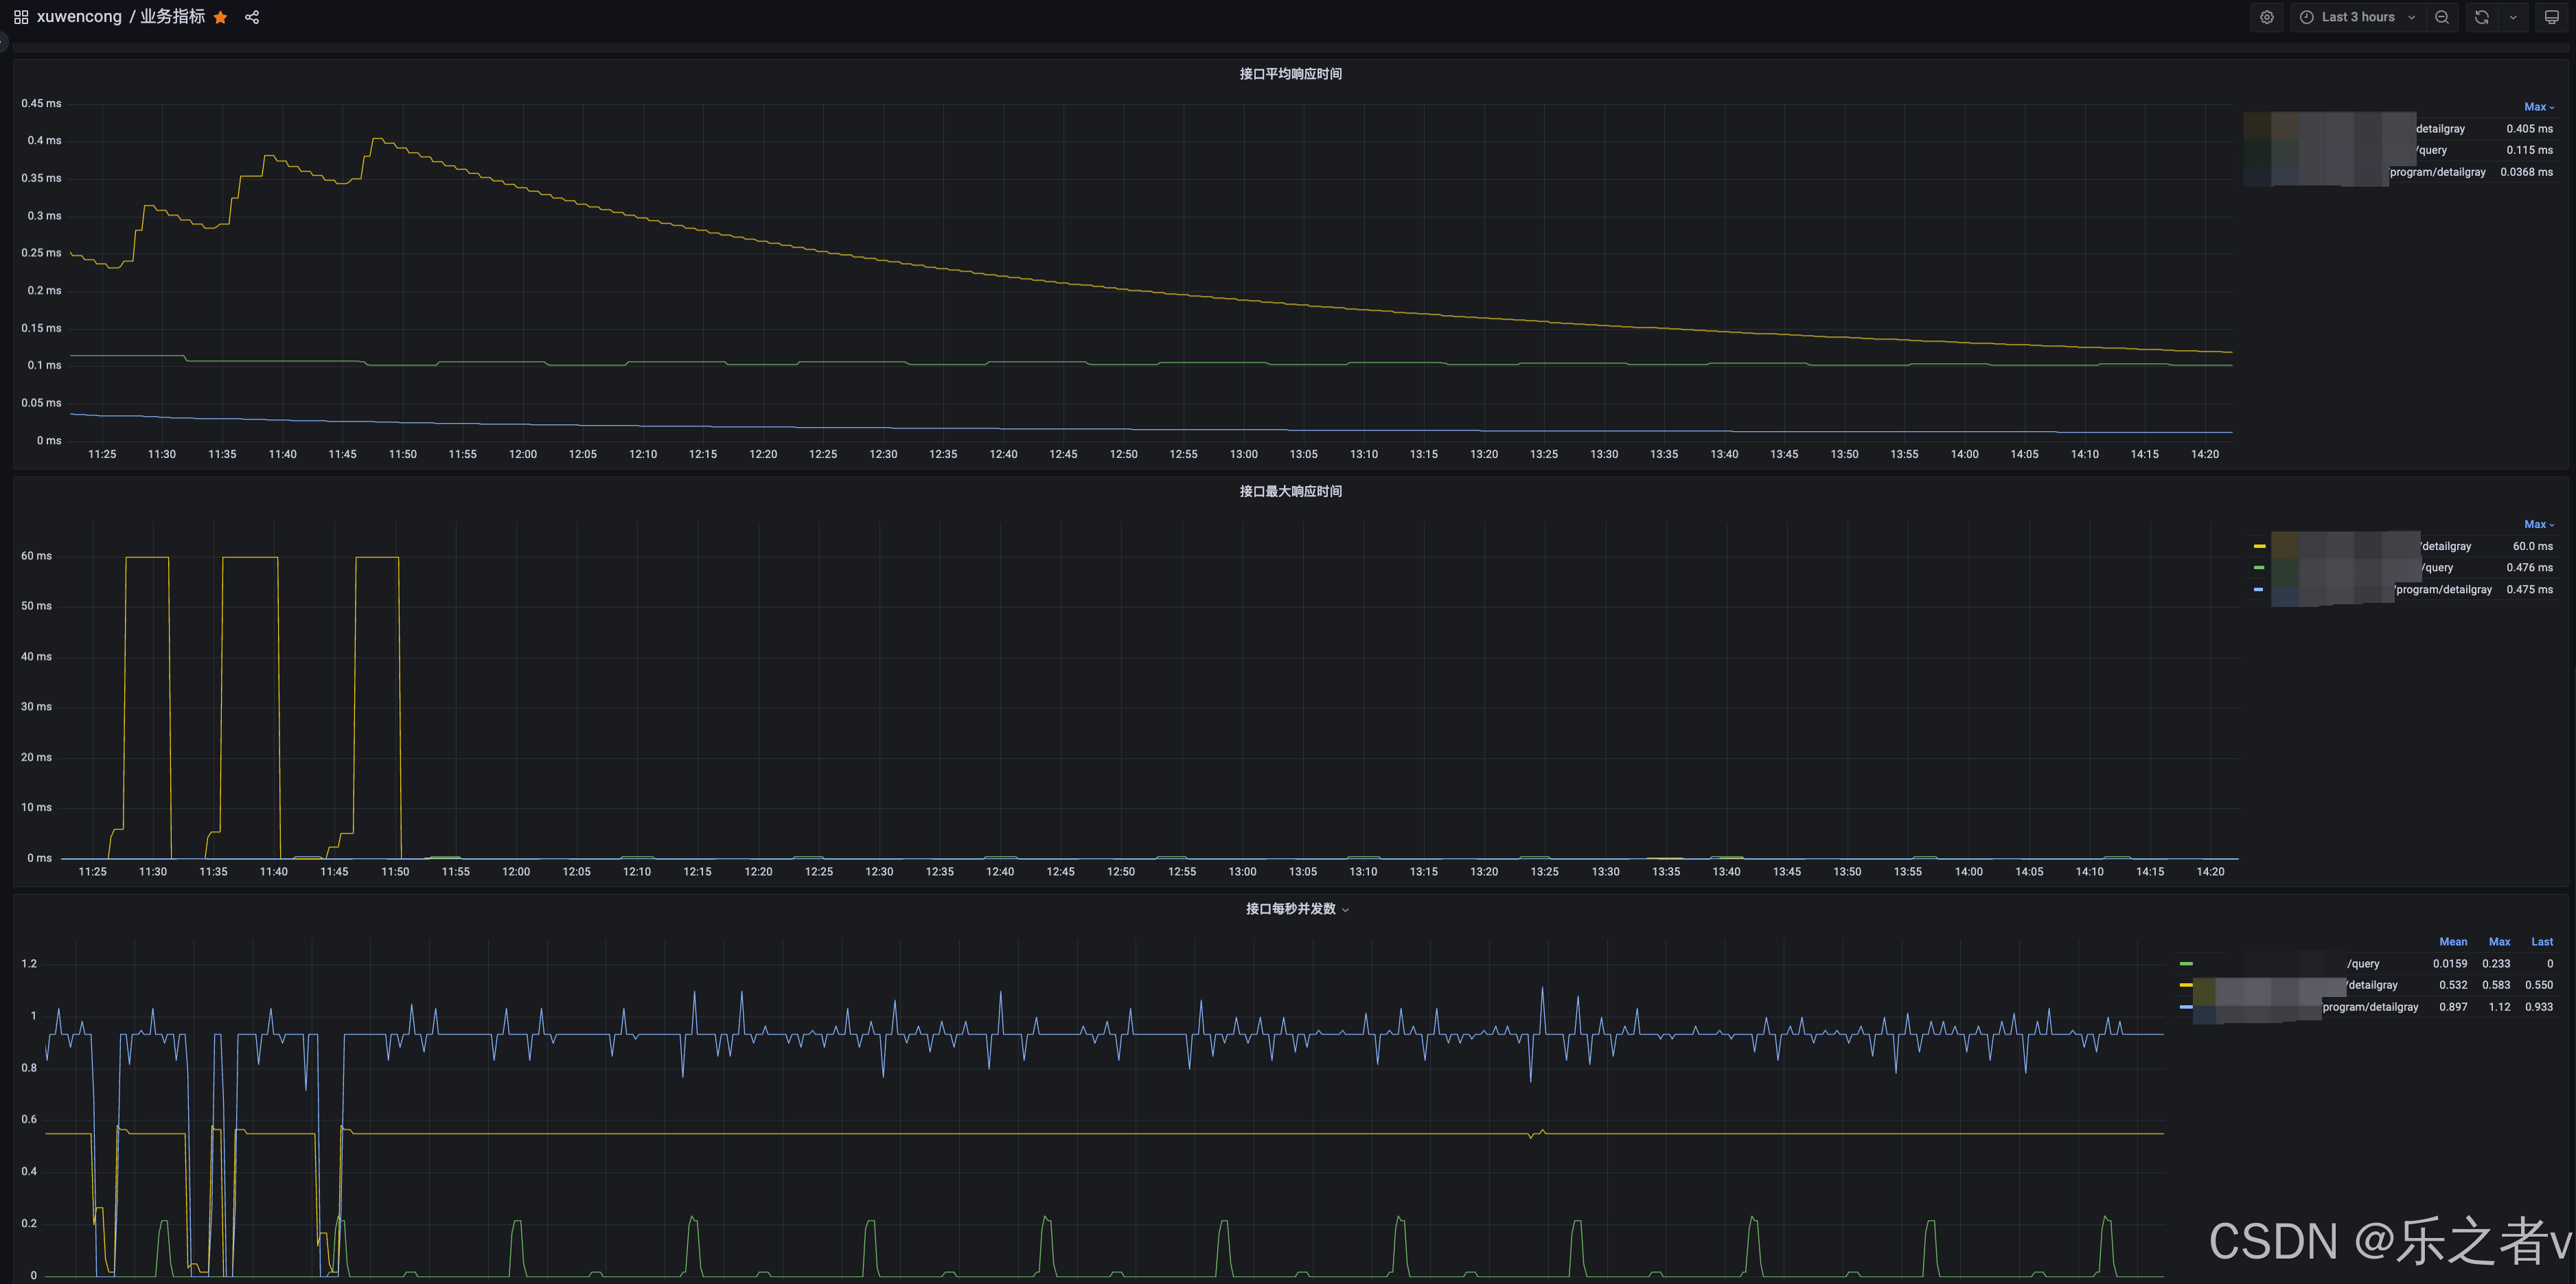
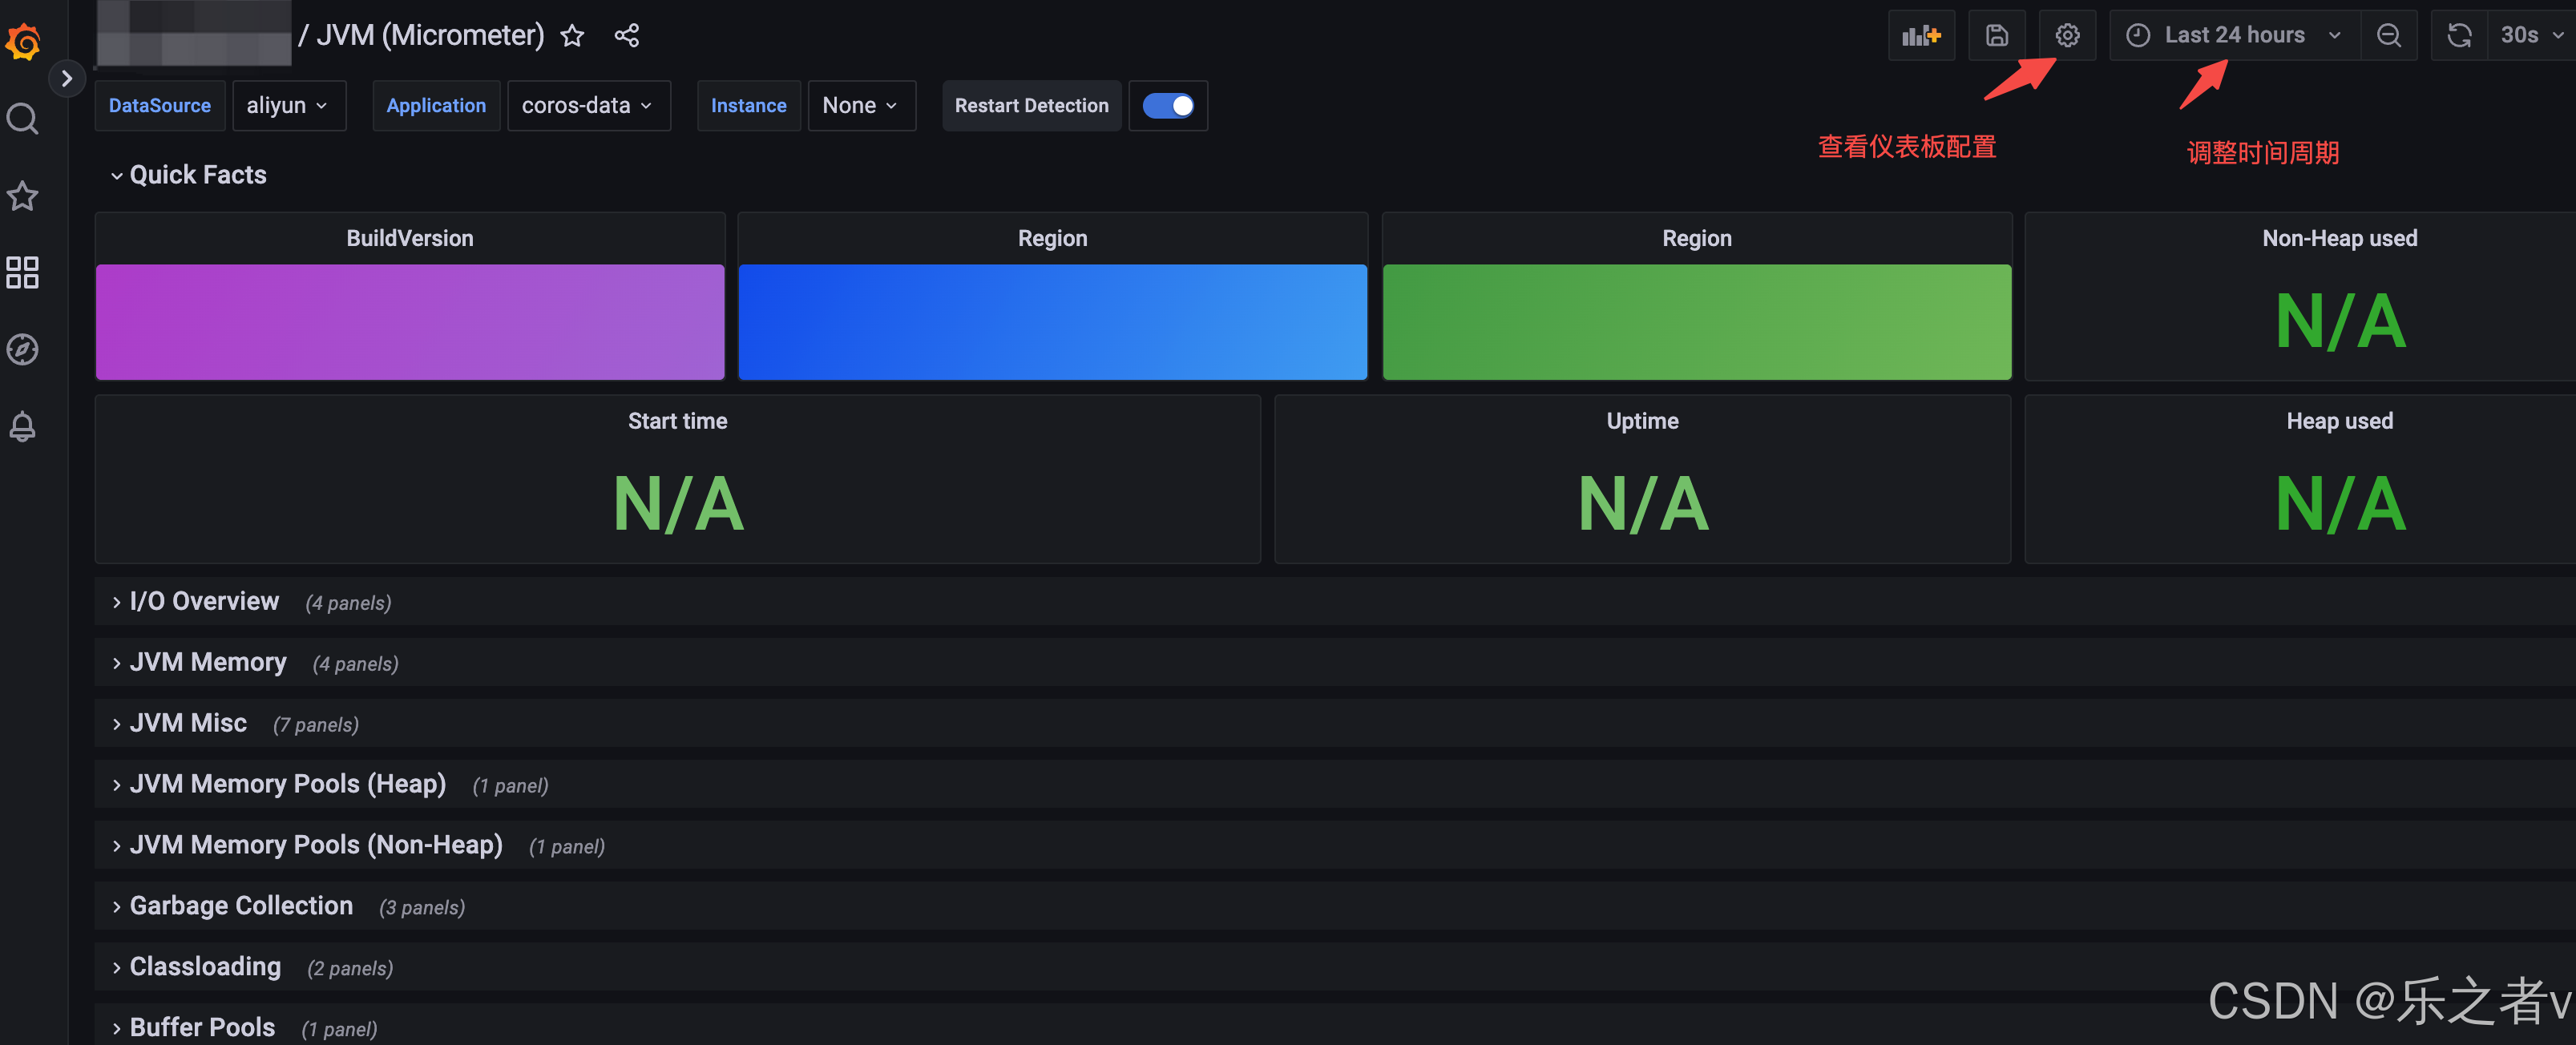
查看Dashboards(仪表板)配置:
左上角的 DataSource 是数据源, Application 是应用名称。
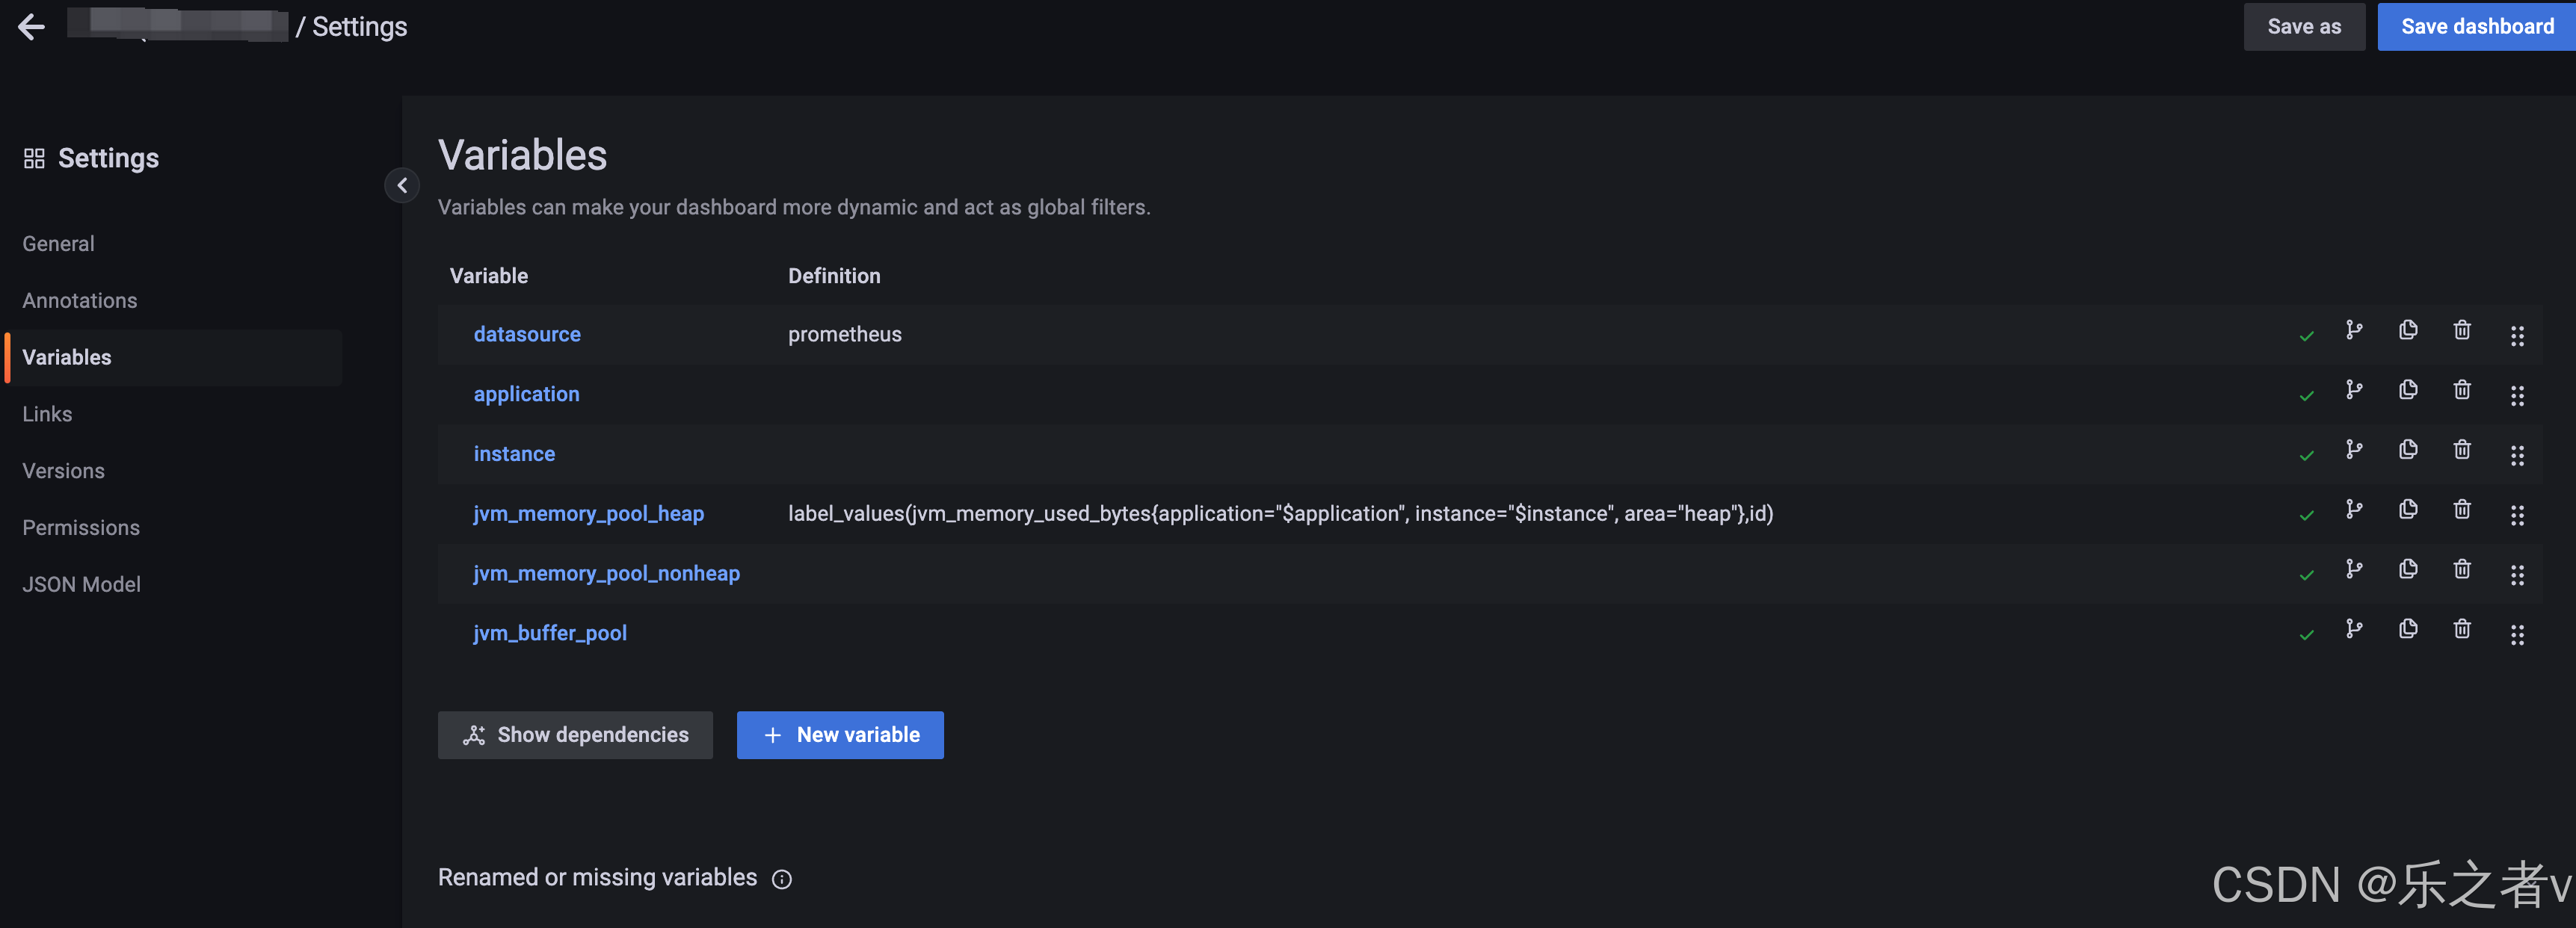
Dashboards(仪表板)变量:
Dashboards(仪表板)配置:
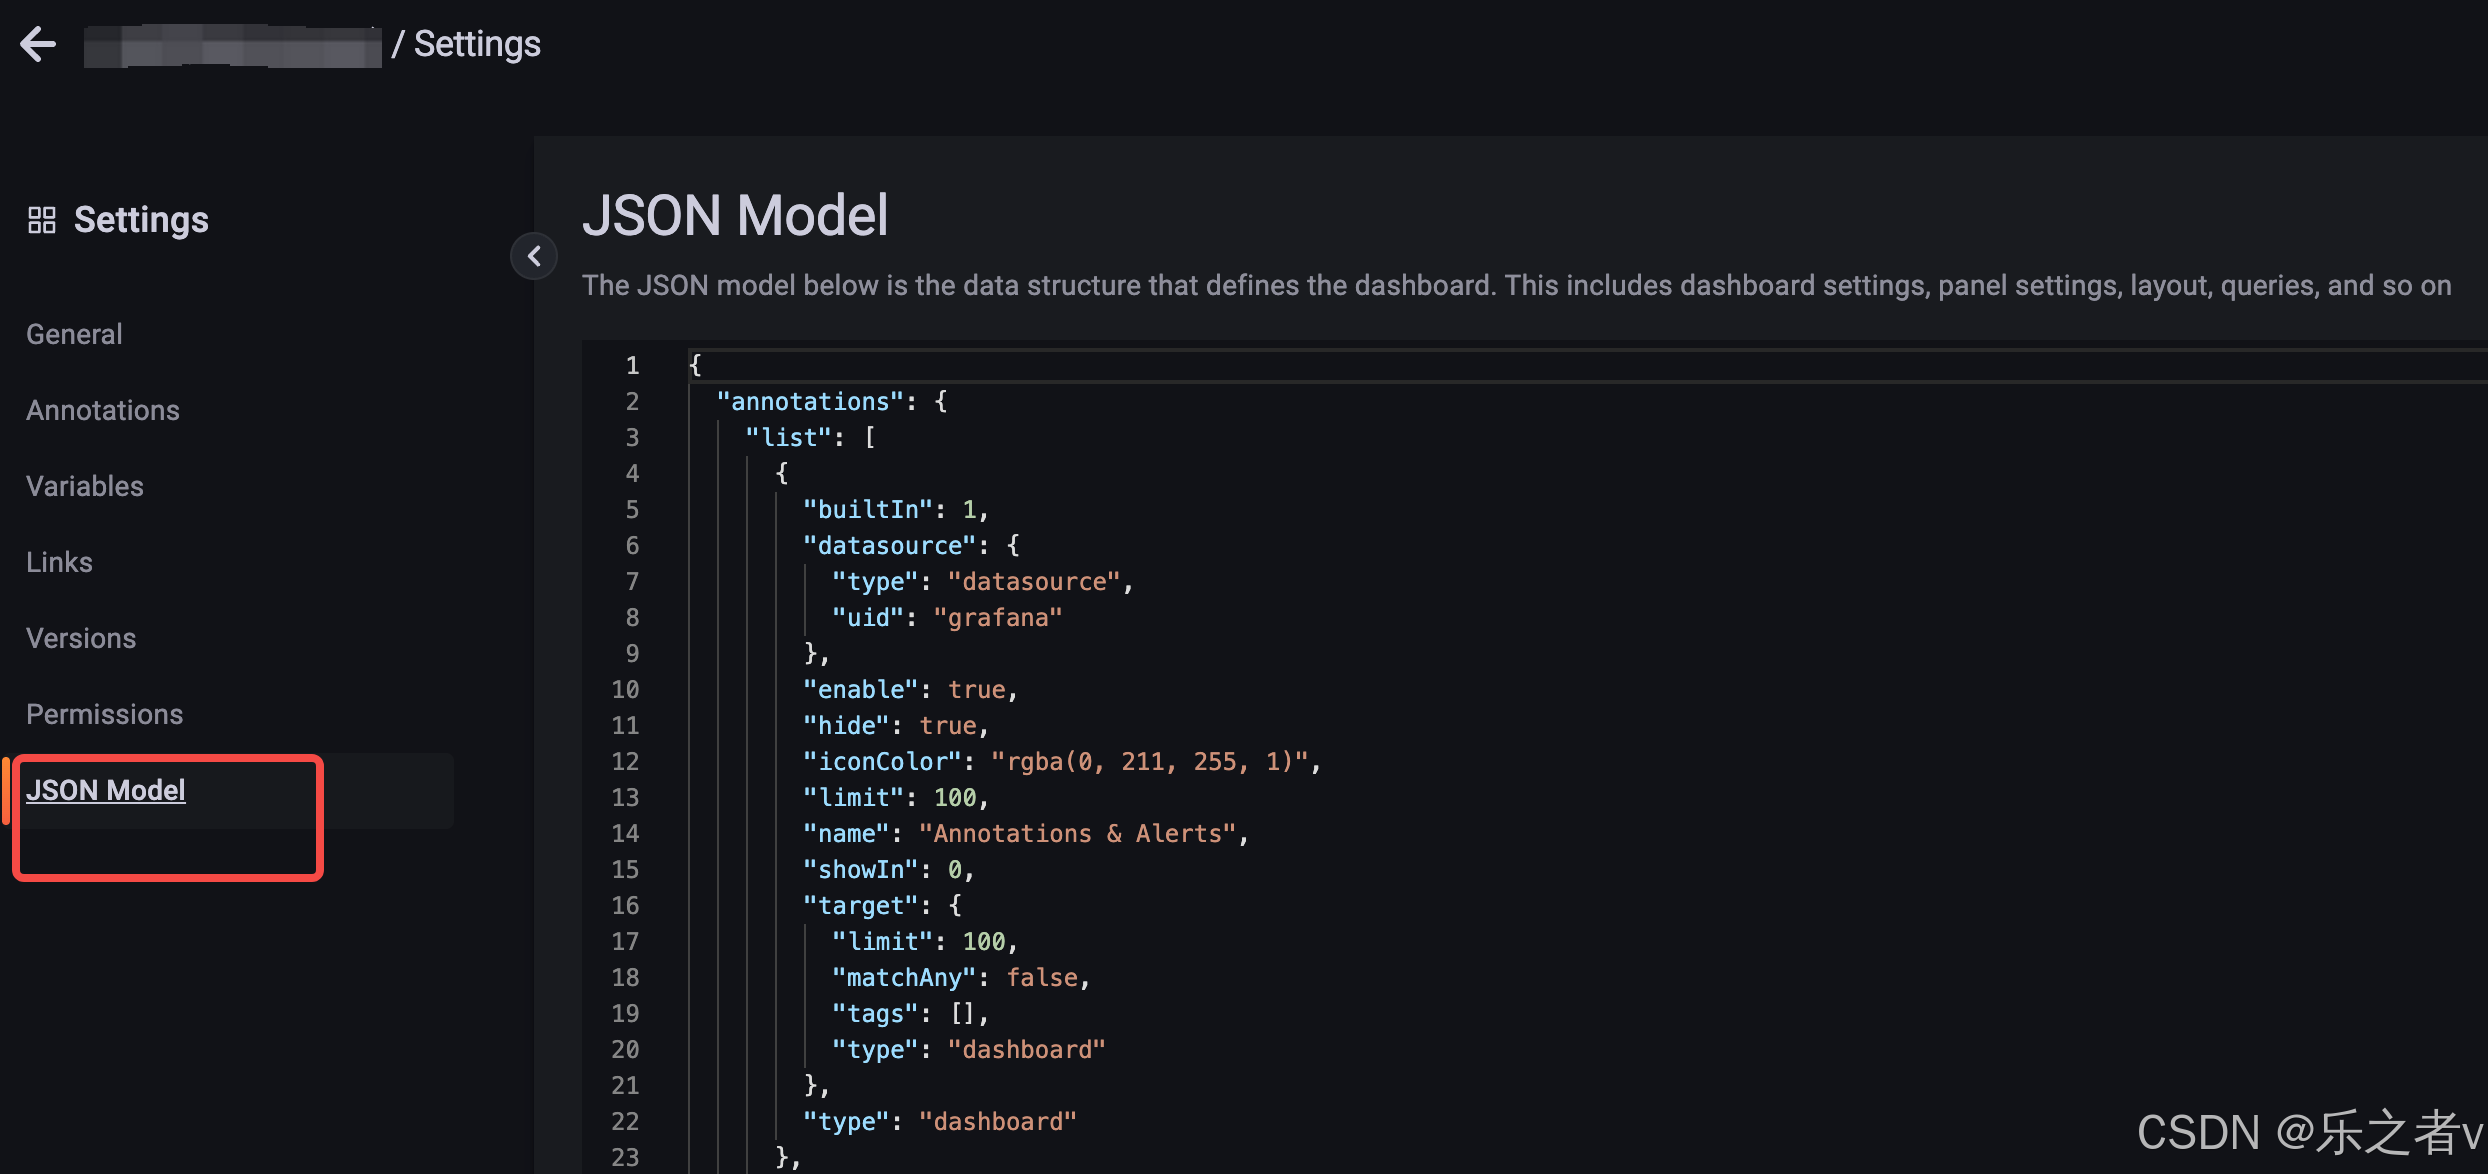
仪表板配置的 Json Model
可以使用 仪表板配置的 Json Model , 进行仪表板配置的 导入,直接生成对应的仪表板。
{
"annotations": {
"list": [
{
"builtIn": 1,
"datasource": {
"type": "grafana",
"uid": "-- Grafana --"
},
"enable": true,
"hide": true,
"iconColor": "rgba(0, 211, 255, 1)",
"name": "Annotations & Alerts",
"target": {
"limit": 100,
"matchAny": false,
"tags": [],
"type": "dashboard"
},
"type": "dashboard"
}
]
},
"editable": true,
"fiscalYearStartMonth": 0,
"graphTooltip": 0,
"id": 10027,
"links": [],
"liveNow": false,
"panels": [
{
"datasource": {
"type": "prometheus",
"uid": "${datasource}"
},
"fieldConfig": {
"defaults": {
"color": {
"mode": "continuous-BlPu"
},
"mappings": [],
"thresholds": {
"mode": "absolute",
"steps": [
{
"color": "green",
"value": null
},
{
"color": "red",
"value": 80
}
]
},
"unit": "none"
},
"overrides": []
},
"gridPos": {
"h": 5,
"w": 10,
"x": 0,
"y": 0
},
"id": 11,
"options": {
"colorMode": "background",
"graphMode": "none",
"justifyMode": "auto",
"orientation": "horizontal",
"reduceOptions": {
"calcs": [
"lastNotNull"
],
"fields": "",
"values": false
},
"textMode": "value_and_name"
},
"pluginVersion": "9.3.2",
"targets": [
{
"datasource": {
"type": "prometheus",
"uid": "${datasource}"
},
"editorMode": "code",
"expr": "sum(http_server_requests_seconds_count)",
"legendFormat": "总请求次数",
"range": true,
"refId": "A"
}
],
"type": "stat"
},
{
"datasource": {
"type": "prometheus",
"uid": "${datasource}"
},
"fieldConfig": {
"defaults": {
"color": {
"mode": "thresholds"
},
"custom": {
"align": "auto",
"displayMode": "auto",
"filterable": false,
"inspect": false,
"minWidth": 50
},
"mappings": [],
"thresholds": {
"mode": "absolute",
"steps": [
{
"color": "green",
"value": null
},
{
"color": "#EAB839",
"value": 10
},
{
"color": "red",
"value": 80
}
]
}
},
"overrides": [
{
"matcher": {
"id": "byName",
"options": "Value"
},
"properties": [
{
"id": "custom.displayMode",
"value": "color-background"
},
{
"id": "displayName",
"value": "发生次数"
}
]
}
]
},
"gridPos": {
"h": 10,
"w": 14,
"x": 10,
"y": 0
},
"id": 9,
"options": {
"footer": {
"enablePagination": false,
"fields": [],
"reducer": [
"sum"
],
"show": true
},
"showHeader": true,
"sortBy": [
{
"desc": true,
"displayName": "发生次数"
}
]
},
"pluginVersion": "9.3.2",
"targets": [
{
"datasource": {
"type": "prometheus",
"uid": "${datasource}"
},
"editorMode": "code",
"exemplar": false,
"expr": "sum(http_server_requests_seconds_count{outcome!=\"SUCCESS\"}) by (app, application, uri, status)",
"format": "table",
"instant": true,
"legendFormat": "{{app}}{{application}} - {{uri}} - {{status}}",
"range": false,
"refId": "A"
}
],
"title": "异常请求次数",
"transformations": [
{
"id": "filterFieldsByName",
"options": {
"include": {
"names": [
"app",
"status",
"uri",
"application",
"Value"
]
}
}
}
],
"type": "table"
},
{
"datasource": {
"type": "prometheus",
"uid": "${datasource}"
},
"fieldConfig": {
"defaults": {
"mappings": [],
"thresholds": {
"mode": "absolute",
"steps": [
{
"color": "green",
"value": null
},
{
"color": "red",
"value": 80
}
]
},
"unit": "ms"
},
"overrides": []
},
"gridPos": {
"h": 5,
"w": 5,
"x": 0,
"y": 5
},
"id": 12,
"options": {
"colorMode": "background",
"graphMode": "area",
"justifyMode": "auto",
"orientation": "horizontal",
"reduceOptions": {
"calcs": [
"lastNotNull"
],
"fields": "",
"values": false
},
"textMode": "value_and_name"
},
"pluginVersion": "9.3.2",
"targets": [
{
"datasource": {
"type": "prometheus",
"uid": "${datasource}"
},
"editorMode": "code",
"expr": "sum(http_server_requests_seconds_sum{app!='xxl-job-admin', uri!~\"/getHealth|/metrics\"}) / sum(http_server_requests_seconds_count{app!='xxl-job-admin', uri!~\"/getHealth|/metrics\"})",
"legendFormat": "总平均响应时间",
"range": true,
"refId": "A"
}
],
"type": "stat"
},
{
"datasource": {
"type": "prometheus",
"uid": "${datasource}"
},
"fieldConfig": {
"defaults": {
"mappings": [],
"thresholds": {
"mode": "absolute",
"steps": [
{
"color": "green",
"value": null
},
{
"color": "red",
"value": 80
}
]
},
"unit": "reqps"
},
"overrides": []
},
"gridPos": {
"h": 5,
"w": 5,
"x": 5,
"y": 5
},
"id": 13,
"options": {
"colorMode": "background",
"graphMode": "area",
"justifyMode": "auto",
"orientation": "horizontal",
"reduceOptions": {
"calcs": [
"lastNotNull"
],
"fields": "",
"values": false
},
"textMode": "value_and_name"
},
"pluginVersion": "9.3.2",
"targets": [
{
"datasource": {
"type": "prometheus",
"uid": "${datasource}"
},
"editorMode": "code",
"expr": "sum(rate(http_server_requests_seconds_count))",
"legendFormat": "当前并发数",
"range": true,
"refId": "A"
}
],
"type": "stat"
},
{
"datasource": {
"type": "prometheus",
"uid": "${datasource}"
},
"fieldConfig": {
"defaults": {
"color": {
"mode": "thresholds"
},
"custom": {
"align": "auto",
"displayMode": "auto",
"inspect": false
},
"mappings": [],
"noValue": "0",
"thresholds": {
"mode": "absolute",
"steps": [
{
"color": "green",
"value": null
},
{
"color": "red",
"value": 80
}
]
},
"unit": "none"
},
"overrides": [
{
"matcher": {
"id": "byName",
"options": "method_name"
},
"properties": [
{
"id": "custom.width",
"value": 640
}
]
},
{
"matcher": {
"id": "byName",
"options": "最大值"
},
"properties": [
{
"id": "unit",
"value": "ms"
},
{
"id": "thresholds",
"value": {
"mode": "absolute",
"steps": [
{
"color": "green",
"value": null
},
{
"color": "#EAB839",
"value": 50
},
{
"color": "red",
"value": 80
}
]
}
},
{
"id": "custom.displayMode",
"value": "color-background"
}
]
}
]
},
"gridPos": {
"h": 13,
"w": 24,
"x": 0,
"y": 10
},
"id": 5,
"options": {
"footer": {
"enablePagination": false,
"fields": "",
"reducer": [
"sum"
],
"show": false
},
"showHeader": true,
"sortBy": [
{
"desc": true,
"displayName": "最大值"
}
]
},
"pluginVersion": "9.3.2",
"targets": [
{
"datasource": {
"type": "prometheus",
"uid": "${datasource}"
},
"editorMode": "code",
"exemplar": false,
"expr": "dubbo_method_tp90",
"format": "time_series",
"instant": false,
"legendFormat": "__auto",
"range": true,
"refId": "A"
}
],
"title": "Panel Title",
"transformations": [
{
"disabled": true,
"id": "labelsToFields",
"options": {
"keepLabels": [
"host",
"namespace",
"pod"
],
"mode": "rows"
}
},
{
"id": "reduce",
"options": {
"includeTimeField": false,
"labelsToFields": true,
"mode": "seriesToRows",
"reducers": [
"last"
]
}
},
{
"id": "organize",
"options": {
"excludeByName": {
"Field": true,
"__name__": true,
"env": true,
"instance": true,
"job": true,
"namespace": false,
"node": true,
"pod_template_hash": true
},
"indexByName": {
"Field": 0,
"Last": 16,
"__name__": 1,
"app": 4,
"application": 15,
"buildVersion": 5,
"env": 6,
"group": 8,
"host": 9,
"instance": 10,
"job": 11,
"method_name": 12,
"namespace": 7,
"node": 2,
"pod": 3,
"pod_template_hash": 13,
"region": 14
},
"renameByName": {
"Last": "最大值",
"application": "",
"job": "",
"method_name": "方法名",
"namespace": ""
}
}
}
],
"type": "table"
},
{
"datasource": {
"type": "prometheus",
"uid": "${datasource}"
},
"fieldConfig": {
"defaults": {
"color": {
"mode": "palette-classic"
},
"custom": {
"axisCenteredZero": false,
"axisColorMode": "text",
"axisLabel": "",
"axisPlacement": "auto",
"barAlignment": 0,
"drawStyle": "line",
"fillOpacity": 0,
"gradientMode": "none",
"hideFrom": {
"legend": false,
"tooltip": false,
"viz": false
},
"lineInterpolation": "linear",
"lineWidth": 1,
"pointSize": 5,
"scaleDistribution": {
"type": "linear"
},
"showPoints": "auto",
"spanNulls": false,
"stacking": {
"group": "A",
"mode": "none"
},
"thresholdsStyle": {
"mode": "off"
}
},
"mappings": [],
"thresholds": {
"mode": "absolute",
"steps": [
{
"color": "green"
},
{
"color": "red",
"value": 80
}
]
},
"unit": "reqps"
},
"overrides": []
},
"gridPos": {
"h": 12,
"w": 24,
"x": 0,
"y": 23
},
"id": 2,
"options": {
"legend": {
"calcs": [
"max"
],
"displayMode": "table",
"placement": "right",
"showLegend": true,
"sortBy": "Max",
"sortDesc": true
},
"tooltip": {
"mode": "single",
"sort": "none"
}
},
"targets": [
{
"datasource": {
"type": "prometheus",
"uid": "${datasource}"
},
"editorMode": "code",
"expr": "rate(http_server_requests_seconds_count{outcome!=\"SUCCESS\"})",
"legendFormat": "{{application}}{{app}} - {{uri}}",
"range": true,
"refId": "A"
}
],
"title": "接口平均响应时间",
"type": "timeseries"
},
{
"datasource": {
"type": "prometheus",
"uid": "${datasource}"
},
"fieldConfig": {
"defaults": {
"color": {
"mode": "palette-classic"
},
"custom": {
"axisCenteredZero": false,
"axisColorMode": "text",
"axisLabel": "",
"axisPlacement": "auto",
"barAlignment": 0,
"drawStyle": "line",
"fillOpacity": 0,
"gradientMode": "none",
"hideFrom": {
"legend": false,
"tooltip": false,
"viz": false
},
"lineInterpolation": "linear",
"lineWidth": 1,
"pointSize": 5,
"scaleDistribution": {
"type": "linear"
},
"showPoints": "auto",
"spanNulls": false,
"stacking": {
"group": "A",
"mode": "none"
},
"thresholdsStyle": {
"mode": "off"
}
},
"mappings": [],
"thresholds": {
"mode": "absolute",
"steps": [
{
"color": "green"
},
{
"color": "red",
"value": 80
}
]
},
"unit": "ms"
},
"overrides": []
},
"gridPos": {
"h": 12,
"w": 24,
"x": 0,
"y": 35
},
"id": 7,
"options": {
"legend": {
"calcs": [
"max"
],
"displayMode": "table",
"placement": "right",
"showLegend": true,
"sortBy": "Max",
"sortDesc": true
},
"tooltip": {
"mode": "single",
"sort": "none"
}
},
"targets": [
{
"datasource": {
"type": "prometheus",
"uid": "${datasource}"
},
"editorMode": "code",
"expr": "sum by (app, application, uri) (http_server_requests_seconds_sum{app!='xxl-job-admin', uri!~\"/getHealth|/metrics\"}) / sum by (app, application, uri) (http_server_requests_seconds_count{app!='xxl-job-admin', uri!~\"/getHealth|/metrics\"})",
"legendFormat": "{{application}}{{app}} - {{uri}}",
"range": true,
"refId": "A"
}
],
"title": "接口平均响应时间",
"type": "timeseries"
},
{
"datasource": {
"type": "prometheus",
"uid": "${datasource}"
},
"fieldConfig": {
"defaults": {
"color": {
"mode": "palette-classic"
},
"custom": {
"axisCenteredZero": false,
"axisColorMode": "text",
"axisLabel": "",
"axisPlacement": "auto",
"barAlignment": 0,
"drawStyle": "line",
"fillOpacity": 0,
"gradientMode": "none",
"hideFrom": {
"legend": false,
"tooltip": false,
"viz": false
},
"lineInterpolation": "linear",
"lineWidth": 1,
"pointSize": 5,
"scaleDistribution": {
"type": "linear"
},
"showPoints": "auto",
"spanNulls": false,
"stacking": {
"group": "A",
"mode": "none"
},
"thresholdsStyle": {
"mode": "off"
}
},
"mappings": [],
"thresholds": {
"mode": "absolute",
"steps": [
{
"color": "green"
},
{
"color": "red",
"value": 80
}
]
},
"unit": "ms"
},
"overrides": []
},
"gridPos": {
"h": 12,
"w": 24,
"x": 0,
"y": 47
},
"id": 3,
"options": {
"legend": {
"calcs": [
"max"
],
"displayMode": "table",
"placement": "right",
"showLegend": true,
"sortBy": "Max",
"sortDesc": true
},
"tooltip": {
"mode": "single",
"sort": "none"
}
},
"targets": [
{
"datasource": {
"type": "prometheus",
"uid": "${datasource}"
},
"editorMode": "code",
"expr": "max by (app, application, uri) (http_server_requests_seconds_max{app!='xxl-job-admin', uri!~\"/getHealth|/metrics\"})",
"legendFormat": "{{application}}{{app}} - {{uri}}",
"range": true,
"refId": "A"
}
],
"title": "接口最大响应时间",
"type": "timeseries"
},
{
"datasource": {
"type": "prometheus",
"uid": "${datasource}"
},
"fieldConfig": {
"defaults": {
"color": {
"mode": "palette-classic"
},
"custom": {
"axisCenteredZero": false,
"axisColorMode": "text",
"axisLabel": "",
"axisPlacement": "auto",
"barAlignment": 0,
"drawStyle": "line",
"fillOpacity": 0,
"gradientMode": "none",
"hideFrom": {
"legend": false,
"tooltip": false,
"viz": false
},
"lineInterpolation": "linear",
"lineWidth": 1,
"pointSize": 5,
"scaleDistribution": {
"type": "linear"
},
"showPoints": "auto",
"spanNulls": false,
"stacking": {
"group": "A",
"mode": "none"
},
"thresholdsStyle": {
"mode": "off"
}
},
"mappings": [],
"thresholds": {
"mode": "absolute",
"steps": [
{
"color": "green"
},
{
"color": "red",
"value": 80
}
]
},
"unit": "none"
},
"overrides": []
},
"gridPos": {
"h": 12,
"w": 24,
"x": 0,
"y": 59
},
"id": 6,
"options": {
"legend": {
"calcs": [
"mean",
"max",
"last"
],
"displayMode": "table",
"placement": "right",
"showLegend": true
},
"tooltip": {
"mode": "single",
"sort": "none"
}
},
"targets": [
{
"datasource": {
"type": "prometheus",
"uid": "${datasource}"
},
"editorMode": "code",
"expr": "sum by (app, application, uri) (rate(http_server_requests_seconds_count{app!='xxl-job-admin', uri!~\"/getHealth|/metrics\"}[1m]))",
"legendFormat": "{{application}}{{app}} - {{uri}}",
"range": true,
"refId": "A"
}
],
"title": "接口每秒并发数",
"type": "timeseries"
}
],
"schemaVersion": 37,
"style": "dark",
"tags": [],
"templating": {
"list": [
{
"current": {
"selected": true,
"text": "Victoriametrics-cntest",
"value": "Victoriametrics-cntest"
},
"hide": 0,
"includeAll": false,
"label": "DataSource",
"multi": false,
"name": "datasource",
"options": [],
"query": "prometheus",
"queryValue": "",
"refresh": 1,
"regex": "",
"skipUrlSync": false,
"type": "datasource"
}
]
},
"time": {
"from": "now-24h",
"to": "now"
},
"timepicker": {},
"timezone": "",
"title": "业务指标",
"uid": "A79GypqHz",
"version": 5,
"weekStart": ""
}