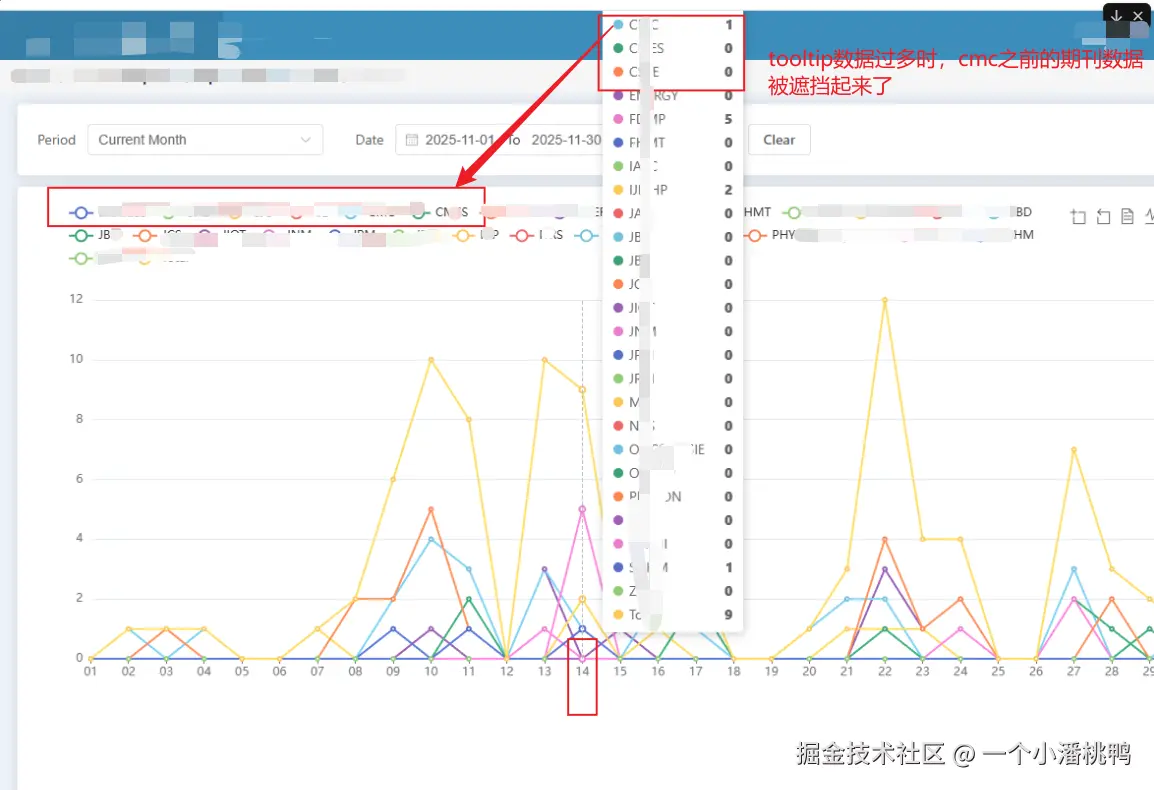
问题:echarts tooltip内容过多时,会导致部分内容遮挡,如下图
优化:
- 数据不多时则保持原来方式展示
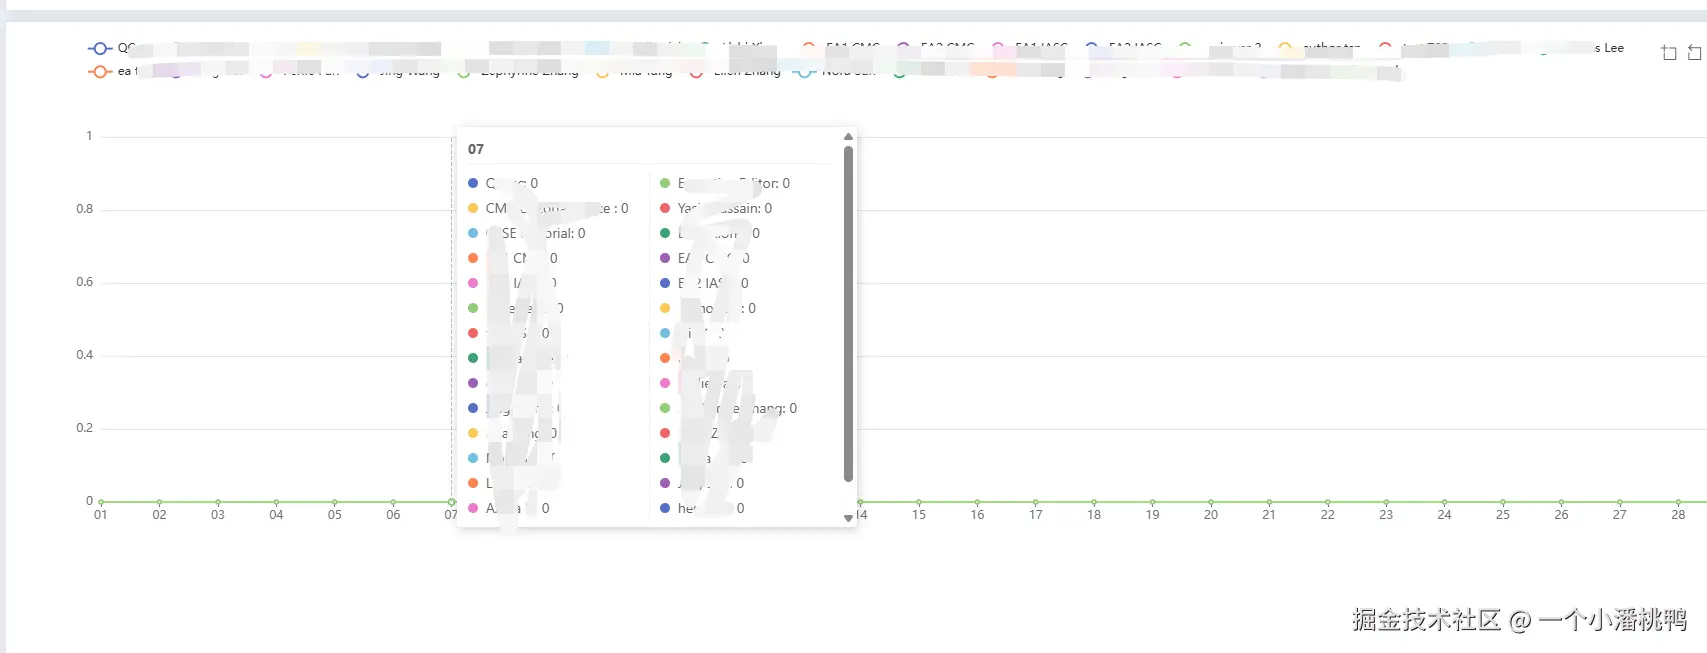
- 数据过多时使用滚动条+一行展示两个的方式来展示
优化效果vs:
- 优化前
js
const initEcharts = (items, yItems, legends) => {
  var chartDom = document.getElementById("main");

  if (!chartDom) {
    console.error("chart dom not found");
    return;
  }


  myChart = echarts.init(chartDom);
  var option;

  // 显示所有图例
  option = {
    tooltip: {
      trigger: "axis",
    },
    legend: {
      data: legends,
      selectedMode: true, // 启用图例的多选模式
      // left: "left",
      // width: "99%", // 设置图例总宽度
      right: "240px", // 设置右边距
    },
    grid: {
      left: "3%",
      right: "4%",
      bottom: "3%",
      containLabel: true,
      top: "20%", // 设置图表与上方图例的距离
    },
    toolbox: {
      show: true,
      feature: {
        dataZoom: {
          yAxisIndex: "none",
        },
        dataView: { readOnly: false },
        magicType: { type: ["line", "bar"] },
        restore: {},
        saveAsImage: {},
        myTool1: {
          show: true,
          title: "Hide/Show All Legends",
          icon: "path://M20,20 H80 V80 H20 Z M30,30 H90 V90 H30 Z M40,60 L55,75 L80,50",
          onclick: function () {
            toggleLegendVisibility();
          },
        },
      },
    },
    xAxis: {
      type: "category",
      boundaryGap: false,
      data: items,
    },
    yAxis: {
      type: "value",
    },
    series: yItems,
  };

  myChart.clear();
  option && myChart.setOption(option);
};- 一行展示两个
js
const initEcharts = (items, yItems, legends) => {
  var chartDom = document.getElementById("main");

  if (!chartDom) {
    console.error("chart dom not found");
    return;
  }


  myChart = echarts.init(chartDom);
  var option;

  // 显示所有图例
  option = {
    tooltip: {
      trigger: "axis",
      appendToBody: true, // 将 tooltip 附加到 body,避免被容器边界截断
      confine: false, // appendToBody 为 true 时,confine 应设为 false
      enterable: true, // 允许鼠标进入 tooltip,方便滚动查看
      extraCssText: "max-height: 400px; overflow-y: auto; min-width: 400px;", // 设置最大高度并添加滚动条,设置最小宽度以容纳两列
      axisPointer: {
        type: "line",
      },
      // 自定义 formatter,一行显示两个期刊信息
      formatter: function (params: any) {
        if (!params || params.length === 0) return "";

        // 获取 x 轴的值(日期)
        const date = params[0].axisValue;
        let result = `<div style="font-weight: bold; margin-bottom: 8px; padding-bottom: 4px; border-bottom: 1px solid #eee;">${date}</div>`;

        // 将数据按两列显示
        const items: string[] = [];
        for (let i = 0; i < params.length; i += 2) {
          const param = params[i];
          const marker = param.marker || "";
          const name = param.seriesName || "";
          const value = param.value !== null && param.value !== undefined ? param.value : 0;

          // 每行显示两个期刊,使用 flex 布局
          const nextParam = params[i + 1];
          if (nextParam) {
            const nextMarker = nextParam.marker || "";
            const nextName = nextParam.seriesName || "";
            const nextValue = nextParam.value !== null && nextParam.value !== undefined ? nextParam.value : 0;
            items.push(
              `<div style="display: flex; margin-bottom: 4px; line-height: 1.5;">` +
              `<span style="flex: 1; min-width: 0; padding-right: 10px;">${marker} ${name}: ${value}</span>` +
              `<span style="flex: 1; min-width: 0; padding-left: 10px; border-left: 1px solid #eee;">${nextMarker} ${nextName}: ${nextValue}</span>` +
              `</div>`
            );
          } else {
            // 最后一个,单独显示
            items.push(
              `<div style="margin-bottom: 4px; line-height: 1.5;">${marker} ${name}: ${value}</div>`
            );
          }
        }

        result += items.join("");
        return result;
      },
      // 自定义位置,确保 tooltip 在可视区域内
      position: function (point: number[], _params: any, _dom: any, _rect: any, size: any) {
        // point: 鼠标位置
        // size: tooltip 的大小
        const [x, y] = point;
        const viewWidth = size.viewSize[0];
        const viewHeight = size.viewSize[1];
        const boxWidth = size.contentSize[0];
        const boxHeight = size.contentSize[1];

        // 默认位置在鼠标右侧
        let posX = x + 10;
        let posY = y;

        // 如果右侧空间不足,显示在左侧
        if (posX + boxWidth > viewWidth) {
          posX = x - boxWidth - 10;
        }

        // 如果下方空间不足,向上调整
        if (posY + boxHeight > viewHeight) {
          posY = viewHeight - boxHeight - 10;
        }

        // 确保不超出上边界
        if (posY < 10) {
          posY = 10;
        }

        return [posX, posY];
      },
    },
    legend: {
      data: legends,
      selectedMode: true, // 启用图例的多选模式
      // left: "left",
      // width: "99%", // 设置图例总宽度
      right: "240px", // 设置右边距
    },
    grid: {
      left: "3%",
      right: "4%",
      bottom: "3%",
      containLabel: true,
      top: "20%", // 设置图表与上方图例的距离
    },
    toolbox: {
      show: true,
      feature: {
        dataZoom: {
          yAxisIndex: "none",
        },
        dataView: { readOnly: false },
        magicType: { type: ["line", "bar"] },
        restore: {},
        saveAsImage: {},
        myTool1: {
          show: true,
          title: "Hide/Show All Legends",
          icon: "path://M20,20 H80 V80 H20 Z M30,30 H90 V90 H30 Z M40,60 L55,75 L80,50",
          onclick: function () {
            toggleLegendVisibility();
          },
        },
      },
    },
    xAxis: {
      type: "category",
      boundaryGap: false,
      data: items,
    },
    yAxis: {
      type: "value",
    },
    series: yItems,
  };

  myChart.clear();
  option && myChart.setOption(option);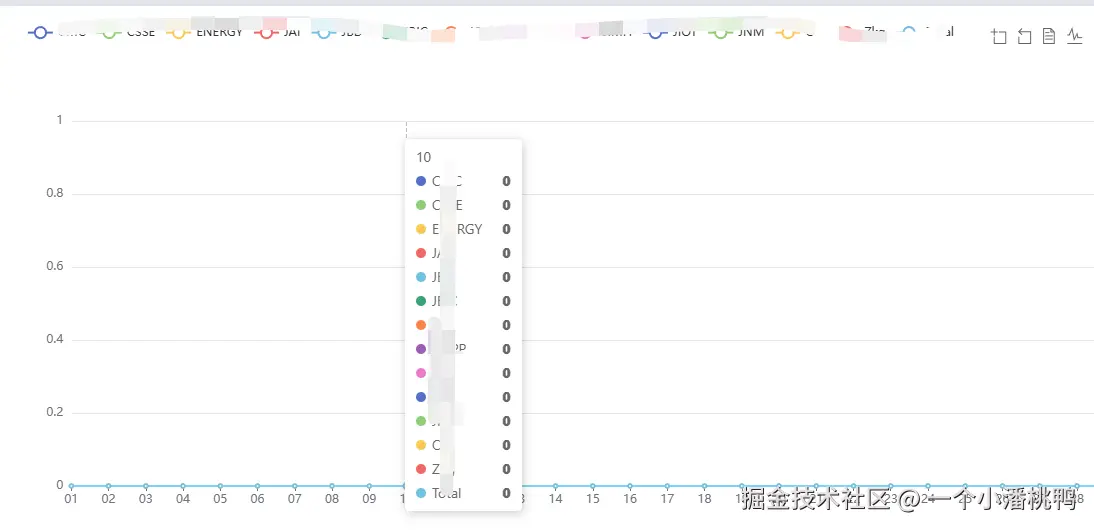
};- 当期刊超过20条时,使用自定义 formatter 和滚动条; 当期刊不超过20条时,不设置 formatter,使用 ECharts 默认的显示方式(没有最小宽度,没有滚动条)
js
const initEcharts = (items, yItems, legends) => {
  var chartDom = document.getElementById("main");

  if (!chartDom) {
    console.error("chart dom not found");
    return;
  }


  myChart = echarts.init(chartDom);
  var option;

  // 根据期刊数量决定 tooltip 配置
  const tooltipConfig: any = {
    trigger: "axis",
    appendToBody: true, // 将 tooltip 附加到 body,避免被容器边界截断
    confine: false, // appendToBody 为 true 时,confine 应设为 false
    enterable: true, // 允许鼠标进入 tooltip,方便滚动查看
    axisPointer: {
      type: "line",
    },
    // 自定义位置,确保 tooltip 在可视区域内
    position: function (point: number[], _params: any, _dom: any, _rect: any, size: any) {
      // point: 鼠标位置
      // size: tooltip 的大小
      const [x, y] = point;
      const viewWidth = size.viewSize[0];
      const viewHeight = size.viewSize[1];
      const boxWidth = size.contentSize[0];
      const boxHeight = size.contentSize[1];

      // 默认位置在鼠标右侧
      let posX = x + 10;
      let posY = y;

      // 如果右侧空间不足,显示在左侧
      if (posX + boxWidth > viewWidth) {
        posX = x - boxWidth - 10;
      }

      // 如果下方空间不足,向上调整
      if (posY + boxHeight > viewHeight) {
        posY = viewHeight - boxHeight - 10;
      }

      // 确保不超出上边界
      if (posY < 10) {
        posY = 10;
      }

      return [posX, posY];
    },
  };

  // 当期刊超过20条时,使用自定义 formatter 和滚动条
  if (legends && legends.length > 20) {
    tooltipConfig.extraCssText = "max-height: 400px; overflow-y: auto; min-width: 400px;"; // 设置最大高度并添加滚动条,设置最小宽度以容纳两列
    tooltipConfig.formatter = function (params: any) {
      if (!params || params.length === 0) return "";

      // 获取 x 轴的值(日期)
      const date = params[0].axisValue;
      let result = `<div style="font-weight: bold; margin-bottom: 8px; padding-bottom: 4px; border-bottom: 1px solid #eee;">${date}</div>`;

      // 两列显示
      const items: string[] = [];
      for (let i = 0; i < params.length; i += 2) {
        const param = params[i];
        const marker = param.marker || "";
        const name = param.seriesName || "";
        const value = param.value !== null && param.value !== undefined ? param.value : 0;

        // 每行显示两个期刊,使用 flex 布局
        const nextParam = params[i + 1];
        if (nextParam) {
          const nextMarker = nextParam.marker || "";
          const nextName = nextParam.seriesName || "";
          const nextValue = nextParam.value !== null && nextParam.value !== undefined ? nextParam.value : 0;
          items.push(
            `<div style="display: flex; margin-bottom: 4px; line-height: 1.5;">` +
            `<span style="flex: 1; min-width: 0; padding-right: 10px;">${marker} ${name}: ${value}</span>` +
            `<span style="flex: 1; min-width: 0; padding-left: 10px; border-left: 1px solid #eee;">${nextMarker} ${nextName}: ${nextValue}</span>` +
            `</div>`
          );
        } else {
          // 最后一个,单独显示
          items.push(
            `<div style="margin-bottom: 4px; line-height: 1.5;">${marker} ${name}: ${value}</div>`
          );
        }
      }

      result += items.join("");
      return result;
    };
  }
  // 当期刊不超过20条时,不设置 formatter,使用 ECharts 默认的显示方式(没有最小宽度,没有滚动条)

  // 显示所有图例
  option = {
    tooltip: tooltipConfig,
    legend: {
      data: legends,
      selectedMode: true, // 启用图例的多选模式
      // left: "left",
      // width: "99%", // 设置图例总宽度
      right: "240px", // 设置右边距
    },
    grid: {
      left: "3%",
      right: "4%",
      bottom: "3%",
      containLabel: true,
      top: "20%", // 设置图表与上方图例的距离
    },
    toolbox: {
      show: true,
      feature: {
        dataZoom: {
          yAxisIndex: "none",
        },
        dataView: { readOnly: false },
        magicType: { type: ["line", "bar"] },
        restore: {},
        saveAsImage: {},
        myTool1: {
          show: true,
          title: "Hide/Show All Legends",
          icon: "path://M20,20 H80 V80 H20 Z M30,30 H90 V90 H30 Z M40,60 L55,75 L80,50",
          onclick: function () {
            toggleLegendVisibility();
          },
        },
      },
    },
    xAxis: {
      type: "category",
      boundaryGap: false,
      data: items,
    },
    yAxis: {
      type: "value",
    },
    series: yItems,
  };

  myChart.clear();
  option && myChart.setOption(option);
};