developer.apple.com/videos/play...
概述
本Session主要解释了App内存由哪些部分组成,并介绍了可以使用Performace XCTests工具对内存问题进行排查、分析
Impact of Memory footprint
好的内存管理可以提升用户体验,可以表现在
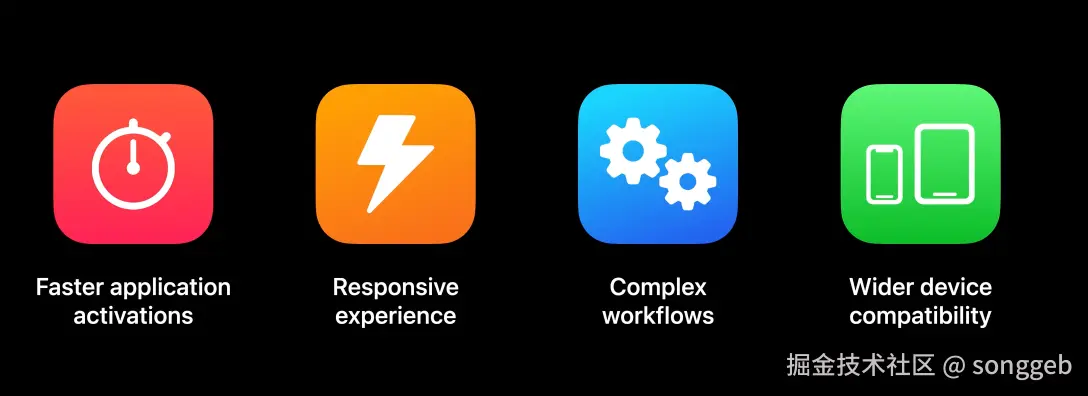
- Faster application activation,因为内存控制的好,所以app进入后台时不易被系统终止,重新激活回到前台时也更快
- Responsive experience,更高的响应速度
- Complex workflows,内存控制的好则意味着可以增加更多更消耗内存的功能
- Wider device compatibility,控制好内存则可以兼容到更老的机器
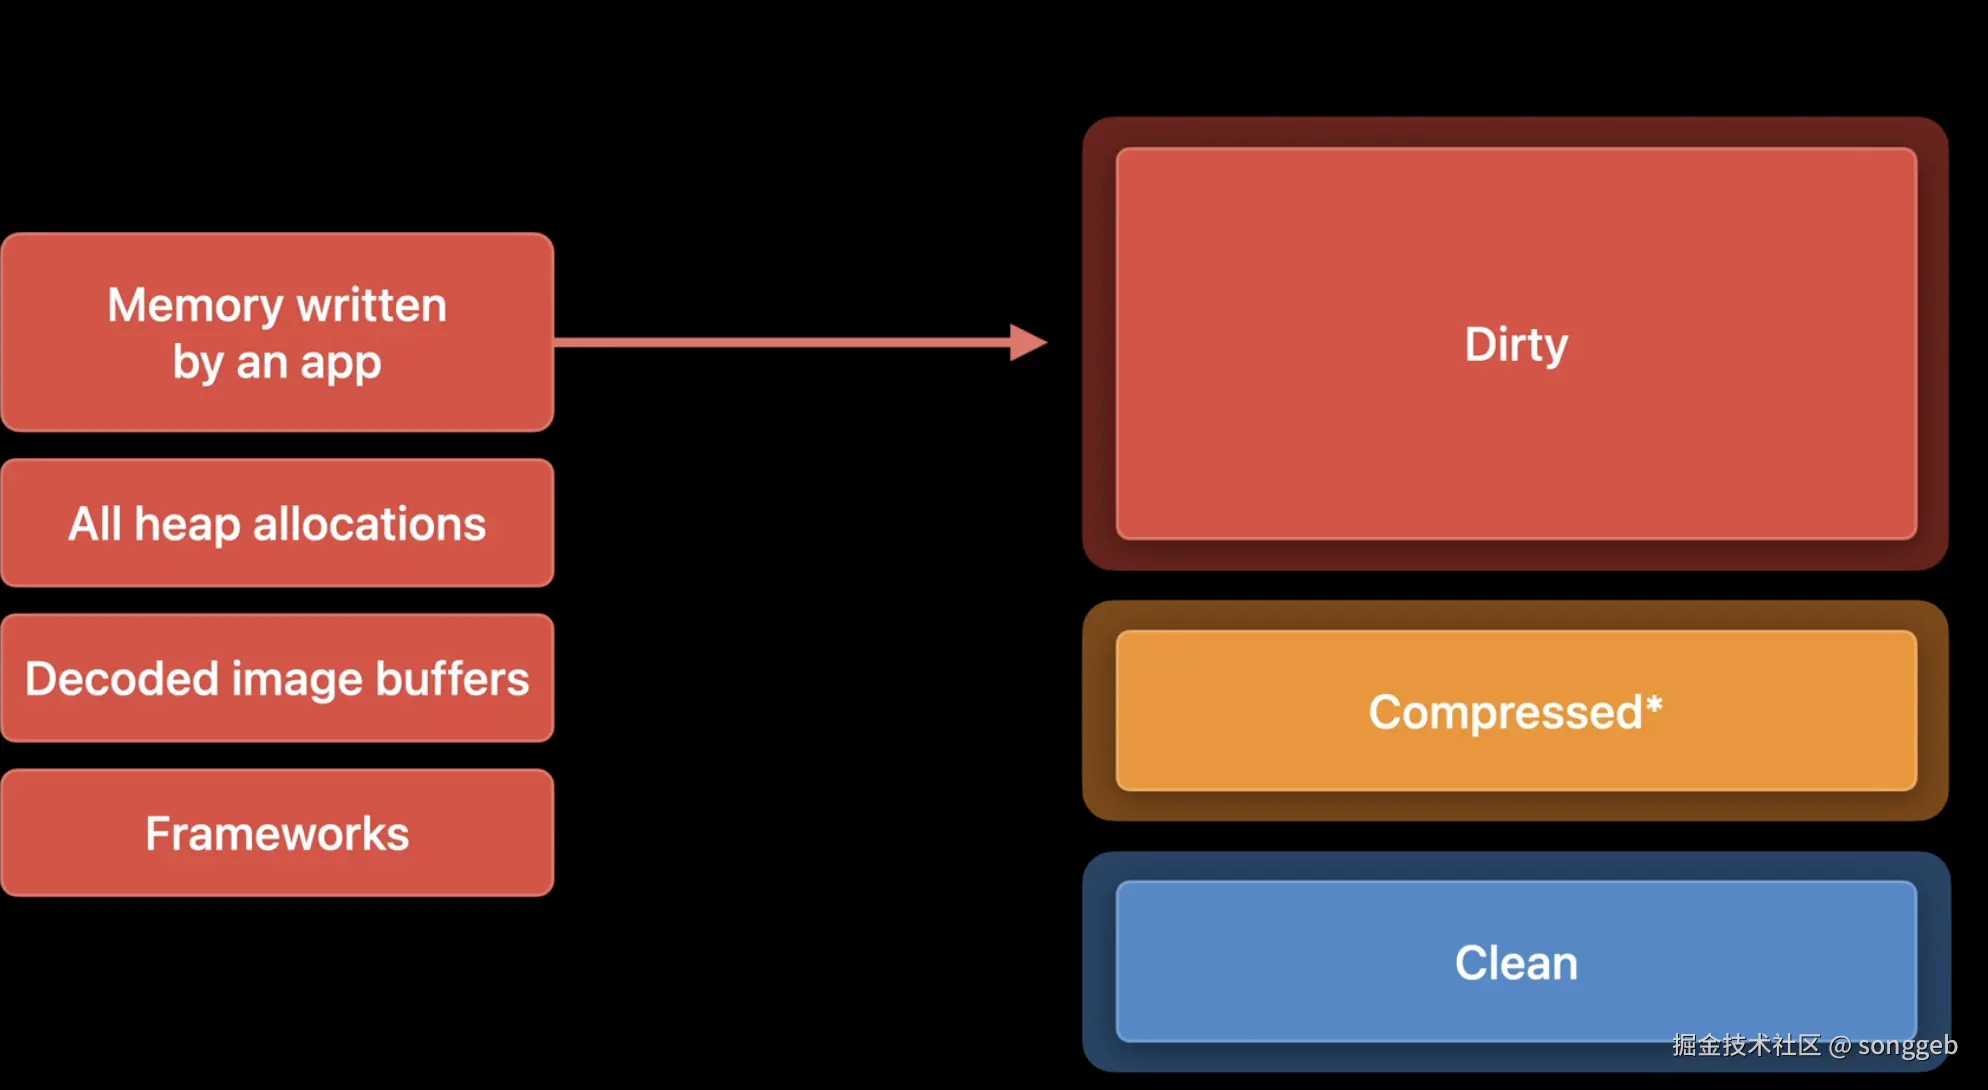
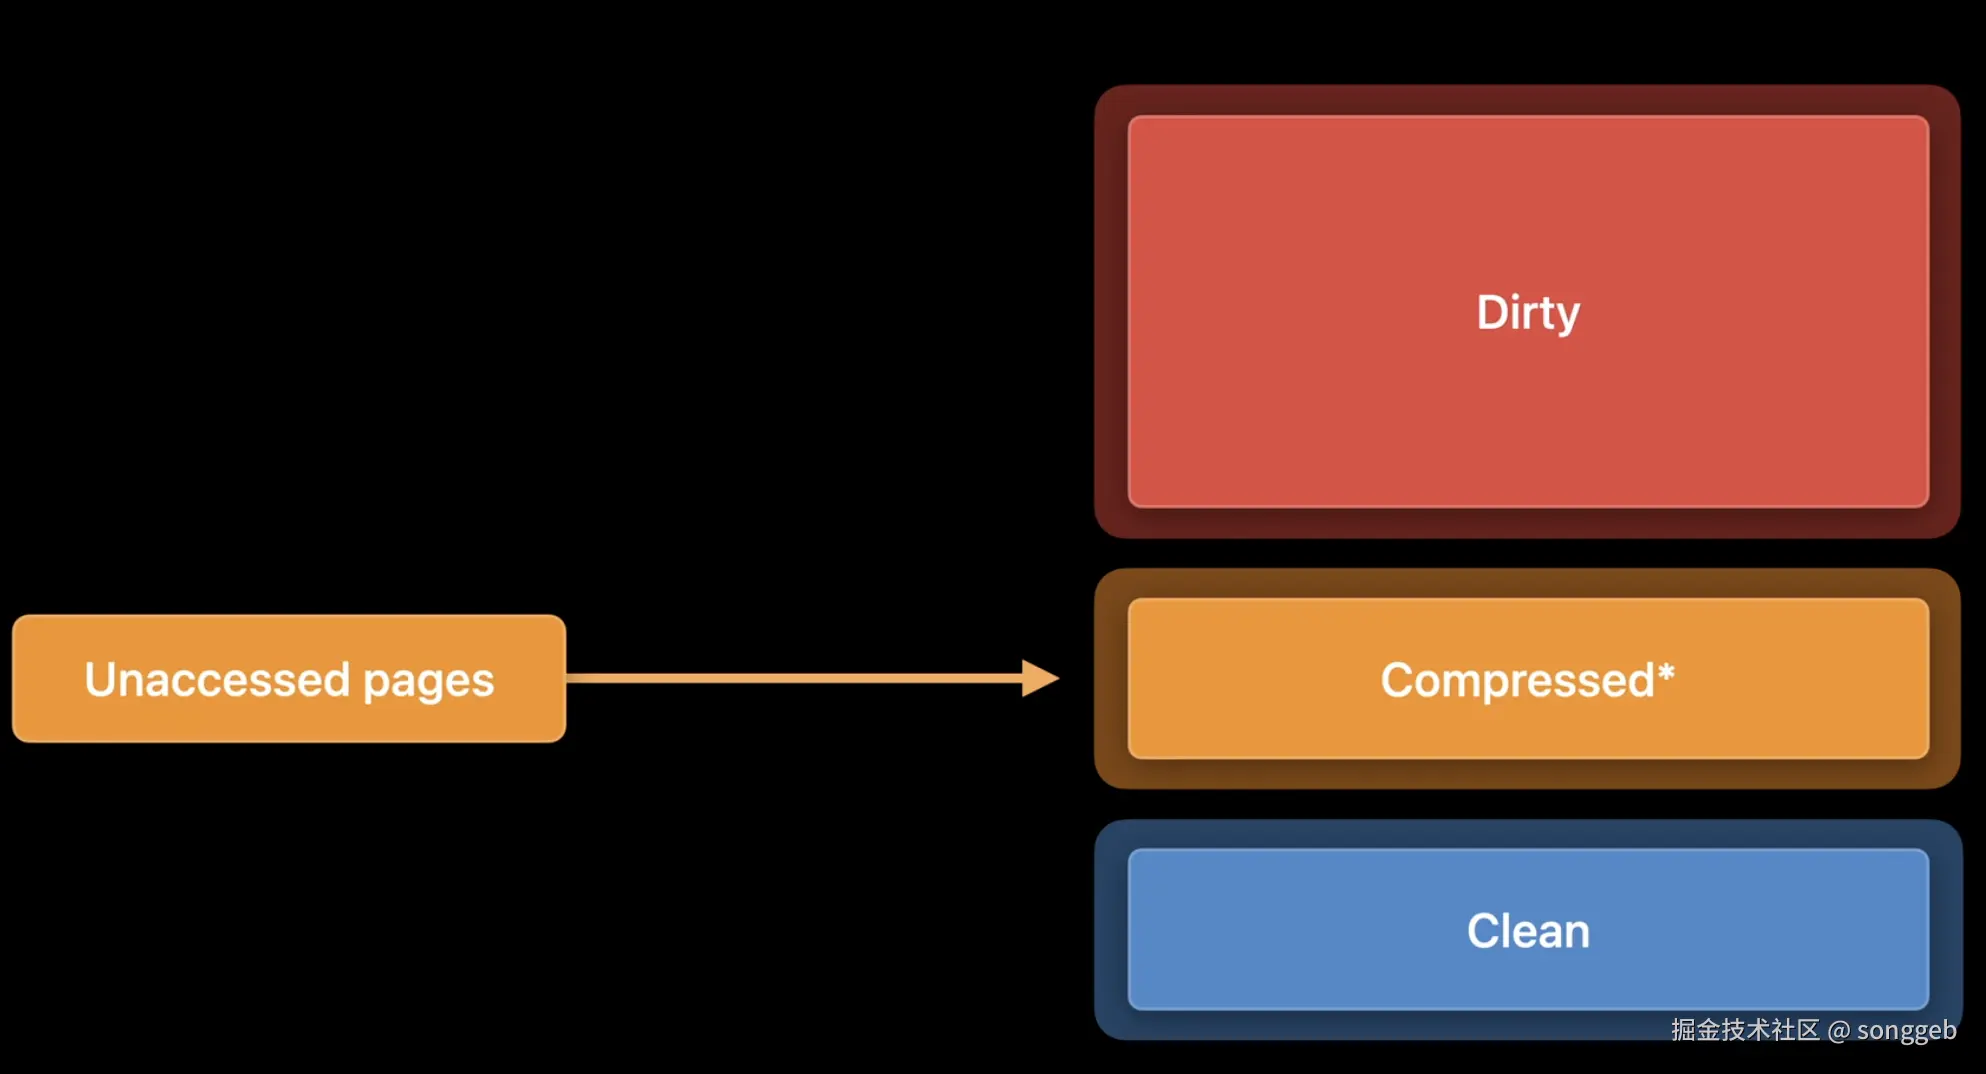
Memory footprint
本小节主要介绍Memory footprint都是有哪些内容组成
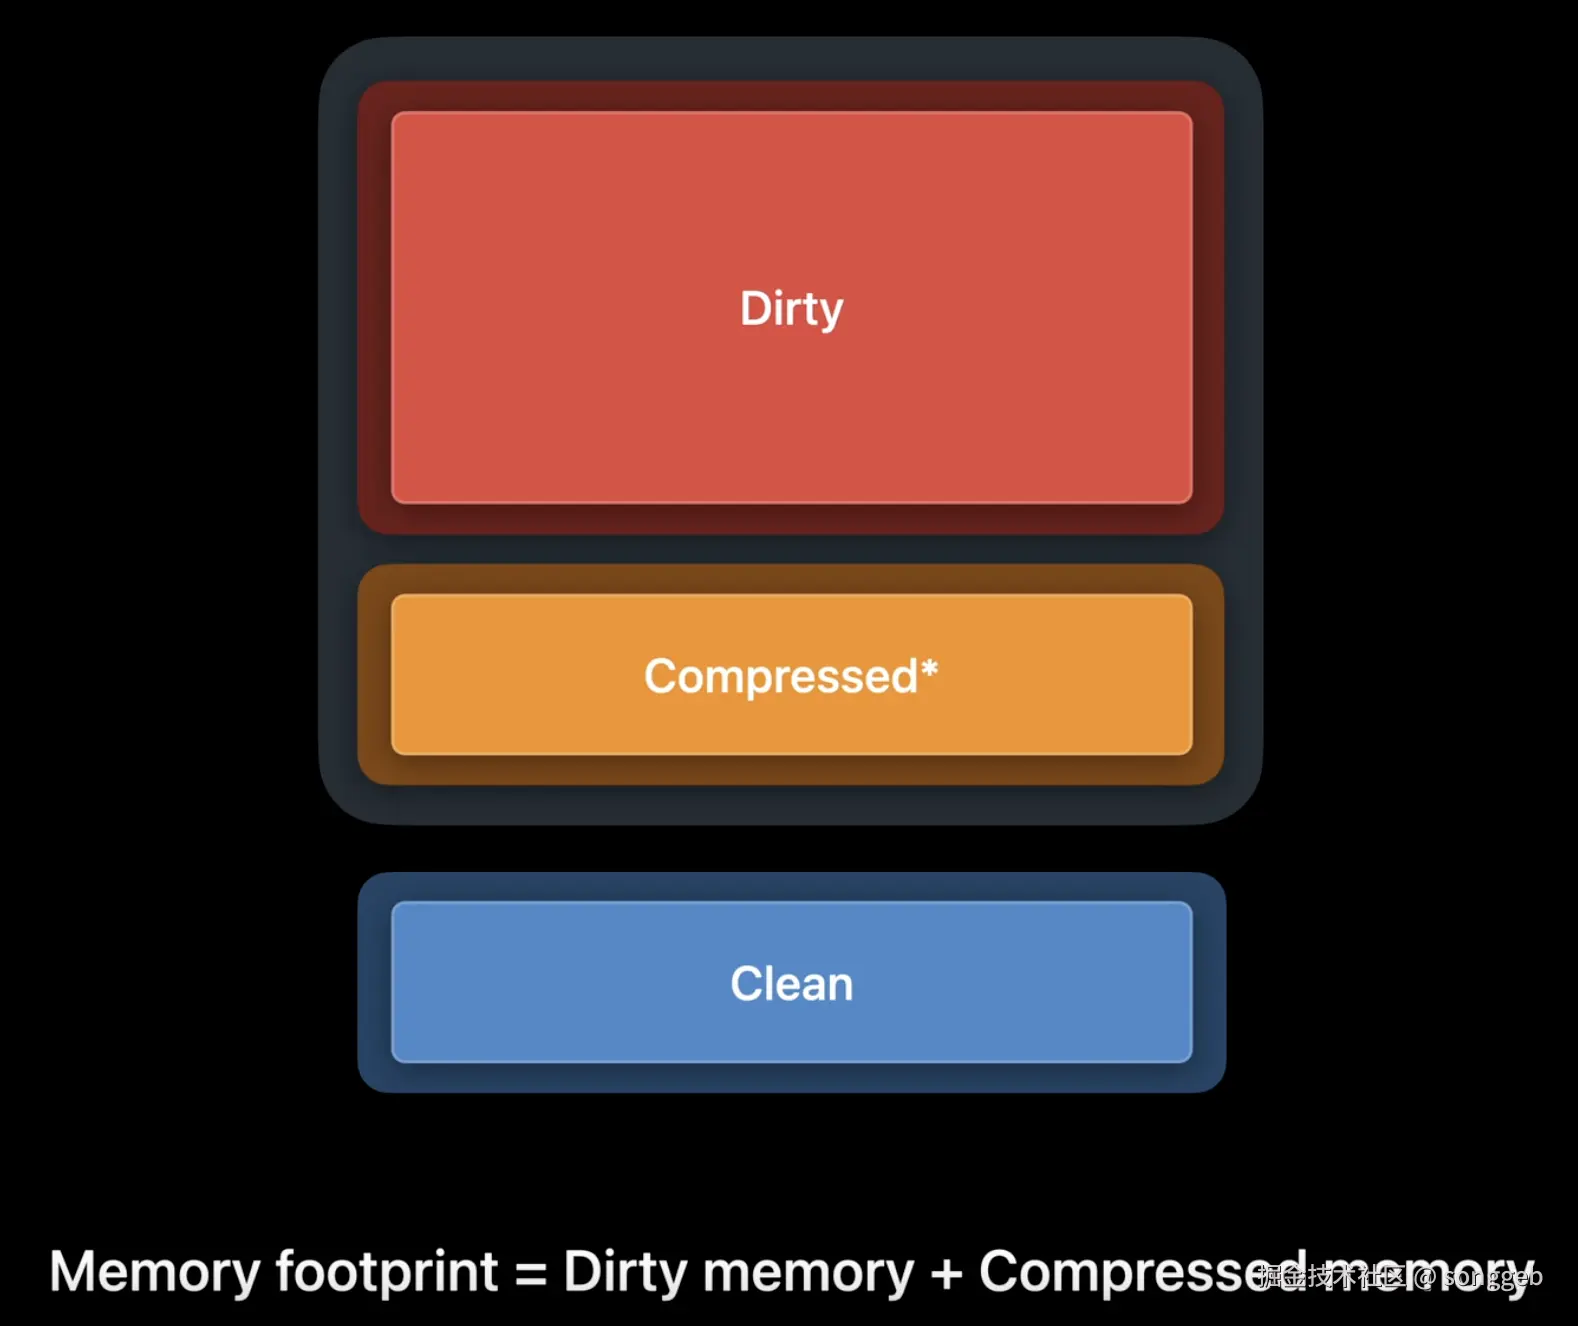
Dirty memory consists of memory written by your application.It also includes all heap allocationssuch as when you use malloc, decoded image buffers,and frameworks.
Compressed memory refers to any dirty pagesthat haven't recently been accessedthat the memory compressor has compressed.These pages will be decompressed on access.
Tools for profiling memory
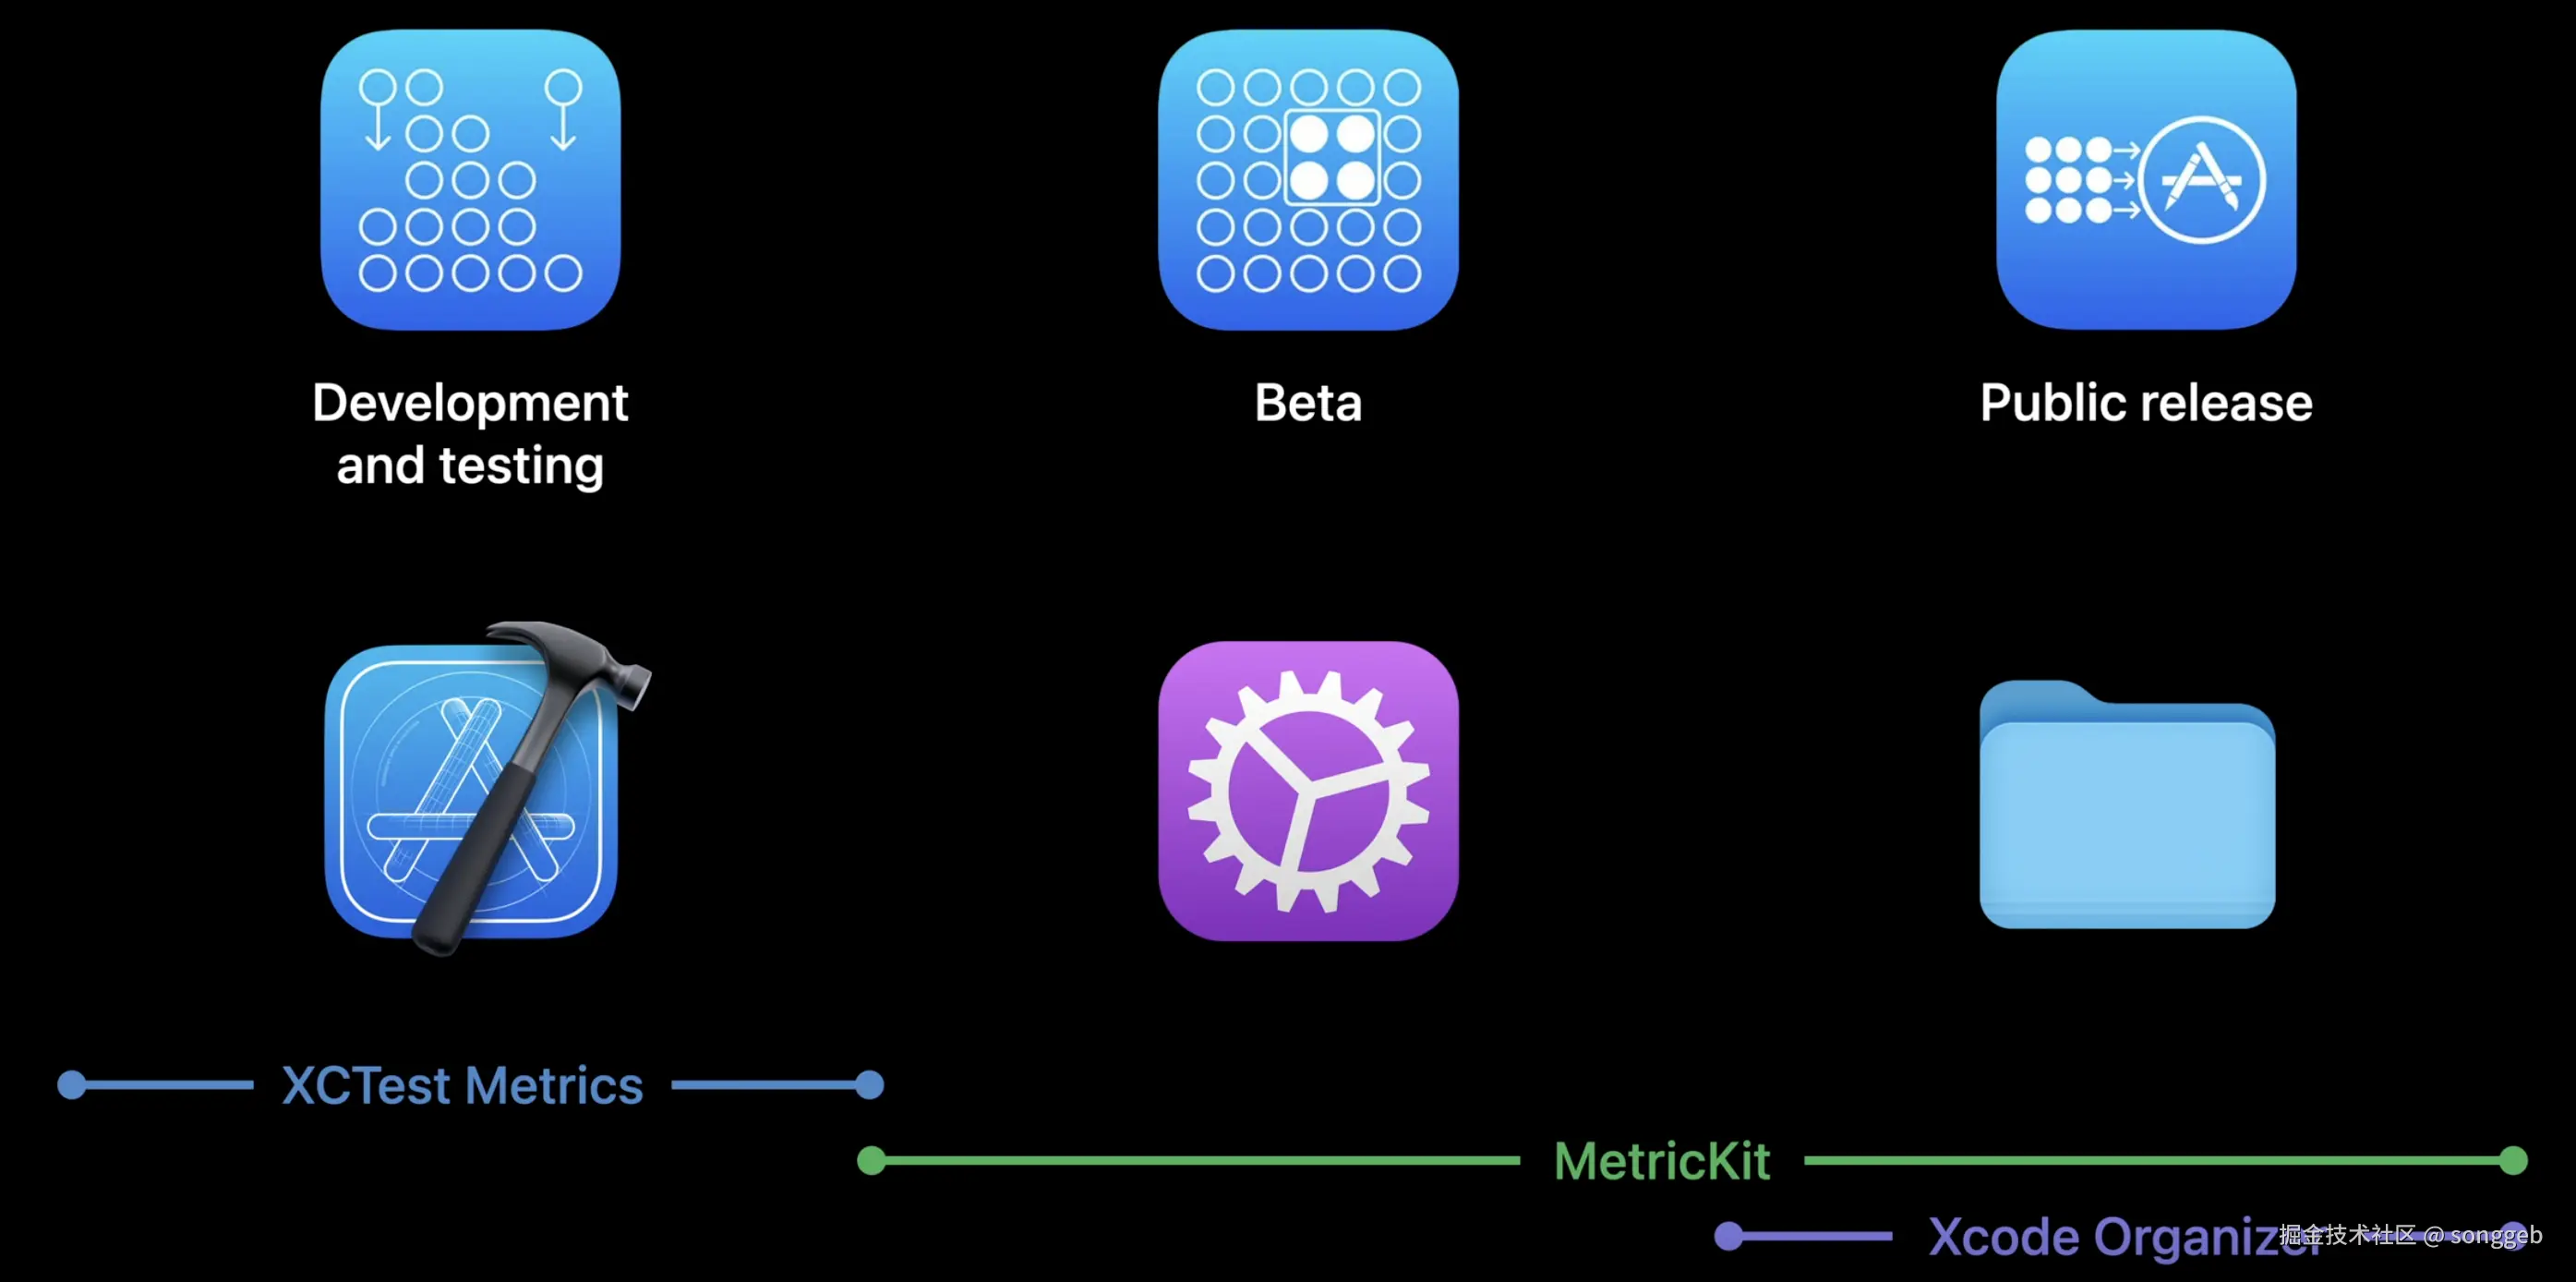
Performance XCTests
可以使用XCTests去检查各个功能的性能表现,比如
- Memory utilization,内存利用情况
- CPU usage
- Disk writes
- Hitch rate,卡顿率
- Wall clock time,功能的耗时情况
- Application launch time
Memory utilization 示例
scss
func testSaveMeal() {
    let app = XCUIApplication()
    let options = XCTMeasureOptions()
    options.invocationOptions = [.manuallyStart]
    measure(metrics: [XCTMemoryMetric(application: aapp)1
        options: options) {
        app.launch()
        startMeasuring()
        app.cells.firstMatch.buttons["Save meal"].firstMatch.tap()
        let savedButton = app.cells.firstMatch.buttons["Saved"].firstMatch
        XCTAssertTrue (savedButton.waitForExistendce(timeout: 30)
    }
}
上述代码检测的是点击"Save meal"按钮后内存的变化情况,变化情况如下图所示:
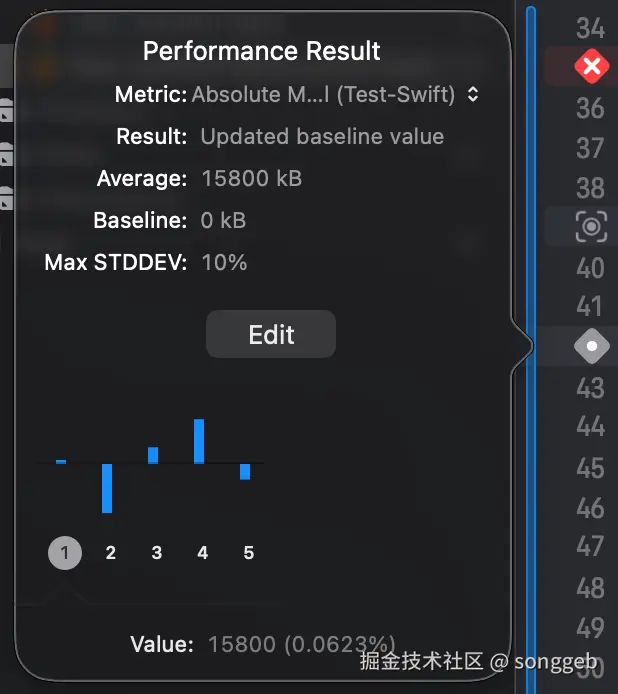
- Metric项可以选择不同的内存检测指标,如内存峰值还是普通内存值
- 底部柱状图表示是多次执行的情况
- Average项表示的是所选Metric的均值情况
- Baseline、Max STDDEV(最大标准差)则可以用来设置检测基线和上下浮动阈值
- 当检测结束后,可以通过Result查看本次检测结果变好了还是变差了
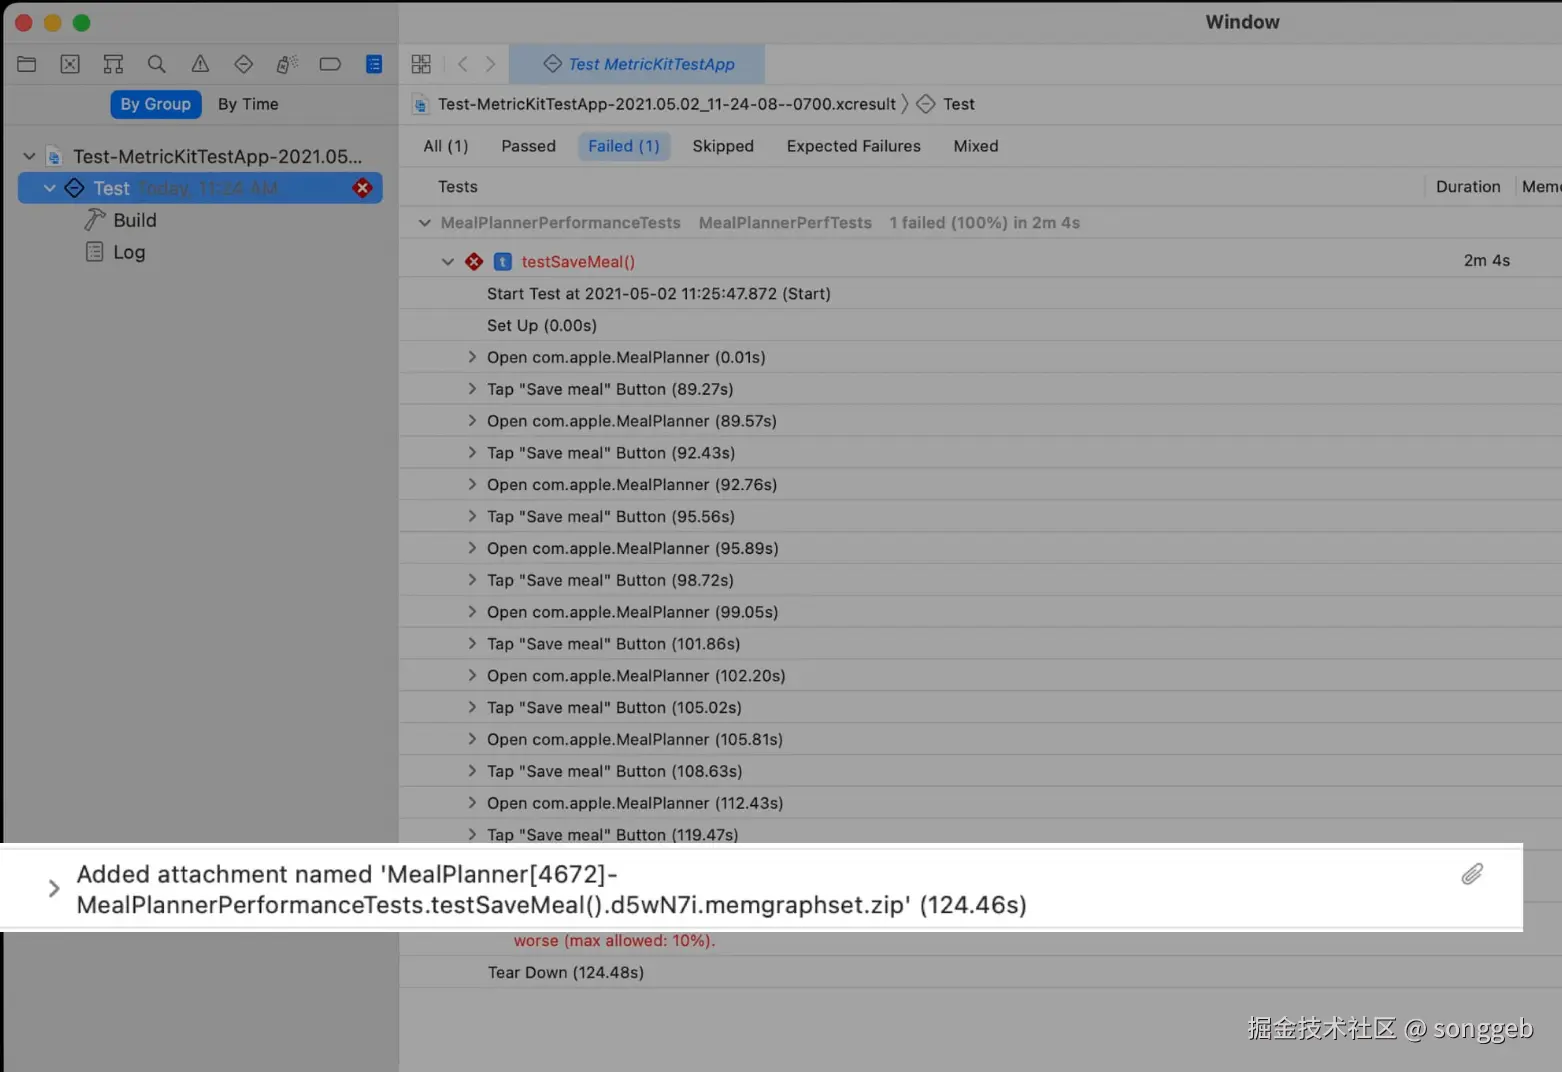
Diagnostic collection
Xcode 13中引入了两个有力的诊断数据Ktrace files和Memory graphs
执行Performance XCTests时可以开启他们
Ktrace files
是一种专用的文件类型,用于分析卡顿问题,可以用Instrument直接打开
详情可以参考
Memory graphs
某一时刻,App内存中所有对象及引用关系数据
- 在日常使用Xcode debug App时,我们也能看到内置的Memory graphs功能
- 下图为运行完XCTests后,结果中Memory graphs文件,也可以单独进行分析
Types of memory issues
内存问题类型有多种,本session中会介绍到Leaks(内存泄漏)和Heap size issues
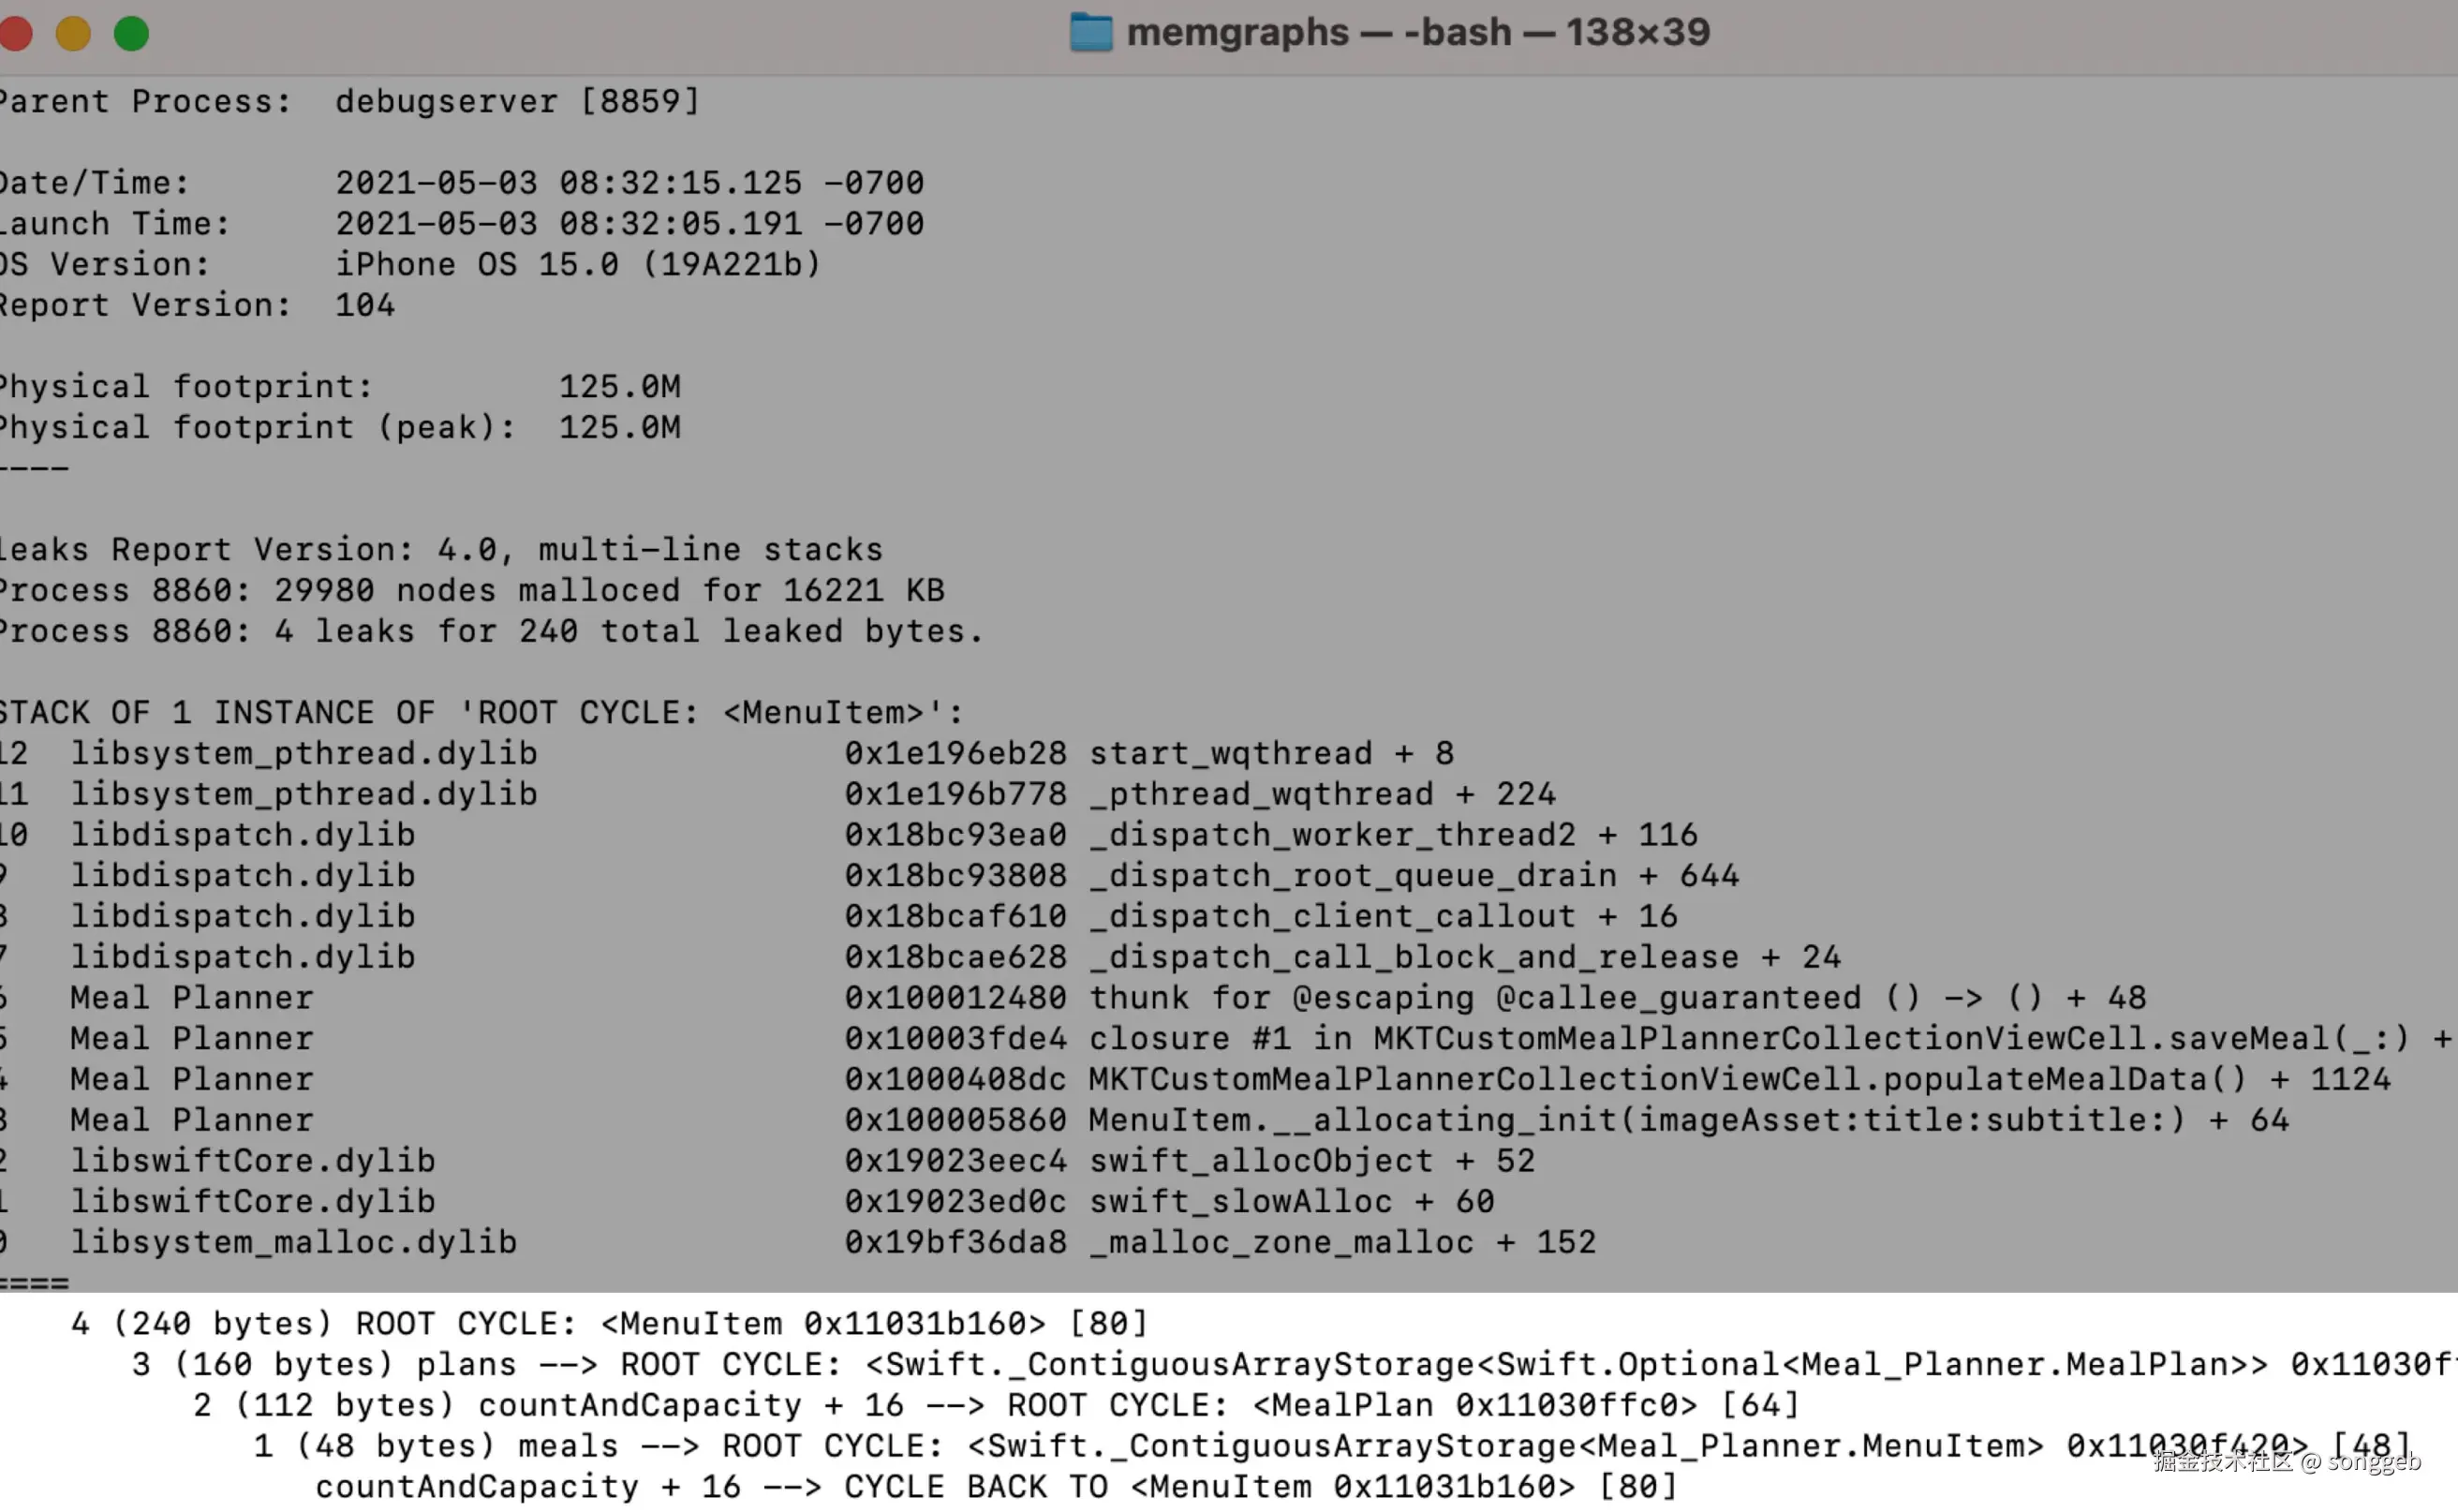
Leaks
对于内存泄漏问题,可以使用leaks命令对钱文忠的Memory graphs文件进行分析,查找泄漏的代码堆栈、是否存在循环引用
Heap size issues
Heap allocations regressions
堆内存占用的劣化问题
为减少使用堆内存开辟空间导致内存占用劣化,我们可以这样做:
- Remove unused allocations
- Shrink overly large allocations
- Deallocated memory you are finished with
- Wait to allocate memory until you need it
Session中提到,官方提供了如vmmap等一系列命令对前面生成的Memory graphs文件分析
Fragmentation
Fragmentation译为碎片化
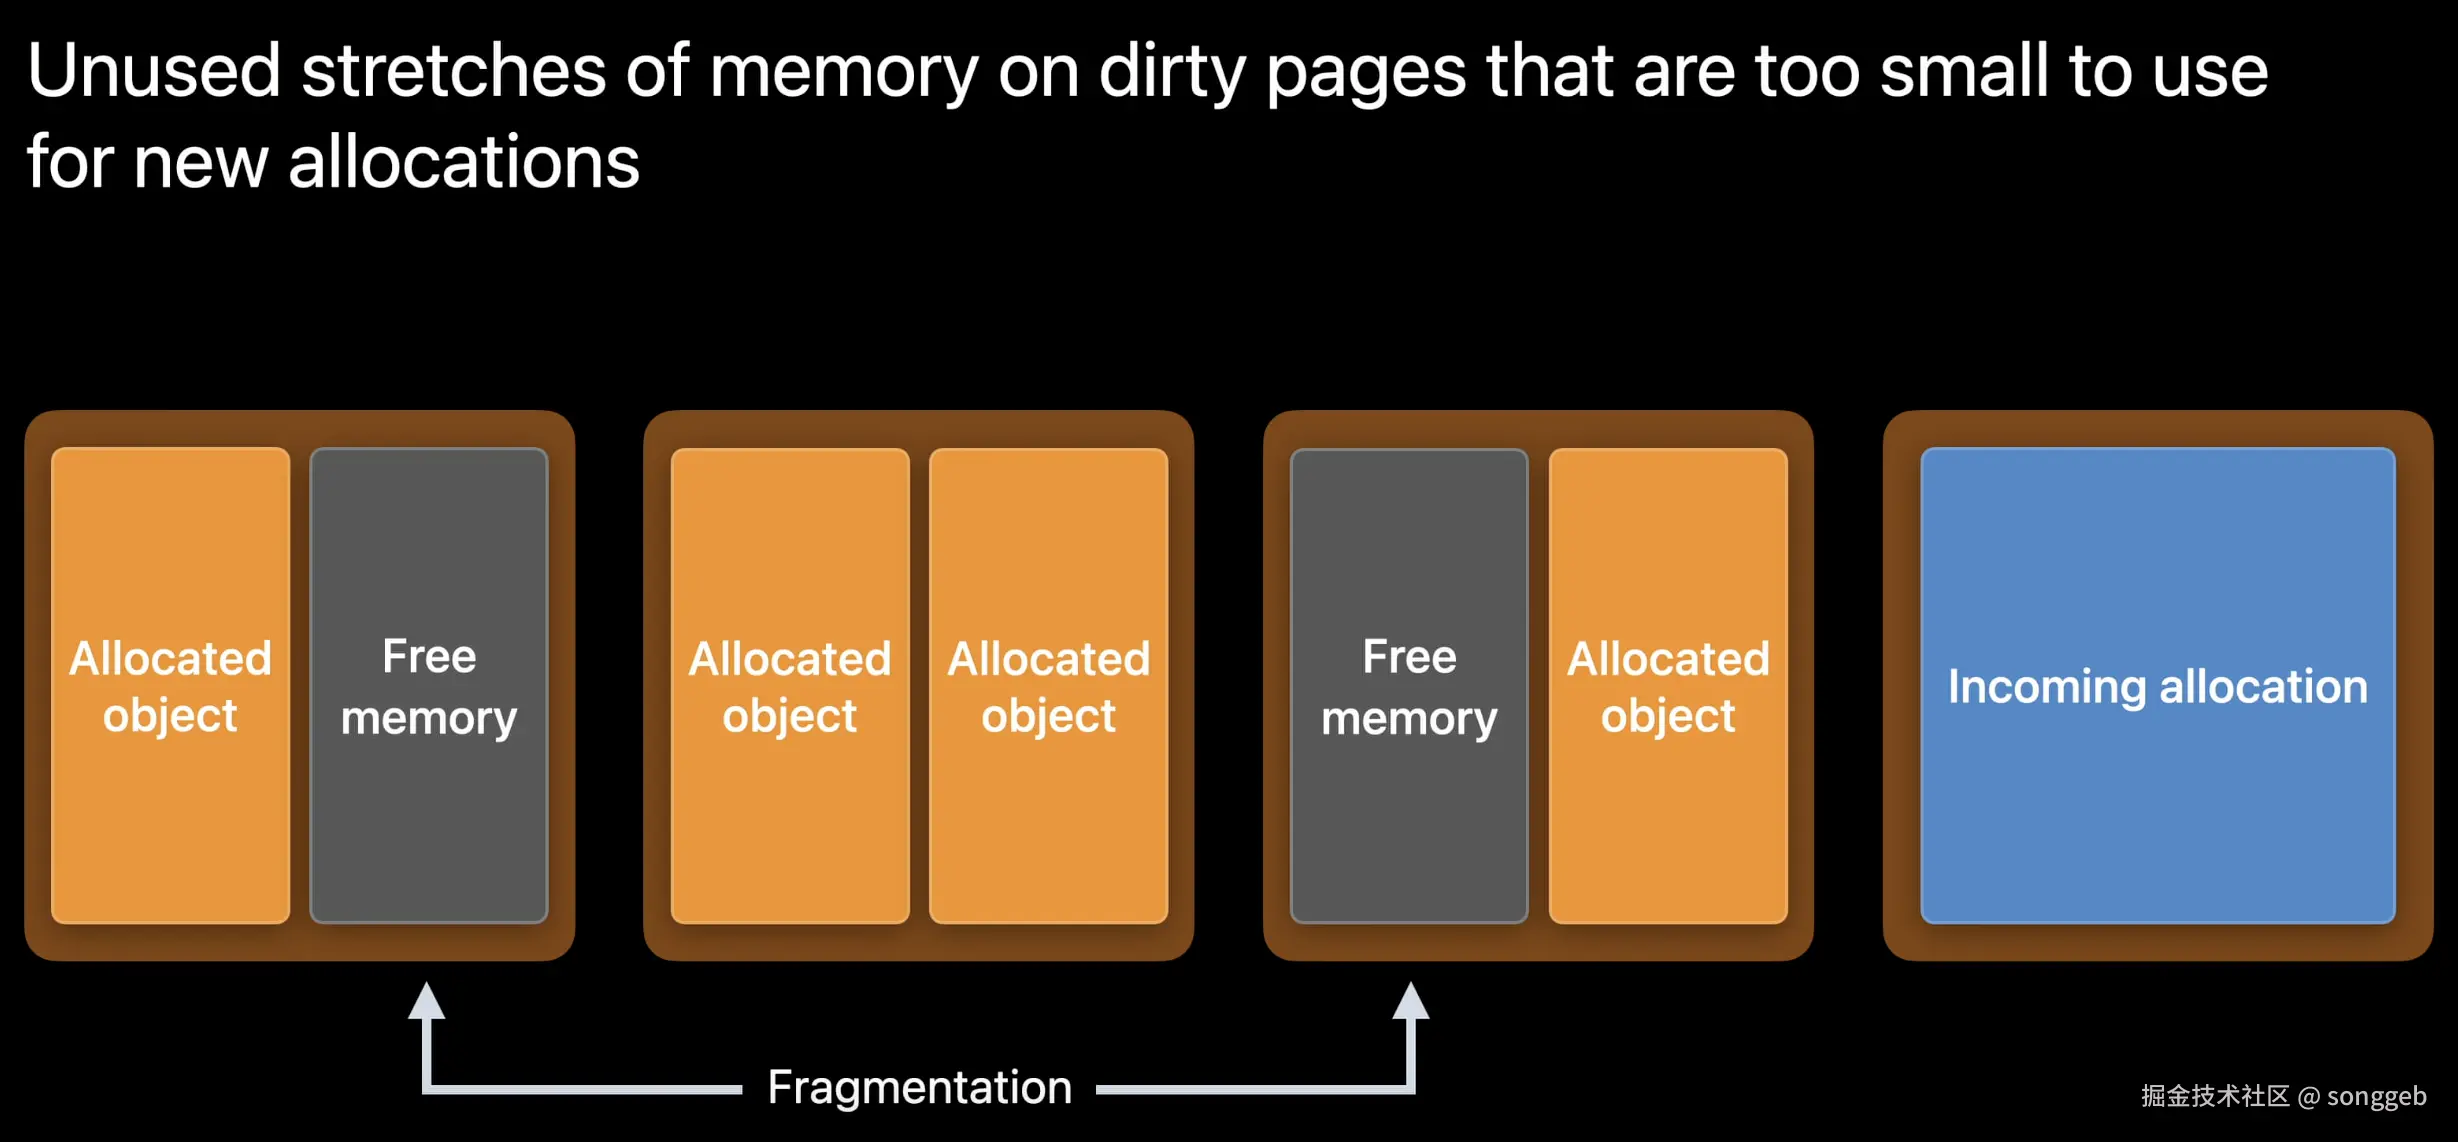
如何可以减少碎片化
- Allocate objects with similar lifetimes close to each other
- Aim for 25% fragmentation
- Use autorelease pools
- Pay extra attention to long running processes
- Use allocations track in Instruments
也可以使用vmmap等命令查看碎片比例
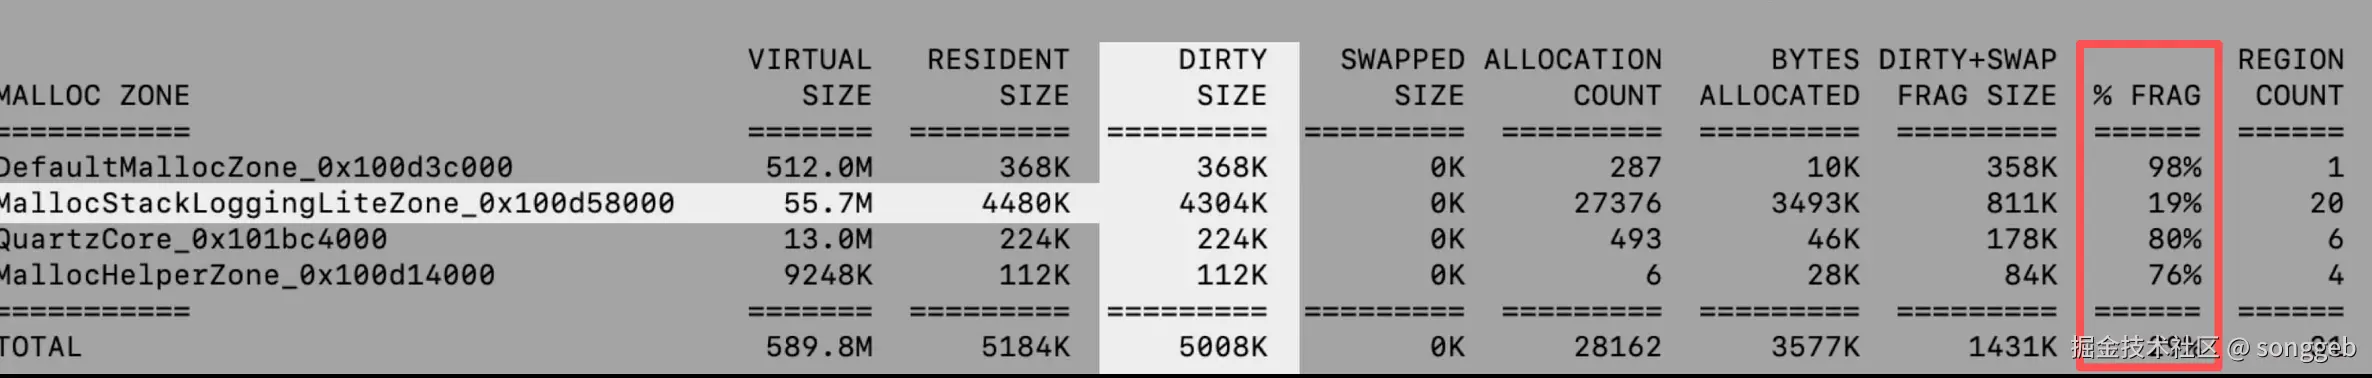
- 上图中FRAG是碎片比例
- DIRTY SIZE表示碎片化导致的Dirty pages情况
- DIRTY+SWAP FRAG SIZE表示的是碎片空间大小
总结
总结一下官方推荐的检测、诊断内存问题的最佳实践
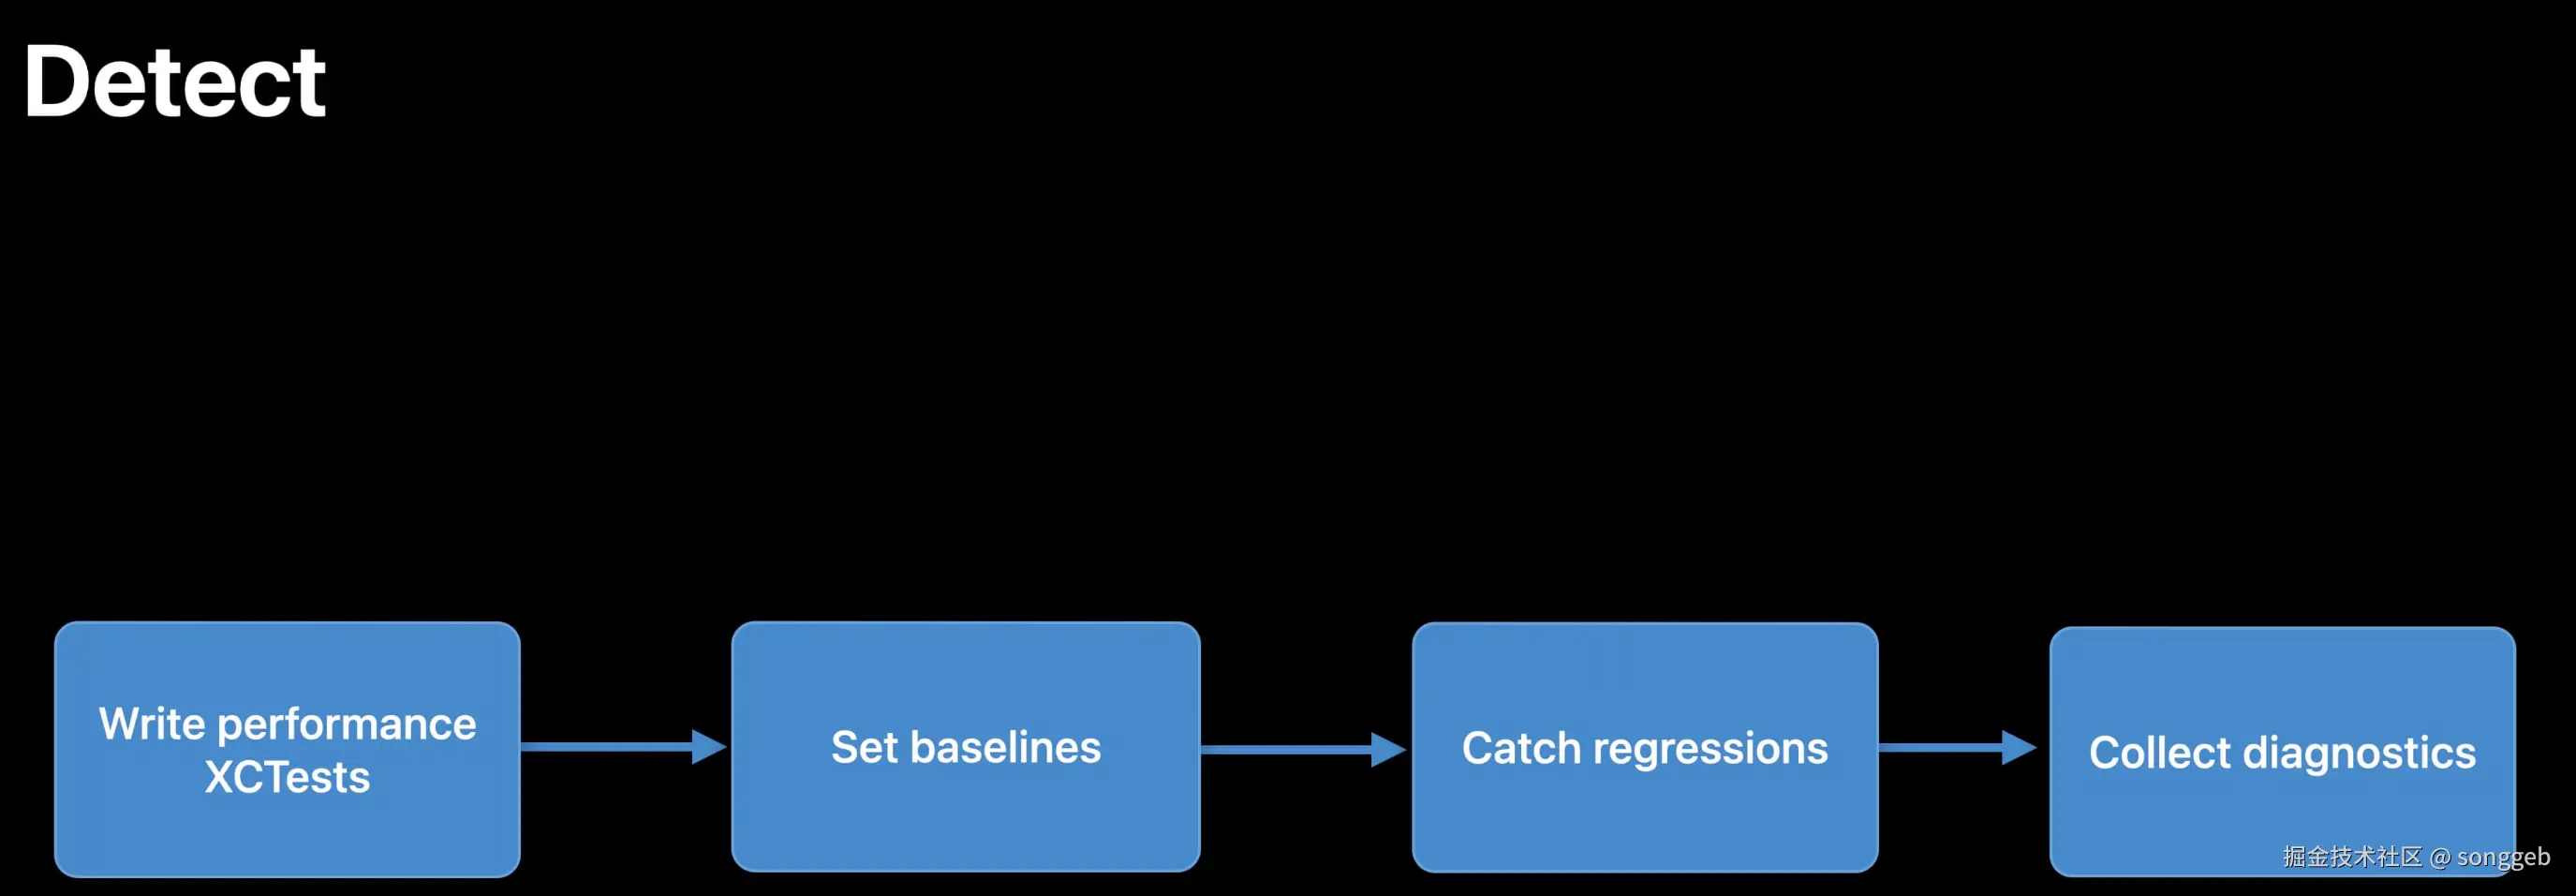
第一步:先是检测
- 针对业务功能/场景编写Performance XCTests
- 设置baseline(基线)进行测试
- 如果发现有regression(劣化),则收集诊断数据(Memory graphs or Ktrace)
第二步:诊断
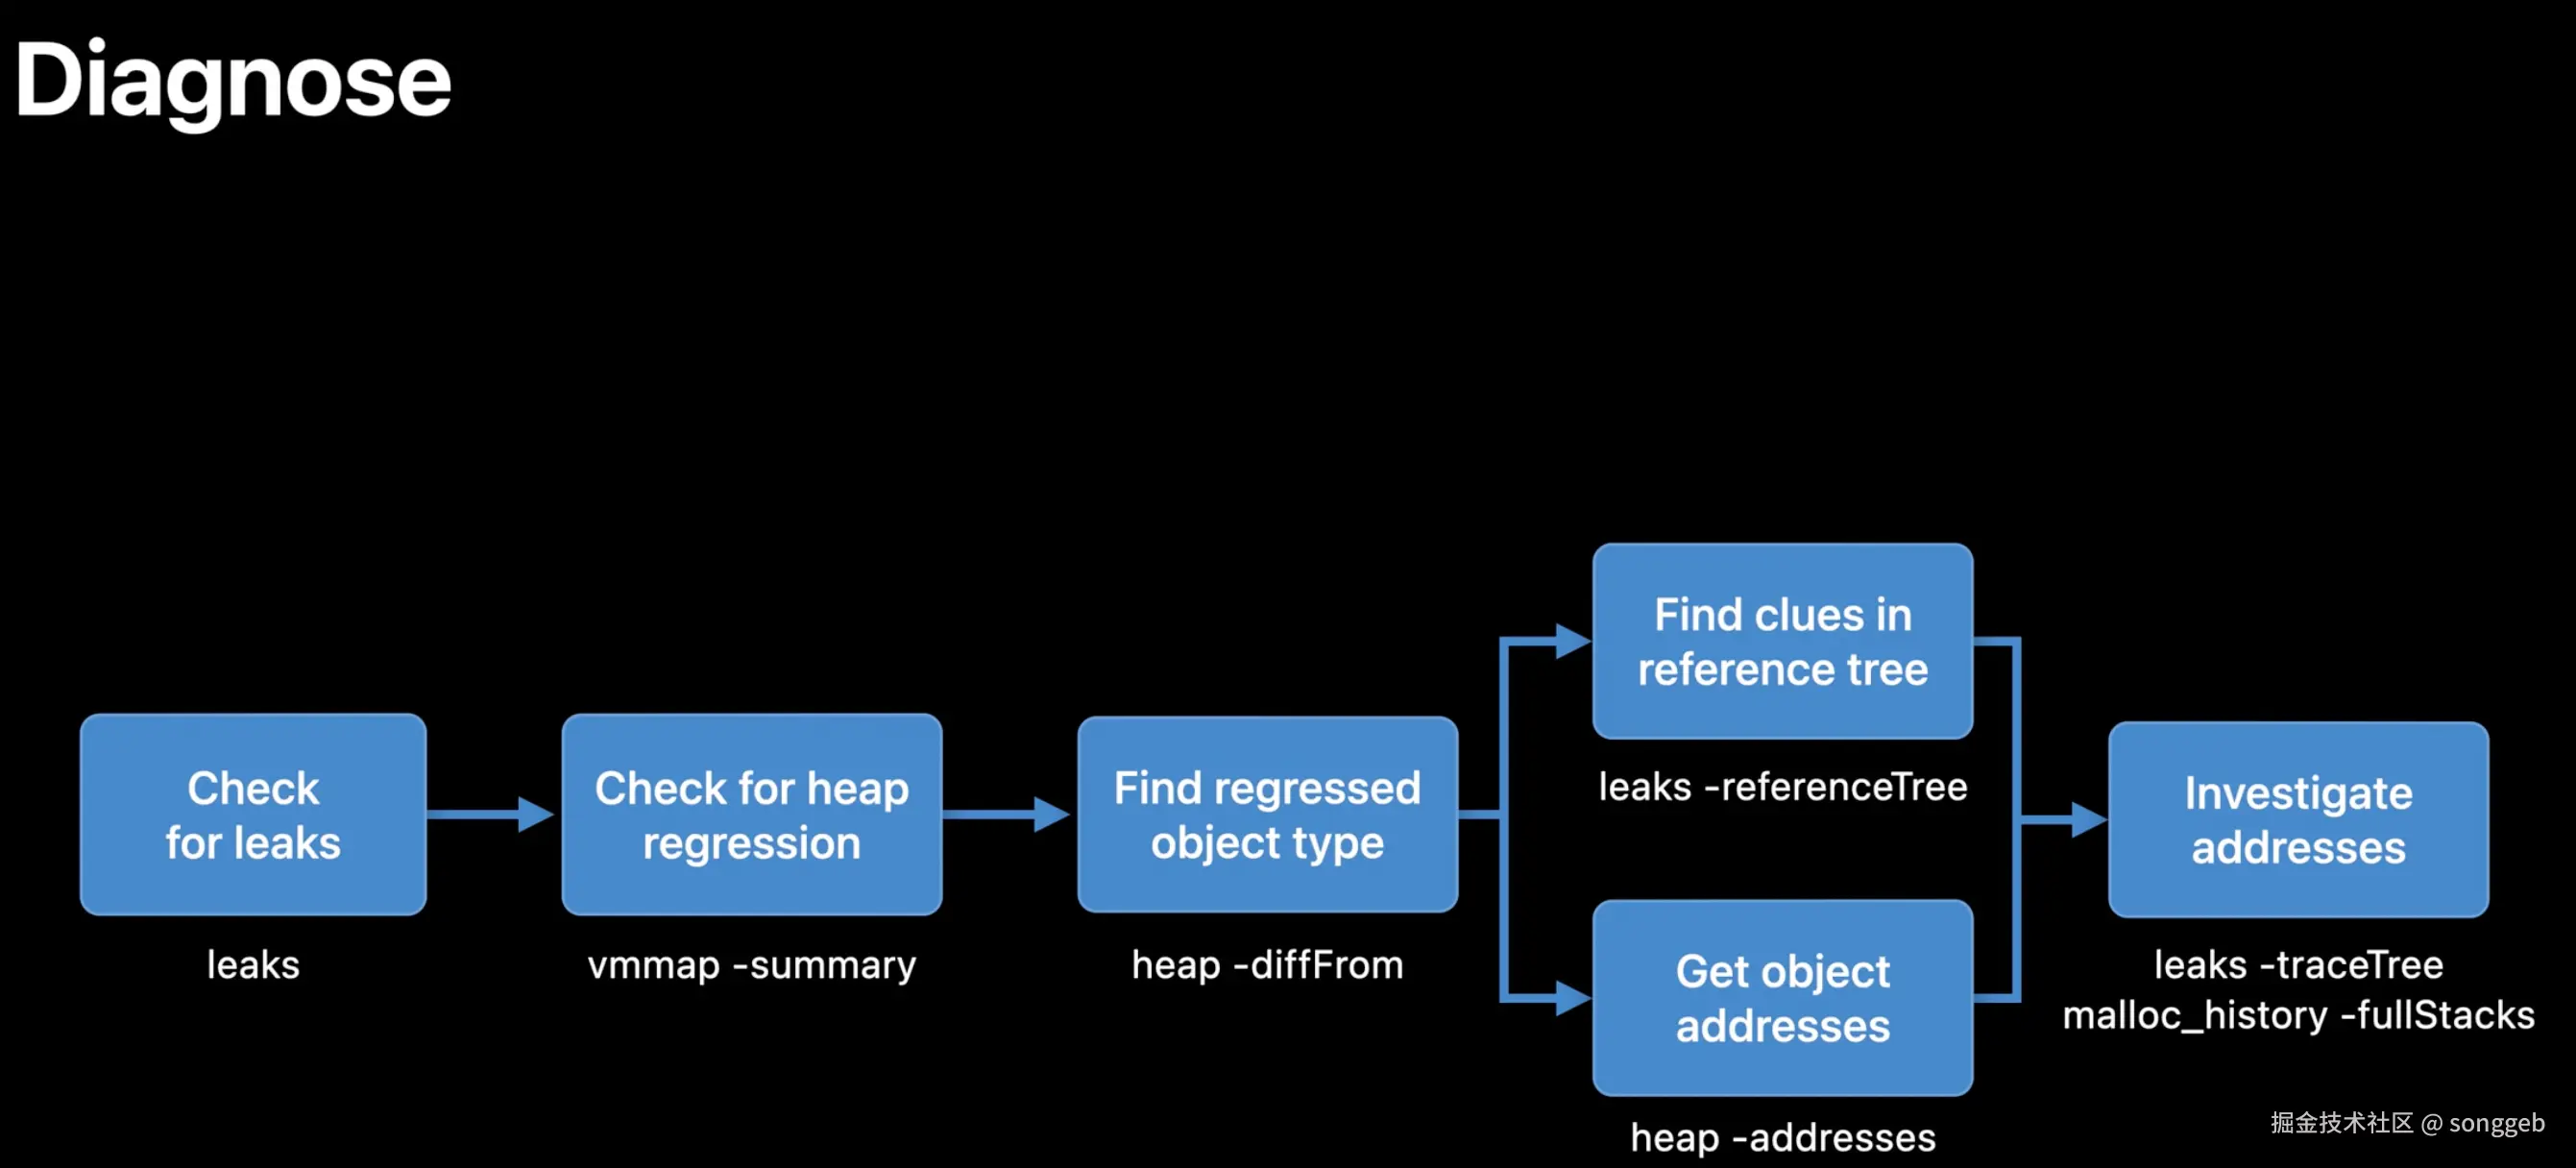
- 检查最易发现的内存泄漏
- 再使用各种命令查看是否有堆内存劣化