一、准备实验环境:
1.进入GaussDB数据库,创建测试库和用户。
sql
gsql -d postgres -p 8000 -r

create database testdb;

create user tester with sysadmin password 'Gauss@123';
2.配置benchmarksql。
sql
cd /data/benchmark/benchmark/run

cp props.pg props.pg.bak
chmod +x *.sh

vim props.pg

#配置文件修改为

db=postgres
driver=org.postgresql.Driver
##修改连接字符串, 包含IP、端口号、数据库,其中IP为数据库服务端的千兆网卡IP。
conn=jdbc:postgresql://192.168.3.60:8000/testdb?targetServerType=master&loggerLevel=OFF
##设置数据库登录用户和密码。
user=tester
password=Gauss@123

warehouses=2
loadWorkers=1

##设置最大并发数量, 跟服务端最大work数对应。
terminals=10
##要为每个终端运行指定事务 --runMins必须等于零
runTxnsPerTerminal=0
##要运行指定的分钟 --runTxnsPerTerminal必须等于零
runMins=3
##每分钟总事务数
limitTxnsPerMin=0


#保存退出
3.执行如下命令,进行数据初始化。
sql
[root@gs01 run]# ./runDatabaseBuild.sh props.pg
# ------------------------------------------------------------
# Loading SQL file ./sql.postgres/tableCreates.sql
# ------------------------------------------------------------
create table bmsql_config (
cfg_name varchar(30),
cfg_value varchar(50)
);
create table bmsql_warehouse (
w_id integer not null,
w_ytd decimal(12,2),
w_tax decimal(4,4),
w_name varchar(10),
w_street_1 varchar(20),
w_street_2 varchar(20),
w_city varchar(20),
w_state char(2),
w_zip char(9)
);
create table bmsql_district (
d_w_id integer not null,
d_id integer not null,
d_ytd decimal(12,2),
d_tax decimal(4,4),
d_next_o_id integer,
d_name varchar(10),
d_street_1 varchar(20),
d_street_2 varchar(20),
d_city varchar(20),
d_state char(2),
d_zip char(9)
);
create table bmsql_customer (
c_w_id integer not null,
c_d_id integer not null,
c_id integer not null,
c_discount decimal(4,4),
c_credit char(2),
c_last varchar(16),
c_first varchar(16),
c_credit_lim decimal(12,2),
c_balance decimal(12,2),
c_ytd_payment decimal(12,2),
c_payment_cnt integer,
c_delivery_cnt integer,
c_street_1 varchar(20),
c_street_2 varchar(20),
c_city varchar(20),
c_state char(2),
c_zip char(9),
c_phone char(16),
c_since timestamp,
c_middle char(2),
c_data varchar(500)
);
-- create sequence bmsql_hist_id_seq;
create table bmsql_history (
hist_id integer,
h_c_id integer,
h_c_d_id integer,
h_c_w_id integer,
h_d_id integer,
h_w_id integer,
h_date timestamp,
h_amount decimal(6,2),
h_data varchar(24)
);
create table bmsql_new_order (
no_w_id integer not null,
no_d_id integer not null,
no_o_id integer not null
);
create table bmsql_oorder (
o_w_id integer not null,
o_d_id integer not null,
o_id integer not null,
o_c_id integer,
o_carrier_id integer,
o_ol_cnt integer,
o_all_local integer,
o_entry_d timestamp
);
create table bmsql_order_line (
ol_w_id integer not null,
ol_d_id integer not null,
ol_o_id integer not null,
ol_number integer not null,
ol_i_id integer not null,
ol_delivery_d timestamp,
ol_amount decimal(6,2),
ol_supply_w_id integer,
ol_quantity integer,
ol_dist_info char(24)
);
create table bmsql_item (
i_id integer not null,
i_name varchar(24),
i_price decimal(5,2),
i_data varchar(50),
i_im_id integer
);
create table bmsql_stock (
s_w_id integer not null,
s_i_id integer not null,
s_quantity integer,
s_ytd integer,
s_order_cnt integer,
s_remote_cnt integer,
s_data varchar(50),
s_dist_01 char(24),
s_dist_02 char(24),
s_dist_03 char(24),
s_dist_04 char(24),
s_dist_05 char(24),
s_dist_06 char(24),
s_dist_07 char(24),
s_dist_08 char(24),
s_dist_09 char(24),
s_dist_10 char(24)
);
Starting BenchmarkSQL LoadData

driver=org.postgresql.Driver
conn=jdbc:postgresql://192.168.3.60:8000/testdb?autoBalance=true&refreshCNIpListTime&prepareThreshold=1&batchMode=on&fetchsize=10&loggerLevel=OFF
user=tester
password=***********
warehouses=2
loadWorkers=1
fileLocation (not defined)
csvNullValue (not defined - using default 'NULL')

Worker 000: Loading ITEM
Worker 000: Loading ITEM done
Worker 000: Loading Warehouse      1
Worker 000: Loading Warehouse      1 done
Worker 000: Loading Warehouse      2
Worker 000: Loading Warehouse      2 done
# ------------------------------------------------------------
# Loading SQL file ./sql.postgres/indexCreates.sql
# ------------------------------------------------------------
-- \parallel on 8
alter table bmsql_warehouse add constraint bmsql_warehouse_pkey
primary key (w_id);
alter table bmsql_district add constraint bmsql_district_pkey
primary key (d_w_id, d_id);
alter table bmsql_customer add constraint bmsql_customer_pkey
primary key (c_w_id, c_d_id, c_id);
create index bmsql_customer_idx1
on  bmsql_customer (c_w_id, c_d_id, c_last, c_first);
alter table bmsql_oorder add constraint bmsql_oorder_pkey
primary key (o_w_id, o_d_id, o_id);
create index bmsql_oorder_idx1
on  bmsql_oorder (o_w_id, o_d_id, o_c_id);
--create unique index bmsql_oorder_idx2
--  on  bmsql_oorder (o_w_id, o_d_id, o_c_id, o_id);
alter table bmsql_new_order add constraint bmsql_new_order_pkey
primary key (no_w_id, no_d_id, no_o_id);
alter table bmsql_order_line add constraint bmsql_order_line_pkey
primary key (ol_w_id, ol_d_id, ol_o_id, ol_number);
alter table bmsql_stock add constraint bmsql_stock_pkey
primary key (s_w_id, s_i_id);
alter table bmsql_item add constraint bmsql_item_pkey
primary key (i_id);
-- \parallel off
# ------------------------------------------------------------
# Loading SQL file ./sql.postgres/buildFinish.sql
# ------------------------------------------------------------
-- ----
-- Extra commands to run after the tables are created, loaded,
-- indexes built and extra's created.
-- PostgreSQL version.
-- ----
--vacuum analyze;
analyze;
[root@gs01 run]#
4.查看 maintenance_work_mem、work_mem、shared_buffers 等参数。
sql
[Ruby@gs01 ~]$ gsql -d postgres -p 8000 -r
gsql ((GaussDB Kernel 505.2.1.SPC0800 build 85996fbb) compiled at 2025-07-03 01:15:58 commit 10558 last mr 24271 release)
Non-SSL connection (SSL connection is recommended when requiring high-security)
Type "help" for help.

gaussdb=# show maintenance_work_mem;
 maintenance_work_mem
----------------------
 64MB
(1 row)

gaussdb=# show work_mem;
 work_mem
----------
 64MB
(1 row)

gaussdb=# show shared_buffers;
 shared_buffers
----------------
 1GB
(1 row)
5.重新设置 maintenance_work_mem、work_mem、shared_buffers 等参数。
sql
[Ruby@gs01 ~]$ gs_guc reload -Z datanode -N all -I all -c "maintenance_work_mem=1024"
The gs_guc run with the following arguments: [gs_guc -Z datanode -N all -I all -c maintenance_work_mem=1024 reload ].
Begin to perform the total nodes: 1.
Popen count is 1, Popen success count is 1, Popen failure count is 0.
Begin to perform gs_guc for datanodes.
Command count is 1, Command success count is 1, Command failure count is 0.

Total instances: 1. Failed instances: 0.
ALL: Success to perform gs_guc!


[Ruby@gs01 ~]$ gs_guc reload -Z datanode -N all -I all -c "work_mem=8192"
The gs_guc run with the following arguments: [gs_guc -Z datanode -N all -I all -c work_mem=8192 reload ].
NOTICE: For complex queries, it may run several concurrent sort or hash operation, each of which can use the amount of memory that this parameter is declared using the temporary file is insufficient. Also, several running sessions could be sorted the same time. Therefore, the total memory usage may be work_mem several times.
Begin to perform the total nodes: 1.
Popen count is 1, Popen success count is 1, Popen failure count is 0.
Begin to perform gs_guc for datanodes.
Command count is 1, Command success count is 1, Command failure count is 0.

Total instances: 1. Failed instances: 0.
ALL: Success to perform gs_guc!


[Ruby@gs01 ~]$ gs_guc reload -Z datanode -N all -I all -c "shared_buffers=128"
The gs_guc run with the following arguments: [gs_guc -Z datanode -N all -I all -c shared_buffers=128 reload ].
Begin to perform the total nodes: 1.
Popen count is 1, Popen success count is 1, Popen failure count is 0.
Begin to perform gs_guc for datanodes.
Command count is 1, Command success count is 1, Command failure count is 0.

Total instances: 1. Failed instances: 0.
ALL: Success to perform gs_guc!
6.重启GaussDB集群。
sql
[Ruby@gs01 ~]$ cm_ctl stop && cm_ctl start
cm_ctl: stop cluster.
cm_ctl: stop nodeid: 1
cm_ctl: check node status take 0 seconds.
..
cm_ctl: check node status take 1 seconds.
.
cm_ctl: check node status take 1 seconds.
..
cm_ctl: check node status take 0 seconds.
.
cm_ctl: check node status take 0 seconds.
.
cm_ctl: check node status take 0 seconds.
.
cm_ctl: check node status take 0 seconds.
.
cm_ctl: check node status take 0 seconds.
.
cm_ctl: check node status take 0 seconds.
.
cm_ctl: check node status take 0 seconds.
.
cm_ctl: check node status take 1 seconds.
.
cm_ctl: check node status take 0 seconds.
.
cm_ctl: stop cluster successfully.
cm_ctl: checking cluster status.
cm_ctl: check node status take 0 seconds.
cm_ctl: start cluster.
cm_ctl: start nodeid: 1
....................
cm_ctl: start cluster successfully.
7.再次查看相关参数。
sql
[Ruby@gs01 ~]$ gsql -d postgres -p 8000 -r
gsql ((GaussDB Kernel 505.2.1.SPC0800 build 85996fbb) compiled at 2025-07-03 01:15:58 commit 10558 last mr 24271 release)
Non-SSL connection (SSL connection is recommended when requiring high-security)
Type "help" for help.

gaussdb=# show maintenance_work_mem;
 maintenance_work_mem
----------------------
 1MB
(1 row)

gaussdb=# show work_mem;
 work_mem
----------
 8MB
(1 row)

gaussdb=# show shared_buffers;
 shared_buffers
----------------
 1MB
(1 row)
二、参数调优
1.work_mem 参数调优实验
1.1 使用测试用户tester连接实验GaussDB实例。
sql
[Ruby@gs01 ~]$ gsql -d testdb -h 192.168.3.60 -U tester -p 8000 -W Gauss@123 -r
gsql ((GaussDB Kernel 505.2.1.SPC0800 build 85996fbb) compiled at 2025-07-03 01:15:58 commit 10558 last mr 24271 release)
SSL connection (cipher: ECDHE-RSA-AES128-GCM-SHA256, bits: 128)
Type "help" for help.

testdb=>
1.2 在数据库中执行一个排序语句。
sql
testdb=> explain analyze select * from bmsql_stock order by s_order_cnt limit 50000;
 id |             operation             |  A-time  | A-rows | E-rows | Peak Memory | A-width | E-width |       E-costs
----+-----------------------------------+----------+--------+--------+-------------+---------+---------+----------------------
  1 | ->  Limit                         | 1835.778 |  50000 |  50000 | 14KB        |         |     313 | 57130.040..57255.040
  2 |    ->  Sort                       | 1824.922 |  50000 |  50000 | 8329KB      |         |     313 | 57130.040..57630.040
  3 |       ->  Seq Scan on bmsql_stock | 246.437  | 200000 | 200000 | 45KB        |         |     313 | 0.000..11091.000
(3 rows)

     Memory Information (identified by plan id)
----------------------------------------------------
   2 --Sort
         Sort Method: external merge  Disk: 63232kB
(2 rows)

       ====== Query Summary =====
-----------------------------------------
 Datanode executor start time: 0.410 ms
 Datanode executor run time: 1841.170 ms
 Datanode executor end time: 6.328 ms
 Planner runtime: 1.501 ms
 Query Id: 1946680938930914949
 Total runtime: 1848.446 ms
(6 rows)
通过SQL执行计划可以看到该SQL语句执行耗时1848.446 ms,查看Memory Information,sort时有Disk关键字,说明排序时有了落盘的操作,会造成性能的极大下降,需要进行优化。
1.3 查看当前work_mem参数值。
sql
testdb=> show work_mem;
 work_mem
----------
 8MB
(1 row)
1.4 修改work_mem参数为65536。
sql
[Ruby@gs01 ~]$ gs_guc reload -Z datanode -N all -I all -c "work_mem=65536"
The gs_guc run with the following arguments: [gs_guc -Z datanode -N all -I all -c work_mem=65536 reload ].
NOTICE: For complex queries, it may run several concurrent sort or hash operation, each of which can use the amount of memory that this parameter is declared using the temporary file is insufficient. Also, several running sessions could be sorted the same time. Therefore, the total memory usage may be work_mem several times.
Begin to perform the total nodes: 1.
Popen count is 1, Popen success count is 1, Popen failure count is 0.
Begin to perform gs_guc for datanodes.
Command count is 1, Command success count is 1, Command failure count is 0.

Total instances: 1. Failed instances: 0.
ALL: Success to perform gs_guc!
1.5 使用测试用户tester连接实验GaussDB实例。
sql
[Ruby@gs01 ~]$ gsql -d testdb -h 192.168.3.60 -U tester -p 8000 -W Gauss@123 -r
gsql ((GaussDB Kernel 505.2.1.SPC0800 build 85996fbb) compiled at 2025-07-03 01:15:58 commit 10558 last mr 24271 release)
SSL connection (cipher: ECDHE-RSA-AES128-GCM-SHA256, bits: 128)
Type "help" for help.

testdb=>
1.6 执行如下命令查看work_mem参数。
sql
testdb=> show work_mem;
 work_mem
----------
 64MB
(1 row)
1.7 再次执行同样的SQL语句。
sql
testdb=> explain analyze select * from bmsql_stock order by s_order_cnt limit 50000;
 id |             operation             | A-time  | A-rows | E-rows | Peak Memory | A-width | E-width |       E-costs
----+-----------------------------------+---------+--------+--------+-------------+---------+---------+----------------------
  1 | ->  Limit                         | 838.580 |  50000 |  50000 | 14KB        |         |     313 | 27700.640..27825.640
  2 |    ->  Sort                       | 826.130 |  50000 |  50000 | 29348KB     |         |     313 | 27700.640..28200.640
  3 |       ->  Seq Scan on bmsql_stock | 251.323 | 200000 | 200000 | 45KB        |         |     313 | 0.000..11091.000
(3 rows)

      Memory Information (identified by plan id)
------------------------------------------------------
   2 --Sort
         Sort Method: top-N heapsort  Memory: 29332kB
(2 rows)

       ====== Query Summary =====
----------------------------------------
 Datanode executor start time: 0.145 ms
 Datanode executor run time: 844.467 ms
 Datanode executor end time: 0.048 ms
 Planner runtime: 0.659 ms
 Query Id: 1946680938930923084
 Total runtime: 844.700 ms
(6 rows)
通过通过执行计划中信息Sort Method: top-N heapsort Memory可以看到sort基本都在内存中进行,语句执行耗时从1848.446 ms优化到844.700 ms,主要减少的时间就在sort这一算子。
2.maintenance_work_mem参数调优实验
2.1 使用测试用户tester连接实验GaussDB实例。
sql
[Ruby@gs01 ~]$ gsql -d testdb -h 192.168.3.60 -U tester -p 8000 -W Gauss@123 -r
gsql ((GaussDB Kernel 505.2.1.SPC0800 build 85996fbb) compiled at 2025-07-03 01:15:58 commit 10558 last mr 24271 release)
SSL connection (cipher: ECDHE-RSA-AES128-GCM-SHA256, bits: 128)
Type "help" for help.

testdb=>
2.2 开启时间显示。
sql
testdb=> \timing
Timing is on.
testdb=>
2.3 执行如下命令,创建bmsql_stock的新索引。
sql
testdb=> create index idx_bmsql_stock on bmsql_stock(s_i_id,s_quantity,s_ytd);
CREATE INDEX
Time: 600.360 ms
testdb=>
2.4 消耗时间较长,需要优化时,可以查看当前maintenance_work_mem参数值。
sql
testdb=> show maintenance_work_mem;
 maintenance_work_mem
----------------------
 1MB
(1 row)

Time: 1.432 ms
testdb=>
2.5 修改 maintenance_work_mem 参数为 262144。
sql
[Ruby@gs01 ~]$ gs_guc reload -Z datanode -N all -I all -c "maintenance_work_mem=262144"
The gs_guc run with the following arguments: [gs_guc -Z datanode -N all -I all -c maintenance_work_mem=262144 reload ].
Begin to perform the total nodes: 1.
Popen count is 1, Popen success count is 1, Popen failure count is 0.
Begin to perform gs_guc for datanodes.
Command count is 1, Command success count is 1, Command failure count is 0.

Total instances: 1. Failed instances: 0.
ALL: Success to perform gs_guc!
2.6 使用测试用户tester连接实验GaussDB实例。
sql
[Ruby@gs01 ~]$ gsql -d testdb -h 192.168.3.60 -U tester -p 8000 -W Gauss@123 -r
gsql ((GaussDB Kernel 505.2.1.SPC0800 build 85996fbb) compiled at 2025-07-03 01:15:58 commit 10558 last mr 24271 release)
SSL connection (cipher: ECDHE-RSA-AES128-GCM-SHA256, bits: 128)
Type "help" for help.

testdb=>
2.7 执行如下命令查看maintenance_work_mem参数。
sql
testdb=> show maintenance_work_mem;
 maintenance_work_mem
----------------------
 256MB
(1 row)
2.8 使用如下命令开启时间显示。
sql
testdb=> \timing
Timing is on.
testdb=>
2.9 执行如下命令先删除索引。
sql
testdb=> drop index idx_bmsql_stock;
DROP INDEX
Time: 29.542 ms
testdb=>
2.10 再次执行创建bmsql_stock的新索引。
sql
testdb=> create index idx_bmsql_stock on bmsql_stock(s_i_id,s_quantity,s_ytd);
CREATE INDEX
Time: 338.978 ms
testdb=>
本实验仅为了对比设置maintenance_work_mem参数不同时会影响数据库的维护性操作,实际业务场景下,对VACUUM、VACUUM FULL、CLUSTER、CREATE INDEX的执行效率都会有影响,且表和数据库大小越大时影响越明显。
3.shared_buffers参数调优实验
3.1 使用管理员root连接实验GaussDB实例。
sql
[Ruby@gs01 ~]$ gsql -d postgres -p 8000 -r
gsql ((GaussDB Kernel 505.2.1.SPC0800 build 85996fbb) compiled at 2025-07-03 01:15:58 commit 10558 last mr 24271 release)
Non-SSL connection (SSL connection is recommended when requiring high-security)
Type "help" for help.

gaussdb=#
3.2 清理性能视图数据。
sql
gaussdb=# select reset_unique_sql('GLOBAL','ALL',0);
 reset_unique_sql
------------------
 t
(1 row)
3.3 执行如下命令拉起TPCC,模拟业务压力。
sql
[root@gs01 run]# cd /data/benchmark/benchmark/run
[root@gs01 run]#
[root@gs01 run]# ./runBenchmark.sh props.pg
04:19:17,094 [main] INFO   jTPCC : Term-00,
04:19:17,101 [main] INFO   jTPCC : Term-00, +-------------------------------------------------------------+
04:19:17,101 [main] INFO   jTPCC : Term-00,      BenchmarkSQL v5.0
04:19:17,101 [main] INFO   jTPCC : Term-00, +-------------------------------------------------------------+
04:19:17,102 [main] INFO   jTPCC : Term-00,  (c) 2003, Raul Barbosa
04:19:17,102 [main] INFO   jTPCC : Term-00,  (c) 2004-2016, Denis Lussier
04:19:17,107 [main] INFO   jTPCC : Term-00,  (c) 2016, Jan Wieck
04:19:17,107 [main] INFO   jTPCC : Term-00, +-------------------------------------------------------------+
04:19:17,107 [main] INFO   jTPCC : Term-00,
04:19:17,107 [main] INFO   jTPCC : Term-00, db=postgres
04:19:17,108 [main] INFO   jTPCC : Term-00, driver=org.postgresql.Driver
04:19:17,108 [main] INFO   jTPCC : Term-00, conn=jdbc:postgresql://192.168.3.60:8000/testdb?autoBalance=true&refreshCNIpListTime&prepareThreshold=1&batchMode=on&fetchsize=10&loggerLevel=OFF
04:19:17,108 [main] INFO   jTPCC : Term-00, conn2=null
04:19:17,108 [main] INFO   jTPCC : Term-00, conn3=null
04:19:17,108 [main] INFO   jTPCC : Term-00, conn4=null
04:19:17,108 [main] INFO   jTPCC : Term-00, conn5=null
04:19:17,110 [main] INFO   jTPCC : Term-00, conn6=null
04:19:17,111 [main] INFO   jTPCC : Term-00, conn7=null
04:19:17,111 [main] INFO   jTPCC : Term-00, conn8=null
04:19:17,111 [main] INFO   jTPCC : Term-00, conn9=null
04:19:17,111 [main] INFO   jTPCC : Term-00, conn10=null
04:19:17,111 [main] INFO   jTPCC : Term-00, conn11=null
04:19:17,111 [main] INFO   jTPCC : Term-00, conn12=null
04:19:17,111 [main] INFO   jTPCC : Term-00, conn13=null
04:19:17,112 [main] INFO   jTPCC : Term-00, conn14=null
04:19:17,112 [main] INFO   jTPCC : Term-00, conn15=null
04:19:17,112 [main] INFO   jTPCC : Term-00, conn16=null
04:19:17,112 [main] INFO   jTPCC : Term-00, conn17=null
04:19:17,112 [main] INFO   jTPCC : Term-00, conn18=null
04:19:17,113 [main] INFO   jTPCC : Term-00, conn19=null
04:19:17,114 [main] INFO   jTPCC : Term-00, conn20=null
04:19:17,114 [main] INFO   jTPCC : Term-00, user=tester
04:19:17,114 [main] INFO   jTPCC : Term-00,
04:19:17,114 [main] INFO   jTPCC : Term-00, warehouses=2
04:19:17,115 [main] INFO   jTPCC : Term-00, terminals=10
04:19:17,115 [main] INFO   jTPCC : Term-00, runMins=3
04:19:17,115 [main] INFO   jTPCC : Term-00, limitTxnsPerMin=0
04:19:17,115 [main] INFO   jTPCC : Term-00, terminalWarehouseFixed=True
04:19:17,115 [main] INFO   jTPCC : Term-00,
04:19:17,115 [main] INFO   jTPCC : Term-00, newOrderWeight=45
04:19:17,116 [main] INFO   jTPCC : Term-00, paymentWeight=43
04:19:17,116 [main] INFO   jTPCC : Term-00, orderStatusWeight=4
04:19:17,116 [main] INFO   jTPCC : Term-00, deliveryWeight=4
04:19:17,116 [main] INFO   jTPCC : Term-00, stockLevelWeight=4
04:19:17,117 [main] INFO   jTPCC : Term-00,
04:19:17,117 [main] INFO   jTPCC : Term-00, resultDirectory=./my_result_collection/my_result_%tY-%tm-%td_%tH%tM%tS
04:19:17,117 [main] INFO   jTPCC : Term-00, osCollectorScript=null
04:19:17,117 [main] INFO   jTPCC : Term-00,
04:19:17,188 [main] INFO   jTPCC : Term-00, copied props.pg to ./my_result_collection/my_result_2025-11-23_041917/run.properties
04:19:17,189 [main] INFO   jTPCC : Term-00, created ./my_result_collection/my_result_2025-11-23_041917/data/runInfo.csv for runID 1589
04:19:17,189 [main] INFO   jTPCC : Term-00, writing per transaction results to ./my_result_collection/my_result_2025-11-23_041917/data/result.csv
04:19:17,190 [main] INFO   jTPCC : Term-00,
04:19:17,505 [main] INFO   jTPCC : Term-00, C value for C_LAST during load: 171
04:19:17,506 [main] INFO   jTPCC : Term-00, C value for C_LAST this run:    64                              Term-00, Running Average tpmTOTAL: 310.904:22:28,634 [Thread-8] INFO   jTPCC : Term-00, B / 151MB                                                                                           04:22:28,634 [Thread-8] INFO   jTPCC : Term-00,
04:22:28,634 [Thread-8] INFO   jTPCC : Term-00, Measured tpmC (NewOrders) = 147.45
04:22:28,634 [Thread-8] INFO   jTPCC : Term-00, Measured tpmTOTAL = 310.98
04:22:28,634 [Thread-8] INFO   jTPCC : Term-00, Session Start     = 2025-11-23 04:19:18
04:22:28,634 [Thread-8] INFO   jTPCC : Term-00, Session End       = 2025-11-23 04:22:28
04:22:28,634 [Thread-8] INFO   jTPCC : Term-00, Transaction Count = 986
[root@gs01 run]#
3.4 使用管理员root连接实验GaussDB实例。
sql
[Ruby@gs01 run]$ gsql -d postgres -p 8000 -r
gsql ((GaussDB Kernel 505.2.1.SPC0800 build 85996fbb) compiled at 2025-07-03 01:15:58 commit 10558 last mr 24271 release)
Non-SSL connection (SSL connection is recommended when requiring high-security)
Type "help" for help.

gaussdb=#
3.5 查看数据库系统性能视图summary_statement中的业务语句进行分析。
sql
gaussdb=# \x
Expanded display is on.
gaussdb=# select total_elapse_time/n_calls as avg,* from dbe_perf.summary_statement where user_name='tester' and n_calls<>0 order by avg desc;
-[ RECORD 1 ]--------+------------------------------------------------------------------------------------------------------------------------------
----------------------------------------------------------------------------------------------------------------------------------------------------
----------------------------------------------------------------------------------------------------------------------------------------------------
------------------------------------------------------
avg                  | 950477.825
node_name            | dn_6001
node_id              | 0
user_name            | tester
user_id              | 17383
unique_sql_id        | 2315013143
query                | SELECT count(*) AS low_stock FROM (    SELECT s_w_id, s_i_id, s_quantity         FROM bmsql_stock         WHERE s_w_id = $1 A
ND s_quantity < $2 AND s_i_id IN (            SELECT ol_i_id                 FROM bmsql_district                 JOIN bmsql_order_line ON ol_w_id =
d_w_id                  AND ol_d_id = d_id                  AND ol_o_id >= d_next_o_id - ?                  AND ol_o_id < d_next_o_id
  WHERE d_w_id = $3 AND d_id = $4         )     ) AS L
n_calls              | 40
min_elapse_time      | 33107
max_elapse_time      | 12519148
total_elapse_time    | 38019113
n_returned_rows      | 40
n_tuples_fetched     | 15302
n_tuples_returned    | 15279
n_tuples_inserted    | 0
n_tuples_updated     | 0
n_tuples_deleted     | 0
n_blocks_fetched     | 33367
n_blocks_hit         | 15149
n_soft_parse         | 0
n_hard_parse         | 40
db_time              | 38023938
cpu_time             | 3091276
execution_time       | 37469495
parse_time           | 922
plan_time            | 496224
rewrite_time         | 652
pl_execution_time    | 0
pl_compilation_time  | 0
data_io_time         | 432919
net_send_info        | {"time":987957, "n_calls":17926, "size":1290812}
net_recv_info        | {"time":0, "n_calls":0, "size":0}
net_stream_send_info | {"time":0, "n_calls":0, "size":0}
net_stream_recv_info | {"time":0, "n_calls":0, "size":0}
last_updated         | 2025-11-23 04:22:15.304185+08
sort_count           | 0
sort_time            | 0
sort_mem_used        | 0
sort_spill_count     | 0
sort_spill_size      | 0
hash_count           | 0
hash_time            | 0
hash_mem_used        | 0
hash_spill_count     | 0
hash_spill_size      | 0
parent_unique_sql_id | 0
lock_wait_time       | 0
total_used_memory    | 0
max_used_memory      | 0
min_used_memory      | 0
db_name              | testdb
db_id                | 17382
3.6 通过数据库系统性能视图,查询业务语句的buffer命中率。命中率只有62%
sql
gaussdb=# select sum(n_blocks_hit)/sum(n_blocks_fetched) from dbe_perf.summary_statement where user_name='tester';
-[ RECORD 1 ]-------------------
?column? | .62482625778419848749
3.7 查看当前shared_buffers参数值。
sql
gaussdb=# show shared_buffers;
-[ RECORD 1 ]--+----
shared_buffers | 1MB
3.8 调整shared_buffers参数。
sql
[Ruby@gs01 run]$ gs_guc reload -Z datanode -N all -I all -c "shared_buffers=4096"
The gs_guc run with the following arguments: [gs_guc -Z datanode -N all -I all -c shared_buffers=4096 reload ].
Begin to perform the total nodes: 1.
Popen count is 1, Popen success count is 1, Popen failure count is 0.
Begin to perform gs_guc for datanodes.
Command count is 1, Command success count is 1, Command failure count is 0.

Total instances: 1. Failed instances: 0.
ALL: Success to perform gs_guc!


[Ruby@gs01 run]$ cm_ctl stop && cm_ctl start
cm_ctl: stop cluster.
cm_ctl: stop nodeid: 1
cm_ctl: check node status take 0 seconds.
.
cm_ctl: check node status take 0 seconds.
.
cm_ctl: check node status take 0 seconds.
.
cm_ctl: check node status take 0 seconds.
.
cm_ctl: check node status take 0 seconds.
.
cm_ctl: check node status take 0 seconds.
.
cm_ctl: check node status take 0 seconds.
.
cm_ctl: check node status take 1 seconds.
.
cm_ctl: check node status take 0 seconds.
.
cm_ctl: check node status take 0 seconds.
.
cm_ctl: check node status take 0 seconds.
..
cm_ctl: check node status take 0 seconds.
.
cm_ctl: check node status take 0 seconds.
.
cm_ctl: stop cluster successfully.
cm_ctl: checking cluster status.
cm_ctl: check node status take 0 seconds.
cm_ctl: start cluster.
cm_ctl: start nodeid: 1
...............
cm_ctl: start cluster successfully.
[Ruby@gs01 run]$
[Ruby@gs01 run]$
[Ruby@gs01 run]$ gsql -d postgres -p 8000 -r
gsql ((GaussDB Kernel 505.2.1.SPC0800 build 85996fbb) compiled at 2025-07-03 01:15:58 commit 10558 last mr 24271 release)
Non-SSL connection (SSL connection is recommended when requiring high-security)
Type "help" for help.

gaussdb=# show shared_buffers;
 shared_buffers
----------------
 32MB
(1 row)
3.9 清理性能视图数据。
sql
gaussdb=# select reset_unique_sql('GLOBAL','ALL',0);
 reset_unique_sql
------------------
 t
(1 row)
3.10 在实验桌面重新执行TPCC,模拟业务压测。
sql
cd /data/benchmark/benchmark/run

./runBenchmark.sh props.pg
3.11 使用管理员root连接实验GaussDB实例。
sql
gsql -d postgres -p 8000 -r3.12 通过数据库系统性能视图,查询业务语句的buffer命中率。此时命中率提升到91%
sql
gaussdb=# select sum(n_blocks_hit)/sum(n_blocks_fetched) from dbe_perf.summary_statement where user_name='tester';
       ?column?
-----------------------
 .91463830219186624033
(1 row)
4.磁盘调度策略调优实验
4.1 查看磁盘名称。
sql
[root@gs01 run]# lsblk
NAME   MAJ:MIN RM   SIZE RO TYPE MOUNTPOINT
sda      8:0    0   130G  0 disk
├─sda1   8:1    0   256M  0 part /boot
└─sda2   8:2    0 129.7G  0 part /
sr0     11:0    1   4.3G  0 rom  /run/media/root/Kylin-Server-10
[root@gs01 run]#
4.2 查看数据盘的磁盘调度策略。
sql
[root@gs01 run]# cat /sys/block/sda/queue/scheduler
[mq-deadline] kyber bfq none
[root@gs01 run]#
4.3 修改磁盘调度策略为bfq。
sql
[root@gs01 run]# echo 'bfq' > /sys/block/sda/queue/scheduler
[root@gs01 run]# cat /sys/block/sda/queue/scheduler
mq-deadline kyber [bfq] none
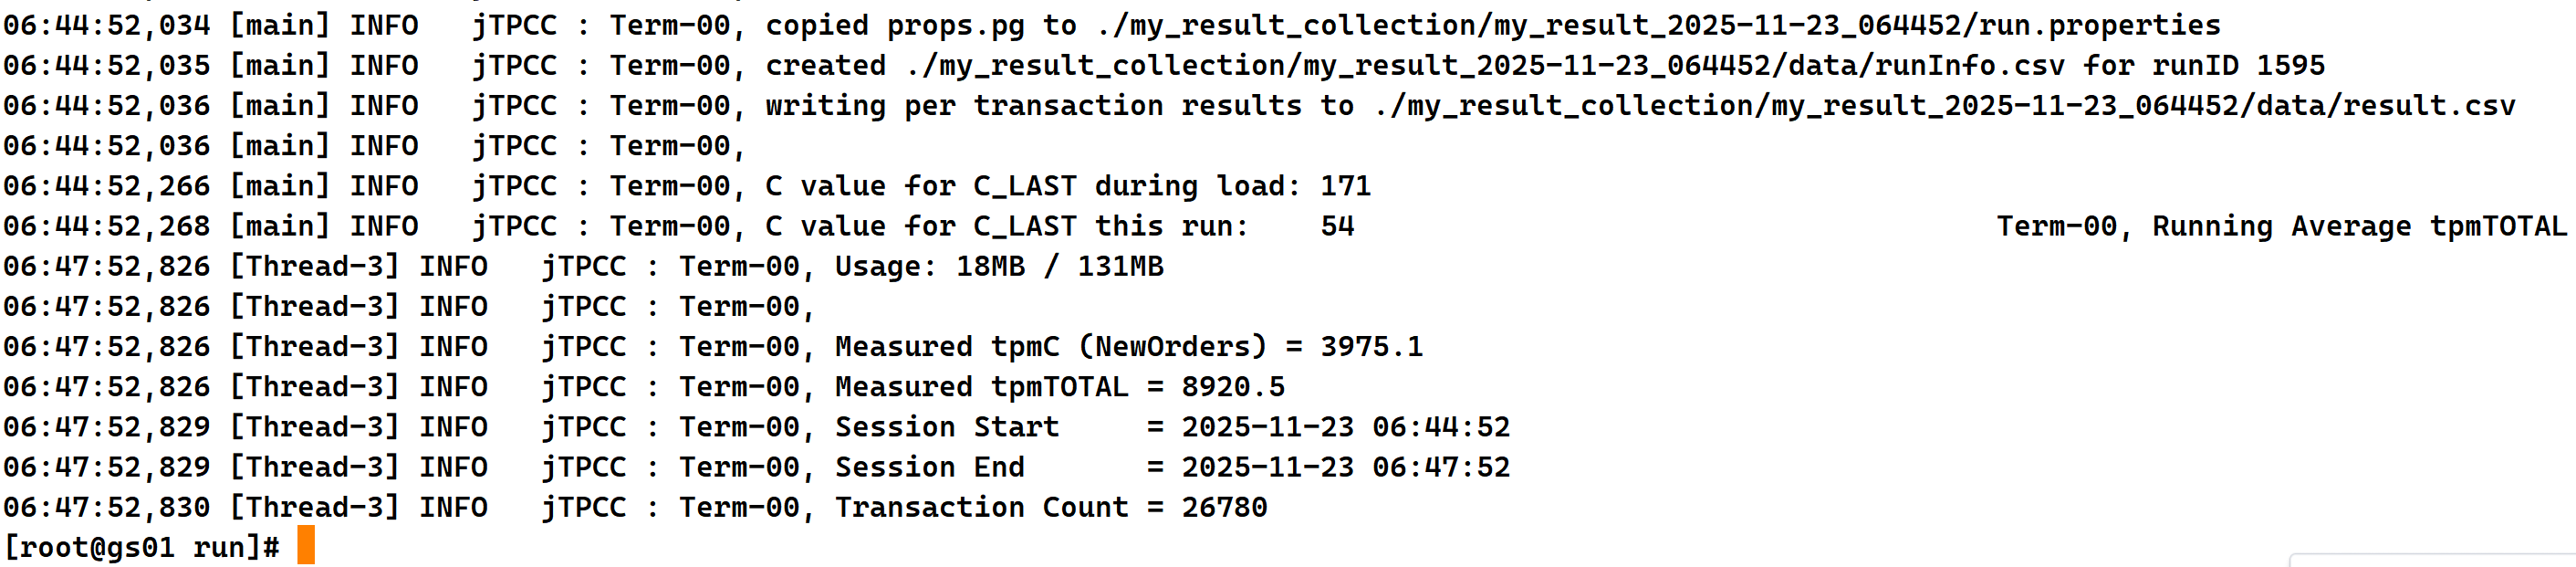
[root@gs01 run]#4.4 拉起TPCC业务,进行业务压测。
sql
cd /data/benchmark/benchmark/run

./runBenchmark.sh props.pg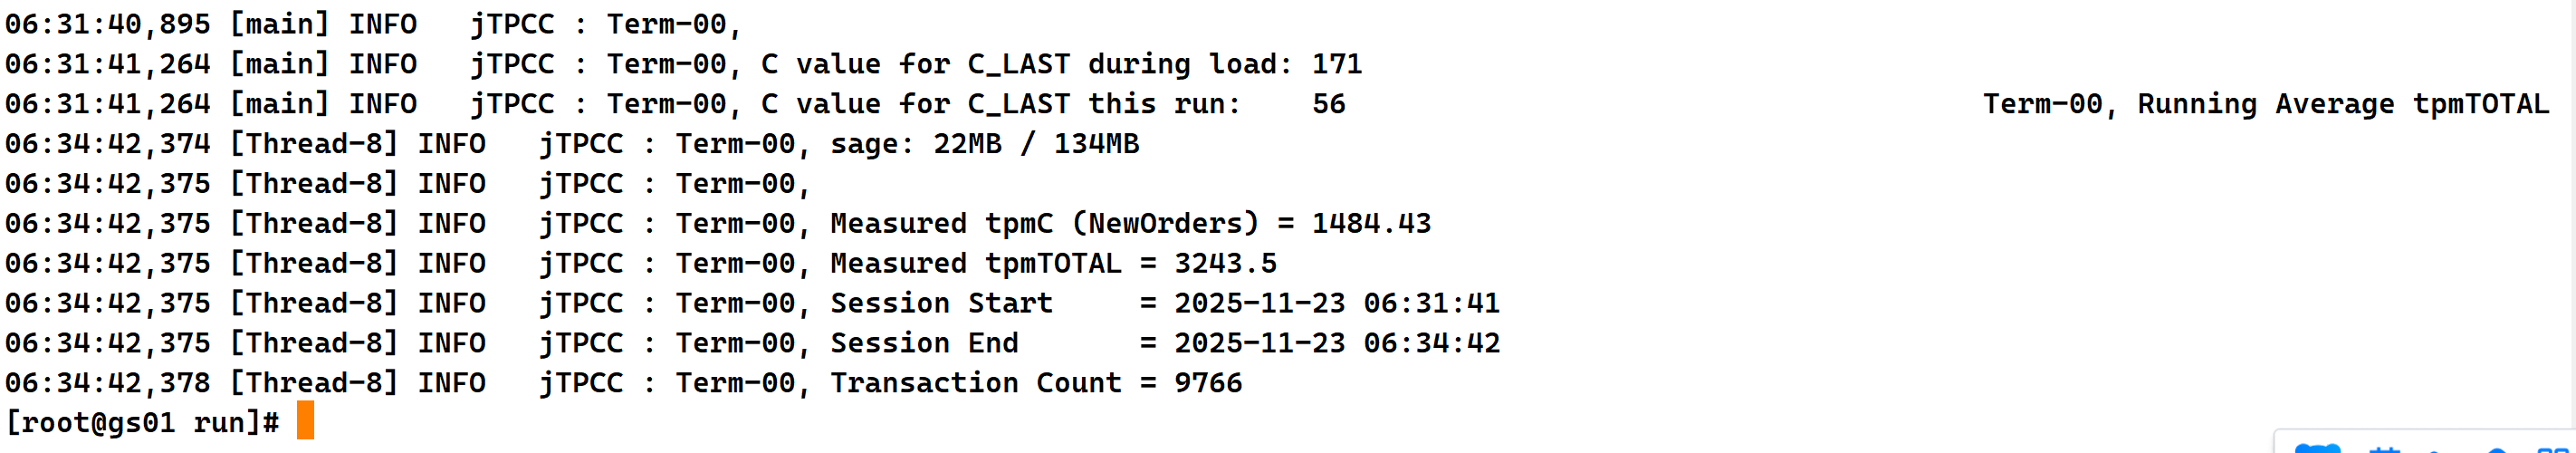
TPCC压测性能只有1484。
4.5 在数据库主DN服务器上使用如下命令安装io监控工具。
sql
yum install sysstat -y4.6 压测期间,通过如下命令观测数据库主DN服务器的磁盘使用情况。
sql
iostat -xm 2
4.7 修改数据库节点的磁盘调度策略为mq-deadline。
sql
[root@gs01 run]# echo 'mq-deadline' > /sys/block/sda/queue/scheduler
[root@gs01 run]# cat /sys/block/sda/queue/scheduler
[mq-deadline] kyber bfq none
[root@gs01 run]#
4.8 修改完成后,在实验桌面重新进行TPCC压测。
sql
cd /data/benchmark/benchmark/run

./runBenchmark.sh props.pg
4.9 压测期间观测磁盘的读写时延。
sql
iostat -xm 2
TPCC压测性能提升到3975 tpmC。
5.WAL日志参数调优实验
本实验通过调整xlog日志预扩的参数,帮助实验者了解该参数对数据库性能的影响。
帮助实验者了解advance_xlog_file_num和wal_file_init_num两个参数对性能的影响。
5.1 拉起TPCC业务,进行业务压测。
sql
cd /data/benchmark/benchmark/run

./runBenchmark.sh props.pg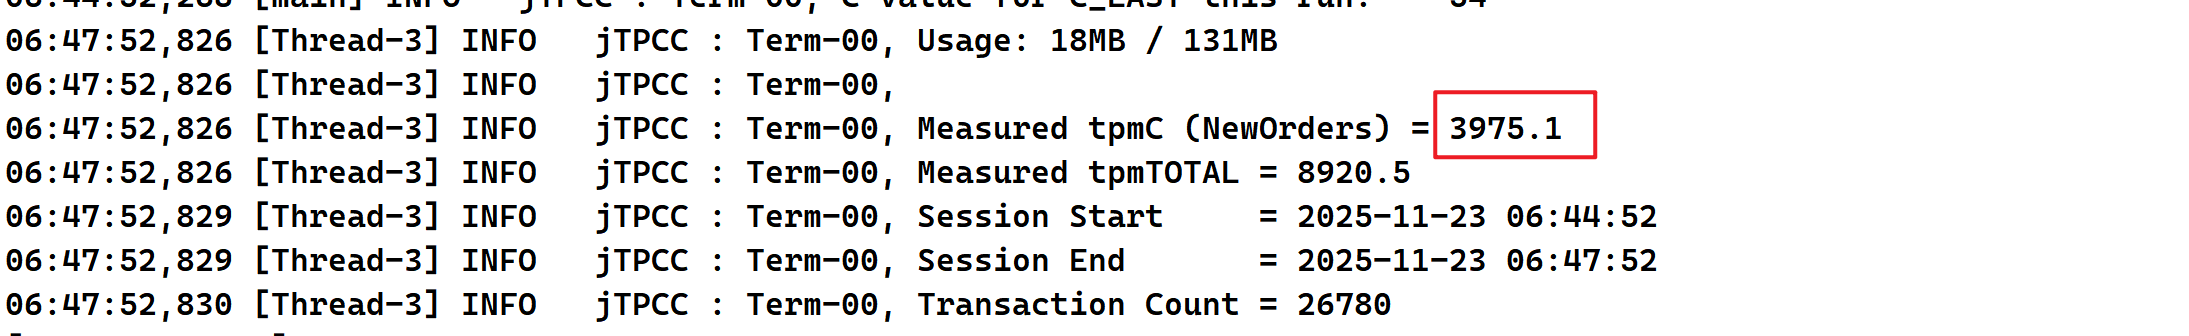
TPCC压测性能提升到3975 tpmC。
5.2 查看advance_xlog_file_num数据库参数。
sql
[Ruby@gs01 ~]$ gsql -d postgres -p 8000 -r
gsql ((GaussDB Kernel 505.2.1.SPC0800 build 85996fbb) compiled at 2025-07-03 01:15:58 commit 10558 last mr 24271 release)
Non-SSL connection (SSL connection is recommended when requiring high-security)
Type "help" for help.

gaussdb=# show advance_xlog_file_num;
 advance_xlog_file_num
-----------------------
 0
(1 row)

gaussdb=# show wal_file_init_num;
 wal_file_init_num
-------------------
 10
(1 row)
5.3 修改数据库参数。
sql
gs_guc reload -Z datanode -N all -I all -c "advance_xlog_file_num=100"

gs_guc reload -Z datanode -N all -I all -c "wal_file_init_num=20"

cm_ctl stop && cm_ctl start
5.4 再次确认参数是否修改成功。
sql
[Ruby@gs01 ~]$ gsql -d postgres -p 8000 -r
gsql ((GaussDB Kernel 505.2.1.SPC0800 build 85996fbb) compiled at 2025-07-03 01:15:58 commit 10558 last mr 24271 release)
Non-SSL connection (SSL connection is recommended when requiring high-security)
Type "help" for help.

gaussdb=# show wal_file_init_num;
 wal_file_init_num
-------------------
 20
(1 row)

gaussdb=# show advance_xlog_file_num;
 advance_xlog_file_num
-----------------------
 100
(1 row)
5.5 数据库重启完成后在实验桌面重新运行TPCC,进行预热。
sql
./runBenchmark.sh props.pg5.6 TPCC执行结束后,等1分钟,完成xlog日志预扩,重新拉起TPCC 业务进行压测。
sql
./runBenchmark.sh props.pg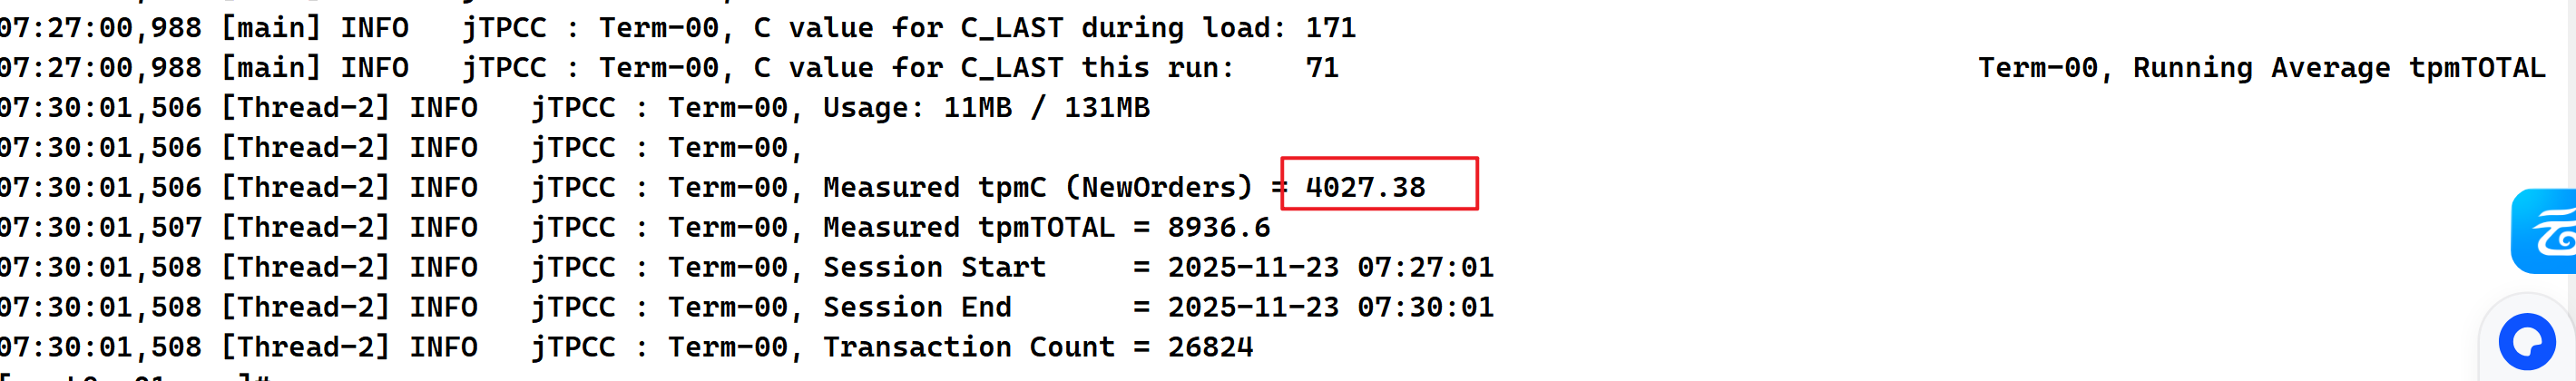
数据库性能比之前提升了一些。