卫星数据可视化分析
下面我将从架构设计、功能模块、技术实现等角度详细分析这段卫星数据可视化分析平台的代码。
1. 项目概述
这段代码构建了一个基于Streamlit的卫星数据多维可视化分析仪表盘,用于加载、处理和可视化卫星轨道数据。平台采用模块化设计,包含数据加载、预处理、交互筛选和多维度分析等功能。
核心技术栈:
-
Streamlit:用于构建Web应用界面和交互组件
-
Plotly:生成交互式可视化图表
-
Pandas:数据处理和分析
-
NumPy:数值计算
代码通过st.set_page_config设置了页面标题、图标和布局模式,使用宽屏布局(layout="wide")以最大化展示空间。
2. 数据加载与缓存机制
2.1 数据加载函数
@st.cache_data
def load_local_data():
    """从本地CSV文件加载卫星数据"""
file_path = r"D:\daku\卫星数据可视化\satcat.csv"-
使用
@st.cache_data装饰器实现数据缓存,避免每次交互时重新加载数据,提升性能 -
采用绝对路径直接指定数据文件位置,并包含完整的错误处理机制
2.2 缓存策略解析
缓存机制是Streamlit应用性能优化的关键,它确保即使代码重新执行(如用户交互时),数据加载和计算密集型操作也不会重复进行。这种设计对于处理可能包含数千条记录的大型卫星数据集尤为重要。
3. 数据预处理
preprocess_data函数实现了完整的数据清洗和特征工程流程:
3.1 日期时间处理
-
将
LAUNCH_DATE和DECAY_DATE转换为datetime对象 -
提取发射年份并计算年代信息(
LAUNCH_DECADE) -
计算轨道寿命天数(
ORBITAL_LIFETIME_DAYS)
3.2 数值数据清洗
# 处理数值列的NaN值
numeric_cols = ['PERIOD', 'INCLINATION', 'APOGEE', 'PERIGEE', 'RCS']
for col in numeric_cols:
    if col in df.columns:
df[col] = pd.to_numeric(df[col], errors='coerce')-
对关键轨道参数进行类型转换和缺失值处理
-
RCS(雷达散射截面)的NaN值填充为0,其他参数使用中位数填充
3.3 分类特征工程
-
创建轨道高度分类(
ORBIT_HEIGHT_CLASS):根据远地点高度划分为低轨道(LEO)、中轨道(MEO)和高轨道(HEO/GEO) -
基于状态代码(
OPS_STATUS_CODE)生成卫星状态(STATUS)
这种系统化的预处理确保了数据质量,为后续可视化分析奠定了坚实基础。
4. 交互设计
4.1 侧边栏筛选面板
代码使用st.sidebar创建了一个功能丰富的筛选面板:
-
年份范围滑块:动态过滤发射时间范围
-
国家/机构下拉选择:按卫星所有者筛选
-
轨道类型选择:按轨道分类筛选
year_range = st.sidebar.slider(
"选择发射年份范围",
min_value=min_year,
max_value=max_year,
value=(min_year, max_year)
)
筛选结果实时更新数据概览指标(总卫星数量、在轨运行数、已失效数),提供即时反馈。
4.2 标签页导航布局
平台采用st.tabs创建六维度分析视图:
-
时间趋势分析 - 发射数量随时间变化
-
国家分析 - 各国航天活动对比
-
轨道分析 - 轨道参数分布
-
发射场分析 - 发射场地统计
-
多维度对比 - 综合参数关系
-
数据详情 - 原始数据浏览导出
这种标签页设计有效组织了复杂信息,避免了界面拥挤。
5. 可视化分析模块
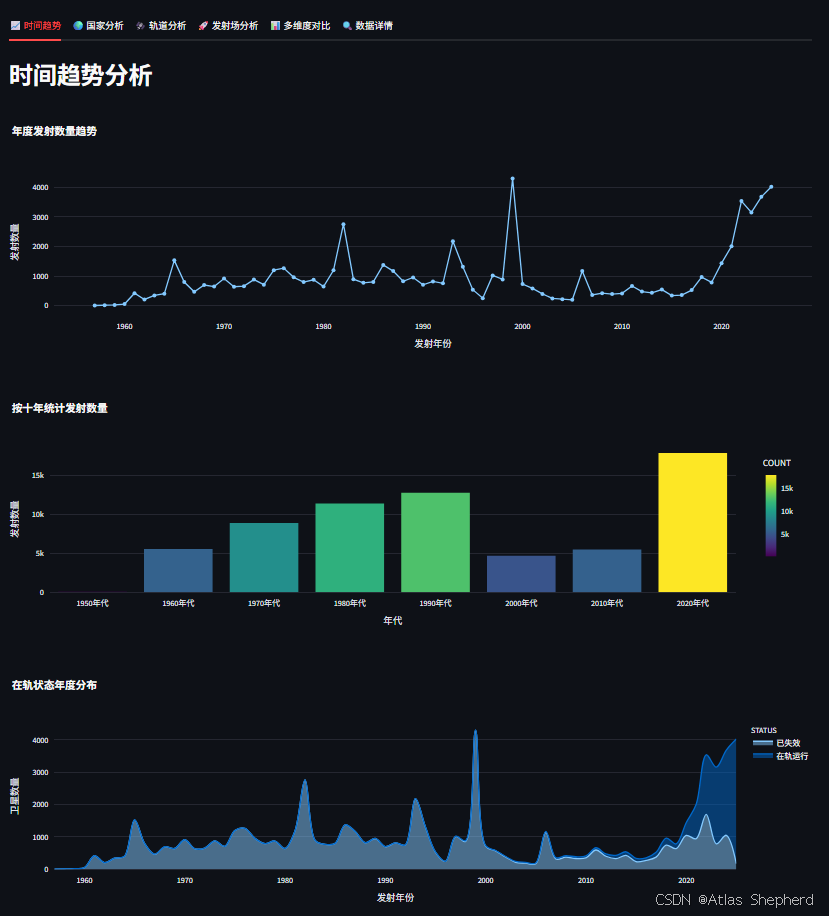
5.1 时间趋势分析(Tab1)
-
折线图:展示年度发射数量趋势,反映航天活动周期性
-
柱状图:按年代聚合发射数量,显示长期发展态势
-
面积图:分类展示在轨状态随时间变化,体现卫星寿命分布
这些时间序列可视化有助于分析航天事业的发展轨迹和历史里程碑事件。
5.2 国家/机构分析(Tab2)
-
条形图:比较各国卫星发射数量,显示航天实力对比
-
旭日图 (
sunburst):分层展示各国卫星状态分布 -
树图 (
treemap):可视化各国轨道类型偏好fig5 = px.sunburst(
country_status,
path=['OWNER', 'STATUS'], # 分层路径
values='COUNT',
title='各国卫星在轨状态分布',
color='COUNT',
color_continuous_scale='RdBu'
)
旭日图能够清晰呈现数据的层次结构,显示部分与整体的关系。
5.3 轨道参数分析(Tab3)
-
饼图:轨道类型比例分布
-
极坐标散点图:轨道高度与倾角关系,适合展示轨道特征
-
散点图:远地点与近地点关系,气泡大小表示轨道周期
极坐标系统非常适合展示轨道参数,因为轨道力学本身具有强烈的角度和距离特征。
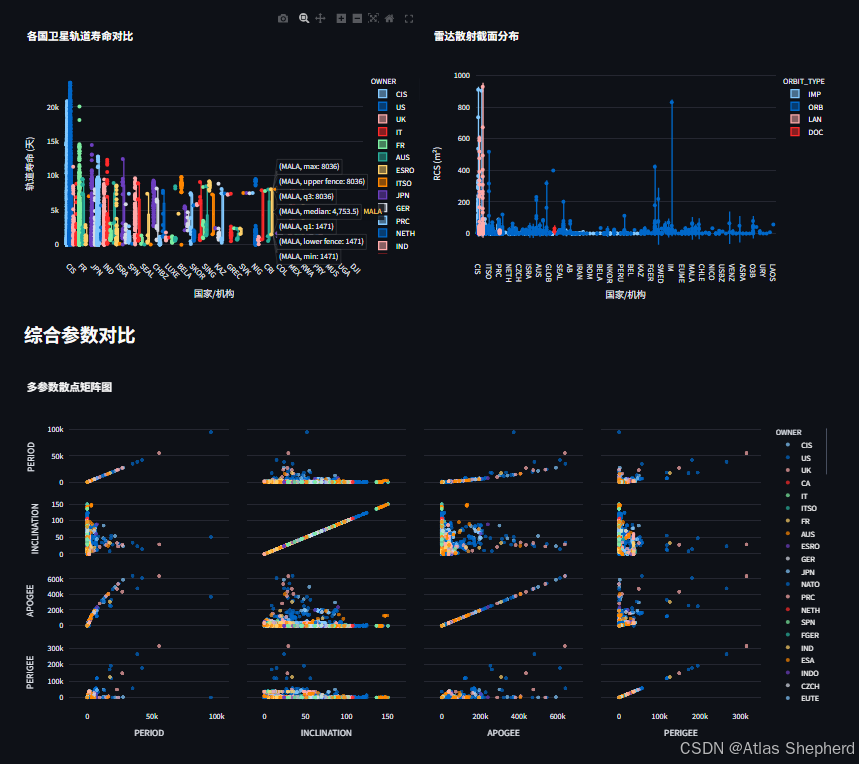
5.4 高级可视化技巧
代码中使用了多种Plotly高级图表类型:
-
散点矩阵图(Tab5):探索多个数值变量间的关系
-
小提琴图:展示RCS值的分布概率密度
-
热力图:发射场-国家关联关系可视化
这些多样化可视化技术从不同角度揭示了卫星数据的复杂模式和关联。
6. 交互功能
6.1 响应式设计
所有图表均支持Plotly的交互功能:
-
鼠标悬停显示详细数据点信息
-
缩放、平移和图表重置
-
数据序列显示/隐藏控制
6.2 数据导出功能
在"数据详情"标签页中,用户可:
-
浏览筛选后的详细数据表格
-
查看关键统计指标摘要
-
下载当前筛选条件下的CSV数据
st.download_button(
label="📥 下载筛选后数据 (CSV)",
data=csv_data,
file_name=f"satellite_data_{datetime.now().strftime('%Y%m%d_%H%M%S')}.csv"
)
导出功能增强了工具的实用性,支持进一步离线分析。
7. 代码结构与设计模式
7.1 模块化设计
代码采用函数式编程理念,将主要功能封装为独立函数:
-
load_local_data():数据加载 -
preprocess_data():数据预处理 -
各可视化模块相互独立
这种设计提高了代码可读性和可维护性,便于功能扩展。
7.2 错误处理与鲁棒性
代码包含全面的数据检查机制:
if df.empty:
    st.error("未能加载数据,请检查数据文件路径和格式")
    st.stop()
在每个可视化模块前检查数据可用性,避免运行时错误,提供友好的用户提示。
7.3 性能优化策略
-
智能缓存 :通过
@st.cache_data避免重复计算 -
条件渲染:仅在数据可用时创建图表
-
数据子集:可视化时只使用必要字段
8. 完整代码
import streamlit as st
import pandas as pd
import plotly.express as px
import plotly.graph_objects as go
import numpy as np
from datetime import datetime
import warnings
import os
warnings.filterwarnings('ignore')
# 设置页面配置
st.set_page_config(
page_title="卫星数据可视化分析平台",
page_icon="🛰️",
layout="wide",
initial_sidebar_state="expanded"
)
# 标题和描述
st.title("🛰️ 卫星数据多维可视化分析仪表盘")
st.markdown("---")
# 从本地文件加载数据
@st.cache_data
def load_local_data():
"""从本地CSV文件加载卫星数据"""
file_path = r"D:\daku\卫星数据可视化\satcat.csv"
if os.path.exists(file_path):
try:
# 尝试读取CSV文件
df = pd.read_csv(file_path, encoding='utf-8')
st.sidebar.success(f"已从本地文件加载 {len(df)} 条卫星数据记录")
return df
except Exception as e:
st.sidebar.error(f"读取本地文件失败: {str(e)}")
return pd.DataFrame() # 返回空的DataFrame
else:
st.sidebar.error(f"本地文件不存在: {file_path}")
return pd.DataFrame() # 返回空的DataFrame
# 加载数据
df = load_local_data()
# 检查是否成功加载数据
if df.empty:
st.error("未能加载数据,请检查数据文件路径和格式")
st.stop()
# 数据预处理
def preprocess_data(df):
"""数据预处理"""
df = df.copy()
# 转换日期列
date_columns = ['LAUNCH_DATE', 'DECAY_DATE']
for col in date_columns:
if col in df.columns:
df[col] = pd.to_datetime(df[col], errors='coerce')
# 提取发射年份
if 'LAUNCH_DATE' in df.columns:
df['LAUNCH_YEAR'] = df['LAUNCH_DATE'].dt.year
df['LAUNCH_DECADE'] = (df['LAUNCH_YEAR'] // 10) * 10
# 计算轨道寿命(天)
if 'DECAY_DATE' in df.columns and 'LAUNCH_DATE' in df.columns:
df['ORBITAL_LIFETIME_DAYS'] = (df['DECAY_DATE'] - df['LAUNCH_DATE']).dt.days
df['ORBITAL_LIFETIME_DAYS'] = df['ORBITAL_LIFETIME_DAYS'].fillna(0)
# 处理数值列的NaN值
numeric_cols = ['PERIOD', 'INCLINATION', 'APOGEE', 'PERIGEE', 'RCS']
for col in numeric_cols:
if col in df.columns:
df[col] = pd.to_numeric(df[col], errors='coerce')
if col == 'RCS':
df[col] = df[col].fillna(0) # RCS为0表示无数据
else:
df[col] = df[col].fillna(df[col].median() if not df[col].isnull().all() else 0)
# 处理分类列的NaN值
categorical_cols = ['OWNER', 'OBJECT_TYPE', 'ORBIT_TYPE', 'LAUNCH_SITE', 'OPS_STATUS_CODE']
for col in categorical_cols:
if col in df.columns:
df[col] = df[col].fillna('未知')
# 计算轨道高度分类
def classify_orbit_height(apogee):
if pd.isna(apogee):
return '未知'
elif apogee < 2000:
return '低轨道(LEO)'
elif apogee < 35786:
return '中轨道(MEO)'
else:
return '高轨道(HEO/GEO)'
if 'APOGEE' in df.columns:
df['ORBIT_HEIGHT_CLASS'] = df['APOGEE'].apply(classify_orbit_height)
else:
df['ORBIT_HEIGHT_CLASS'] = '未知'
# 计算在轨状态
if 'OPS_STATUS_CODE' in df.columns:
df['STATUS'] = df['OPS_STATUS_CODE'].apply(lambda x: '在轨运行' if x == '+' else '已失效')
else:
df['STATUS'] = '未知'
return df
# 预处理数据
df_processed = preprocess_data(df)
# 侧边栏
st.sidebar.title("🔧 控制面板")
st.sidebar.markdown("### 数据筛选")
# 年份范围选择
if 'LAUNCH_YEAR' in df_processed.columns and not df_processed['LAUNCH_YEAR'].isnull().all():
years = sorted(df_processed['LAUNCH_YEAR'].dropna().unique())
if len(years) > 0:
min_year, max_year = int(years[0]), int(years[-1])
else:
min_year, max_year = 1957, 2024
else:
min_year, max_year = 1957, 2024
year_range = st.sidebar.slider(
"选择发射年份范围",
min_value=min_year,
max_value=max_year,
value=(min_year, max_year)
)
# 国家/所有者筛选
if 'OWNER' in df_processed.columns:
owners = ['全部'] + sorted([str(x) for x in df_processed['OWNER'].dropna().unique().tolist()])
else:
owners = ['全部']
selected_owner = st.sidebar.selectbox("选择国家/机构", owners)
# 轨道类型筛选
if 'ORBIT_TYPE' in df_processed.columns:
orbit_types = ['全部'] + sorted([str(x) for x in df_processed['ORBIT_TYPE'].dropna().unique().tolist()])
else:
orbit_types = ['全部']
selected_orbit = st.sidebar.selectbox("选择轨道类型", orbit_types)
# 应用筛选
filtered_df = df_processed.copy()
if 'LAUNCH_YEAR' in filtered_df.columns:
filtered_df = filtered_df[
(filtered_df['LAUNCH_YEAR'] >= year_range[0]) &
(filtered_df['LAUNCH_YEAR'] <= year_range[1])
]
if selected_owner != '全部' and 'OWNER' in filtered_df.columns:
filtered_df = filtered_df[filtered_df['OWNER'] == selected_owner]
if selected_orbit != '全部' and 'ORBIT_TYPE' in filtered_df.columns:
filtered_df = filtered_df[filtered_df['ORBIT_TYPE'] == selected_orbit]
# 显示数据概览
st.sidebar.markdown("---")
st.sidebar.markdown("### 📊 数据概览")
total_count = len(filtered_df) if not filtered_df.empty else 0
active_count = len(filtered_df[filtered_df[
'STATUS'] == '在轨运行']) if not filtered_df.empty and 'STATUS' in filtered_df.columns else 0
inactive_count = len(
filtered_df[filtered_df['STATUS'] == '已失效']) if not filtered_df.empty and 'STATUS' in filtered_df.columns else 0
st.sidebar.metric("总卫星数量", total_count)
st.sidebar.metric("在轨运行", active_count)
st.sidebar.metric("已失效", inactive_count)
# 主面板
tab1, tab2, tab3, tab4, tab5, tab6 = st.tabs([
"📈 时间趋势",
"🌍 国家分析",
"🛰️ 轨道分析",
"🚀 发射场分析",
"📊 多维度对比",
"🔍 数据详情"
])
with tab1:
st.header("时间趋势分析")
# 按年份统计发射数量
if not filtered_df.empty and 'LAUNCH_YEAR' in filtered_df.columns:
yearly_launches = filtered_df.groupby('LAUNCH_YEAR').size().reset_index(name='COUNT')
if not yearly_launches.empty:
fig1 = px.line(
yearly_launches,
x='LAUNCH_YEAR',
y='COUNT',
title='年度发射数量趋势',
markers=True
)
fig1.update_layout(
xaxis_title="发射年份",
yaxis_title="发射数量",
hovermode="x unified",
height=400
)
st.plotly_chart(fig1, width='stretch')
else:
st.info("暂无年度发射数据")
else:
st.info("暂无年度发射数据")
# 按十年统计发射数量
if not filtered_df.empty and 'LAUNCH_DECADE' in filtered_df.columns:
decade_launches = filtered_df.groupby('LAUNCH_DECADE').size().reset_index(name='COUNT')
decade_launches['DECADE_LABEL'] = decade_launches['LAUNCH_DECADE'].astype(str) + '年代'
if not decade_launches.empty:
fig2 = px.bar(
decade_launches,
x='DECADE_LABEL',
y='COUNT',
title='按十年统计发射数量',
color='COUNT',
color_continuous_scale='Viridis'
)
fig2.update_layout(
xaxis_title="年代",
yaxis_title="发射数量",
height=400
)
st.plotly_chart(fig2, width='stretch')
else:
st.info("暂无按十年统计的数据")
else:
st.info("暂无按十年统计的数据")
# 在轨状态时间分布
if not filtered_df.empty and 'LAUNCH_YEAR' in filtered_df.columns and 'STATUS' in filtered_df.columns:
status_by_year = filtered_df.groupby(['LAUNCH_YEAR', 'STATUS']).size().reset_index(name='COUNT')
if not status_by_year.empty:
fig3 = px.area(
status_by_year,
x='LAUNCH_YEAR',
y='COUNT',
color='STATUS',
title='在轨状态年度分布',
line_shape='spline'
)
fig3.update_layout(
xaxis_title="发射年份",
yaxis_title="卫星数量",
hovermode="x unified",
height=400
)
st.plotly_chart(fig3, width='stretch')
else:
st.info("暂无在轨状态时间分布数据")
else:
st.info("暂无在轨状态时间分布数据")
with tab2:
st.header("国家/机构分析")
col1, col2 = st.columns(2)
with col1:
# 各国发射数量统计
if not filtered_df.empty and 'OWNER' in filtered_df.columns:
country_launches = filtered_df.groupby('OWNER').size().reset_index(name='COUNT').sort_values('COUNT',
ascending=False)
if not country_launches.empty:
fig4 = px.bar(
country_launches,
x='OWNER',
y='COUNT',
title='各国/机构发射数量统计',
color='COUNT',
color_continuous_scale='Plasma',
text='COUNT'
)
fig4.update_layout(
xaxis_title="国家/机构",
yaxis_title="发射数量",
xaxis_tickangle=45
)
fig4.update_traces(textposition='outside')
st.plotly_chart(fig4, width='stretch')
else:
st.info("暂无国家/机构发射数据")
else:
st.info("暂无国家/机构发射数据")
with col2:
# 各国在轨状态统计
if not filtered_df.empty and 'OWNER' in filtered_df.columns and 'STATUS' in filtered_df.columns:
country_status = filtered_df.groupby(['OWNER', 'STATUS']).size().reset_index(name='COUNT')
if not country_status.empty and country_status['COUNT'].sum() > 0:
# 确保COUNT列没有NaN或0值
country_status = country_status[country_status['COUNT'] > 0]
if not country_status.empty:
fig5 = px.sunburst(
country_status,
path=['OWNER', 'STATUS'],
values='COUNT',
title='各国卫星在轨状态分布',
color='COUNT',
color_continuous_scale='RdBu'
)
fig5.update_layout(margin=dict(t=30, l=0, r=0, b=0))
st.plotly_chart(fig5, width='stretch')
else:
st.info("暂无有效的在轨状态数据")
else:
st.info("暂无在轨状态数据")
else:
st.info("暂无在轨状态数据")
# 各国轨道类型分布
st.subheader("各国轨道类型分布")
if not filtered_df.empty and 'OWNER' in filtered_df.columns and 'ORBIT_TYPE' in filtered_df.columns:
country_orbit = filtered_df.groupby(['OWNER', 'ORBIT_TYPE']).size().reset_index(name='COUNT')
if not country_orbit.empty and country_orbit['COUNT'].sum() > 0:
fig6 = px.treemap(
country_orbit,
path=['OWNER', 'ORBIT_TYPE'],
values='COUNT',
title='各国轨道类型分布',
color='COUNT',
color_continuous_scale='Tealrose'
)
fig6.update_layout(margin=dict(t=30, l=0, r=0, b=0))
st.plotly_chart(fig6, width='stretch')
else:
st.info("暂无轨道类型分布数据")
else:
st.info("暂无轨道类型分布数据")
with tab3:
st.header("轨道参数分析")
col1, col2 = st.columns(2)
with col1:
# 轨道类型分布
if not filtered_df.empty and 'ORBIT_TYPE' in filtered_df.columns:
orbit_type_dist = filtered_df['ORBIT_TYPE'].value_counts().reset_index()
orbit_type_dist.columns = ['ORBIT_TYPE', 'COUNT']
if not orbit_type_dist.empty:
fig7 = px.pie(
orbit_type_dist,
values='COUNT',
names='ORBIT_TYPE',
title='轨道类型分布',
hole=0.3
)
fig7.update_traces(textposition='inside', textinfo='percent+label')
st.plotly_chart(fig7, width='stretch')
else:
st.info("暂无轨道类型数据")
else:
st.info("暂无轨道类型数据")
with col2:
# 轨道高度与倾角分布
if not filtered_df.empty and 'APOGEE' in filtered_df.columns and 'INCLINATION' in filtered_df.columns and 'ORBIT_TYPE' in filtered_df.columns:
# 清理数据,移除NaN值
scatter_data = filtered_df[['APOGEE', 'INCLINATION', 'ORBIT_TYPE']].dropna()
if not scatter_data.empty:
fig8 = px.scatter_polar(
scatter_data,
r='APOGEE',
theta='INCLINATION',
color='ORBIT_TYPE',
title='轨道高度与倾角分布',
template="plotly_dark"
)
st.plotly_chart(fig8, width='stretch')
else:
st.info("暂无轨道高度与倾角数据")
else:
st.info("暂无轨道高度与倾角数据")
# 轨道参数散点图
st.subheader("轨道参数关系分析")
if not filtered_df.empty and 'APOGEE' in filtered_df.columns and 'PERIGEE' in filtered_df.columns and 'PERIOD' in filtered_df.columns and 'ORBIT_TYPE' in filtered_df.columns:
# 清理数据
scatter_df = filtered_df[['APOGEE', 'PERIGEE', 'PERIOD', 'ORBIT_TYPE', 'OBJECT_NAME']].dropna()
if not scatter_df.empty and (scatter_df['PERIOD'] > 0).any():
fig9 = px.scatter(
scatter_df,
x='APOGEE',
y='PERIGEE',
color='ORBIT_TYPE',
size='PERIOD',
hover_name='OBJECT_NAME',
title='远地点与近地点关系',
labels={
'APOGEE': '远地点高度 (km)',
'PERIGEE': '近地点高度 (km)',
'PERIOD': '轨道周期 (min)'
}
)
fig9.update_layout(
xaxis_title="远地点高度 (km)",
yaxis_title="近地点高度 (km)",
height=500
)
st.plotly_chart(fig9, width='stretch')
else:
# 如果没有有效的PERIOD数据,不使用size参数
fig9 = px.scatter(
scatter_df,
x='APOGEE',
y='PERIGEE',
color='ORBIT_TYPE',
hover_name='OBJECT_NAME',
title='远地点与近地点关系',
labels={
'APOGEE': '远地点高度 (km)',
'PERIGEE': '近地点高度 (km)'
}
)
fig9.update_layout(
xaxis_title="远地点高度 (km)",
yaxis_title="近地点高度 (km)",
height=500
)
st.plotly_chart(fig9, width='stretch')
else:
st.info("暂无轨道参数数据")
with tab4:
st.header("发射场分析")
if not filtered_df.empty and 'LAUNCH_SITE' in filtered_df.columns:
# 发射场统计
launch_site_stats = filtered_df['LAUNCH_SITE'].value_counts().reset_index()
launch_site_stats.columns = ['LAUNCH_SITE', 'COUNT']
col1, col2 = st.columns([2, 1])
with col1:
if not launch_site_stats.empty:
fig10 = px.bar(
launch_site_stats,
x='LAUNCH_SITE',
y='COUNT',
title='各发射场发射数量统计',
color='COUNT',
color_continuous_scale='Rainbow',
text='COUNT'
)
fig10.update_layout(
xaxis_title="发射场",
yaxis_title="发射数量",
xaxis_tickangle=45
)
fig10.update_traces(textposition='outside')
st.plotly_chart(fig10, width='stretch')
else:
st.info("暂无发射场数据")
with col2:
# 发射场效率矩阵
if not launch_site_stats.empty:
st.metric("发射场数量", len(launch_site_stats))
avg_per_site = launch_site_stats['COUNT'].mean()
st.metric("平均发射数量", f"{avg_per_site:.1f}")
max_site = launch_site_stats.iloc[0]
st.metric("最活跃发射场", f"{max_site['LAUNCH_SITE']}: {max_site['COUNT']}")
else:
st.info("暂无发射场统计信息")
# 发射场与国家关系
st.subheader("发射场与国家关系")
if 'OWNER' in filtered_df.columns:
site_country = filtered_df.groupby(['LAUNCH_SITE', 'OWNER']).size().reset_index(name='COUNT')
if not site_country.empty:
fig11 = px.density_heatmap(
site_country,
x='LAUNCH_SITE',
y='OWNER',
z='COUNT',
title='发射场-国家发射热力图',
color_continuous_scale='YlOrRd'
)
fig11.update_layout(
xaxis_title="发射场",
yaxis_title="国家/机构"
)
st.plotly_chart(fig11, width='stretch')
else:
st.info("暂无发射场-国家关系数据")
else:
st.info("暂无发射场-国家关系数据")
else:
st.info("暂无发射场数据")
with tab5:
st.header("多维度对比分析")
col1, col2 = st.columns(2)
with col1:
# 轨道寿命分析
if not filtered_df.empty and 'ORBITAL_LIFETIME_DAYS' in filtered_df.columns and 'OWNER' in filtered_df.columns:
orbital_lifetime = filtered_df[filtered_df['ORBITAL_LIFETIME_DAYS'] > 0]
if not orbital_lifetime.empty and len(orbital_lifetime['OWNER'].unique()) > 0:
fig12 = px.box(
orbital_lifetime,
x='OWNER',
y='ORBITAL_LIFETIME_DAYS',
title='各国卫星轨道寿命对比',
points='all',
color='OWNER'
)
fig12.update_layout(
xaxis_title="国家/机构",
yaxis_title="轨道寿命 (天)",
xaxis_tickangle=45
)
st.plotly_chart(fig12, width='stretch')
else:
st.info("暂无轨道寿命数据")
else:
st.info("暂无轨道寿命数据")
with col2:
# 雷达散射截面分析
if not filtered_df.empty and 'RCS' in filtered_df.columns and 'OWNER' in filtered_df.columns and 'ORBIT_TYPE' in filtered_df.columns:
rcs_data = filtered_df.dropna(subset=['RCS'])
rcs_data = rcs_data[rcs_data['RCS'] > 0] # 只保留RCS>0的数据
if not rcs_data.empty and len(rcs_data['OWNER'].unique()) > 0:
fig13 = px.violin(
rcs_data,
y='RCS',
x='OWNER',
color='ORBIT_TYPE',
title='雷达散射截面分布',
box=True,
points="all"
)
fig13.update_layout(
xaxis_title="国家/机构",
yaxis_title="RCS (m²)"
)
st.plotly_chart(fig13, width='stretch')
else:
st.info("暂无RCS数据")
else:
st.info("暂无RCS数据")
# 综合对比矩阵
st.subheader("综合参数对比")
numeric_cols = ['PERIOD', 'INCLINATION', 'APOGEE', 'PERIGEE']
available_numeric_cols = [col for col in numeric_cols if col in filtered_df.columns]
if available_numeric_cols and 'OWNER' in filtered_df.columns:
numeric_df = filtered_df[available_numeric_cols + ['OWNER']].dropna()
if not numeric_df.empty and len(numeric_df) > 1:
# 确保有足够的数据点
if len(available_numeric_cols) >= 2:
fig14 = px.scatter_matrix(
numeric_df,
dimensions=available_numeric_cols,
color='OWNER',
title='多参数散点矩阵图',
opacity=0.7
)
fig14.update_layout(height=600)
st.plotly_chart(fig14, width='stretch')
else:
st.info("参数不足,无法生成散点矩阵图")
else:
st.info("暂无足够数据生成散点矩阵图")
else:
st.info("暂无足够数据生成散点矩阵图")
with tab6:
st.header("数据详情与筛选")
# 显示数据表
display_columns = ['OBJECT_NAME', 'OWNER', 'LAUNCH_DATE', 'STATUS']
if 'ORBIT_TYPE' in filtered_df.columns:
display_columns.append('ORBIT_TYPE')
if 'ORBIT_HEIGHT_CLASS' in filtered_df.columns:
display_columns.append('ORBIT_HEIGHT_CLASS')
if 'INCLINATION' in filtered_df.columns:
display_columns.append('INCLINATION')
if 'APOGEE' in filtered_df.columns:
display_columns.append('APOGEE')
if 'PERIGEE' in filtered_df.columns:
display_columns.append('PERIGEE')
if 'LAUNCH_SITE' in filtered_df.columns:
display_columns.append('LAUNCH_SITE')
if not filtered_df.empty:
display_df = filtered_df[display_columns].copy()
# 对日期列进行格式化
if 'LAUNCH_DATE' in display_df.columns:
display_df['LAUNCH_DATE'] = display_df['LAUNCH_DATE'].dt.strftime('%Y-%m-%d')
st.dataframe(
display_df.sort_values('LAUNCH_DATE' if 'LAUNCH_DATE' in display_df.columns else display_columns[0],
ascending=False),
width='stretch',
height=400
)
else:
st.info("暂无数据可显示")
# 数据统计摘要
st.subheader("数据统计摘要")
col1, col2, col3 = st.columns(3)
with col1:
st.metric("总记录数", total_count)
if not filtered_df.empty and 'LAUNCH_YEAR' in filtered_df.columns:
earliest_launch = filtered_df['LAUNCH_YEAR'].min()
st.metric("最早发射", int(earliest_launch) if not pd.isna(earliest_launch) else "N/A")
else:
st.metric("最早发射", "N/A")
if not filtered_df.empty and 'APOGEE' in filtered_df.columns:
avg_apogee = filtered_df['APOGEE'].mean()
st.metric("平均远地点", f"{avg_apogee:.0f} km" if not pd.isna(avg_apogee) else "N/A")
else:
st.metric("平均远地点", "N/A")
with col2:
st.metric("在轨运行", active_count)
if not filtered_df.empty and 'LAUNCH_YEAR' in filtered_df.columns:
latest_launch = filtered_df['LAUNCH_YEAR'].max()
st.metric("最晚发射", int(latest_launch) if not pd.isna(latest_launch) else "N/A")
else:
st.metric("最晚发射", "N/A")
if not filtered_df.empty and 'PERIGEE' in filtered_df.columns:
avg_perigee = filtered_df['PERIGEE'].mean()
st.metric("平均近地点", f"{avg_perigee:.0f} km" if not pd.isna(avg_perigee) else "N/A")
else:
st.metric("平均近地点", "N/A")
with col3:
st.metric("已失效", inactive_count)
if not filtered_df.empty and 'OWNER' in filtered_df.columns:
unique_owners = filtered_df['OWNER'].nunique()
st.metric("不同国家数", unique_owners)
else:
st.metric("不同国家数", 0)
if not filtered_df.empty and 'INCLINATION' in filtered_df.columns:
avg_inclination = filtered_df['INCLINATION'].mean()
st.metric("平均倾角", f"{avg_inclination:.1f}°" if not pd.isna(avg_inclination) else "N/A")
else:
st.metric("平均倾角", "N/A")
# 数据下载
st.subheader("数据导出")
if not filtered_df.empty:
csv_data = filtered_df.to_csv(index=False).encode('utf-8')
st.download_button(
label="📥 下载筛选后数据 (CSV)",
data=csv_data,
file_name=f"satellite_data_{datetime.now().strftime('%Y%m%d_%H%M%S')}.csv",
mime="text/csv"
)
else:
st.info("暂无数据可下载")
# 页脚
st.markdown("---")
st.markdown("""
<div style='text-align: center; color: gray;'>
<p>🛰️ 卫星数据可视化分析系统 | 数据来源: Celestrak SATCAT | 最后更新: 示例数据</p>
<p>提示: 您可以通过侧边栏筛选数据,点击图表可交互查看详细信息</p>
</div>
""", unsafe_allow_html=True)