0. 先言
建议多阅读其他相关的文章,毕竟微信小程序的坑蛮多的。
1. 引入依赖
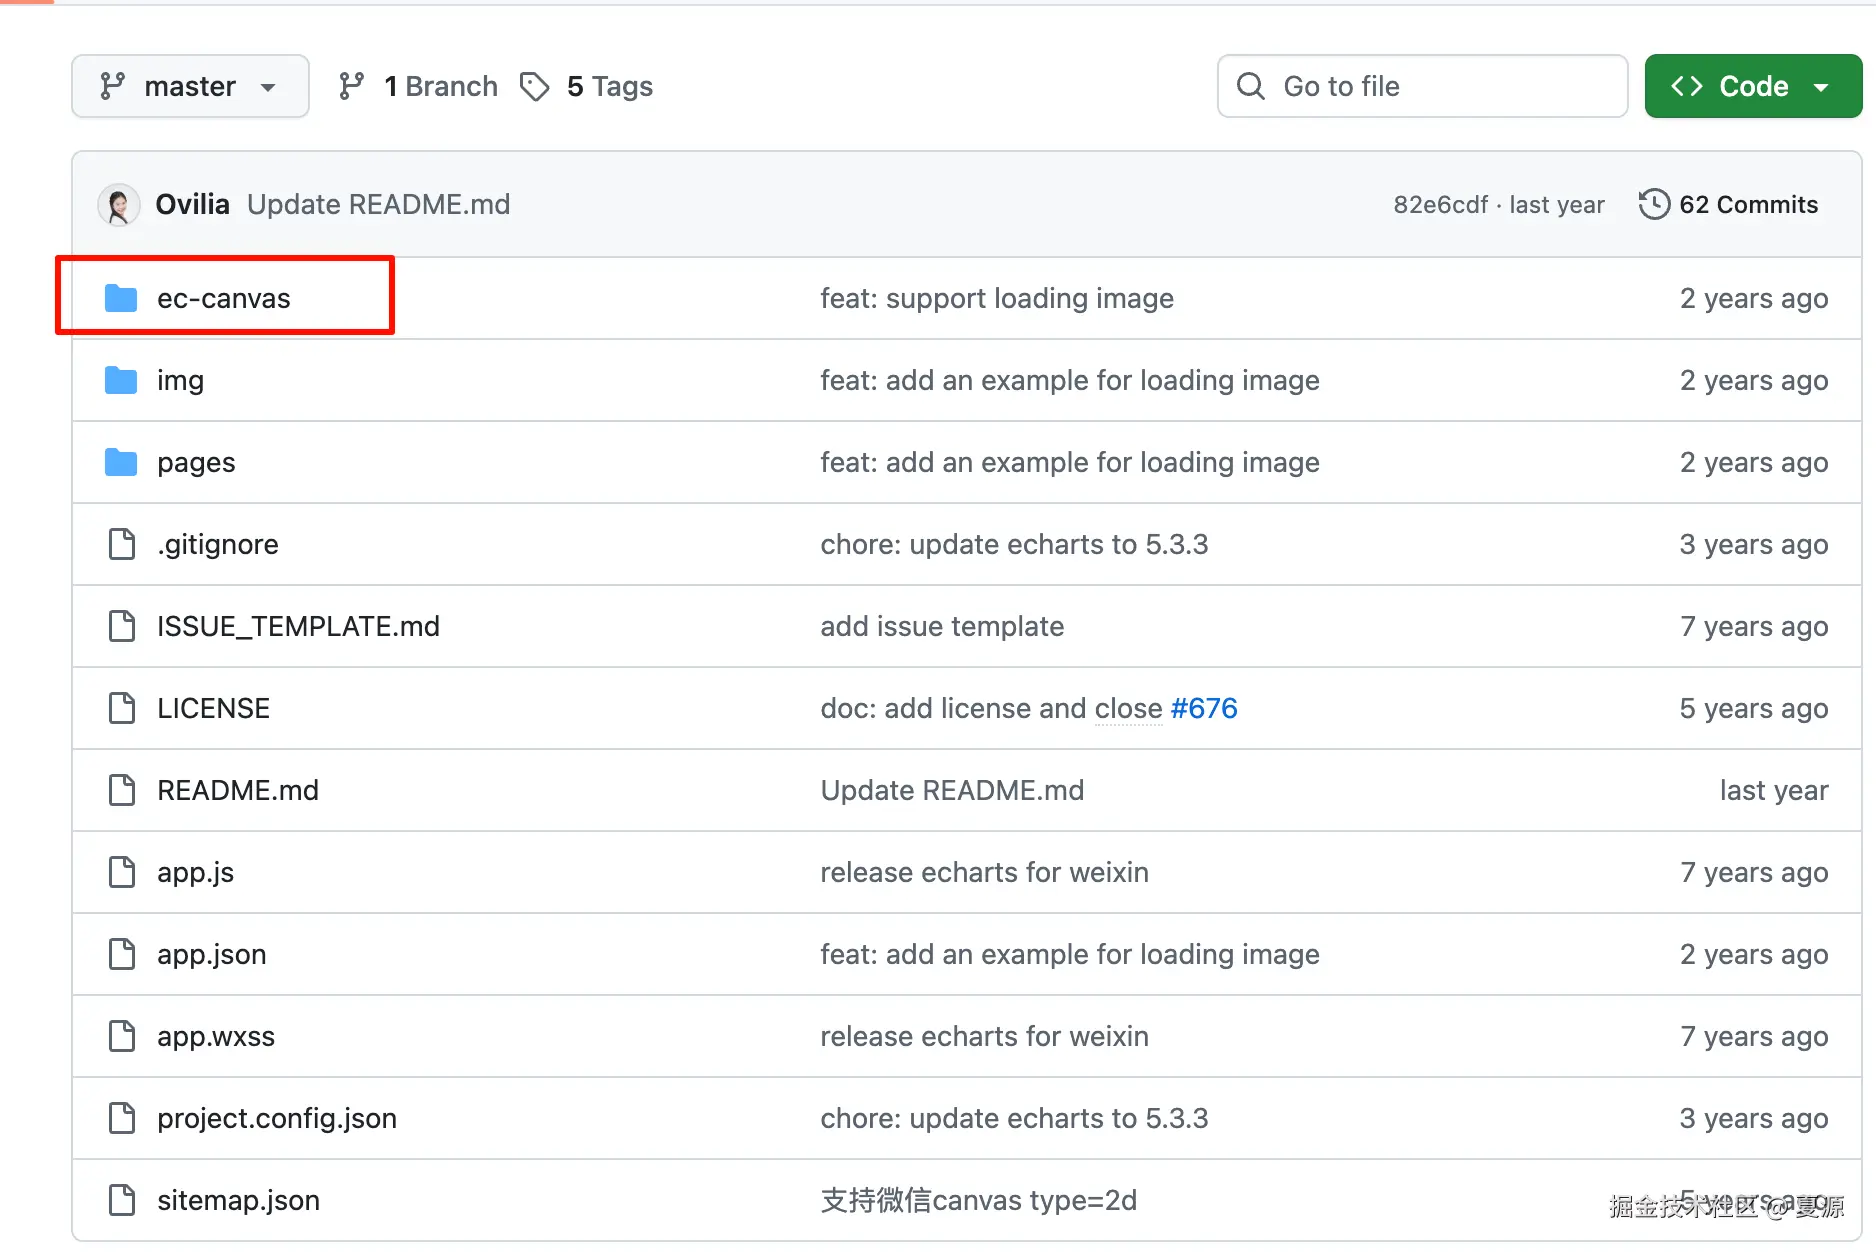
首先需要使用 echarts-for-weixi 项目,下载并解压到目录。
将其项目下的 ec-canvas 目录复制到 components 目录下。
在 pages/demo/demo.json 下引入组件
json
{
  "usingComponents": {
    "ec-canvas": "../../components/ec-canvas/ec-canvas"
  }
}
2. 代码部分
布局文件,没什么多说的。
wxml
<view class="container">
  <ec-canvas
    id="dom-chart"
    canvas-id="chart"
    ec="{{ec}}"></ec-canvas>
</view>
必须配置宽高,不然不显示。
wxss
.container {
  width: 100vw;
  min-height: 100vh;
}

#dom-chart {
  width: 100%;
  height: 200px;
}
关键代码部分(包含更新图标数据示例)
js
// 1. 引入依赖
import * as echarts from '../../components/ec-canvas/echarts';

Page({
  data: {
    ec: {
      onInit: null
    }
  },

  chart: null,
  chartData: [
    { name: '参数1', value: 1 },
    { name: '参数2', value: 2 }
  ],

  onLoad() {
    this.initChart()
  },

  // 初始化图表
  initChart() {
    this.setData({
      'ec.onInit': (canvas, width, height, dpr) => {
        const chart = echarts.init(canvas, null, {
          width,
          height,
          devicePixelRatio: dpr
        })
        canvas.setChart(chart)

        this.chart = chart

        chart.setOption(this.getOption())

        // 初始化后再更新一次数据
        this.addData({ name: '参数3', value: 3 })

        return chart
      }
    })
  },

  // 统一的 option 生成方法
  getOption() {
    return {
      tooltip: {
        trigger: 'item'
      },
      series: [
        {
          type: 'pie',
          radius: ['40%', '70%'],
          data: this.chartData
        }
      ]
    }
  },

  // 添加数据并刷新图表
  addData(item) {
    if (!this.chart) return

    this.chartData.push(item)

    this.chart.setOption({
      series: [
        {
          data: this.chartData
        }
      ]
    })
  },

  onUnload() {
    this.chart?.dispose()
    this.chart = null
  }
})
结束。