本文记录MIT-OS6.S081 Lab4 traps的Backtrace函数的实现过程
文章目录
- [1. 作业要求](#1. 作业要求)
- [2. 实现过程](#2. 实现过程)
-
- [2.1 代码实现](#2.1 代码实现)
1. 作业要求
Backtrace (moderate)
For debugging it is often useful to have a backtrace: a list of the function calls on the stack above the point at which the error occurred.
Implement a
backtrace()function inkernel/printf.c. Insert a call to this function insys_sleep, and then runbttest, which callssys_sleep. Your output should be as follows:
c
backtrace:
0x0000000080002cda
0x0000000080002bb6
0x0000000080002898
After
bttestexit qemu. In your terminal: the addresses may be slightly different but if you runaddr2line -e kernel/kernel(orriscv64-unknown-elf-addr2line -e kernel/kernel) and cut-and-paste the above addresses as follows:
c
$ addr2line -e kernel/kernel
0x0000000080002de2
0x0000000080002f4a
0x0000000080002bfc
Ctrl-D
You should see something like this:
c
kernel/sysproc.c:74
kernel/syscall.c:224
kernel/trap.c:85
The compiler puts in each stack frame a frame pointer that holds the address of the caller's frame pointer. Your
backtraceshould use these frame pointers to walk up the stack and print the saved return address in each stack frame.
Some hints:
- Add the prototype for backtrace to
kernel/defs.hso that you can invokebacktraceinsys_sleep.- The GCC compiler stores the frame pointer of the currently executing function in the register
s0. Add the following function tokernel/riscv.h:
c
static inline uint64
r_fp()
{
  uint64 x;
  asm volatile("mv %0, s0" : "=r" (x) );
  return x;
}
and call this function in
backtraceto read the current frame pointer. This function uses in-line assembly to reads0.
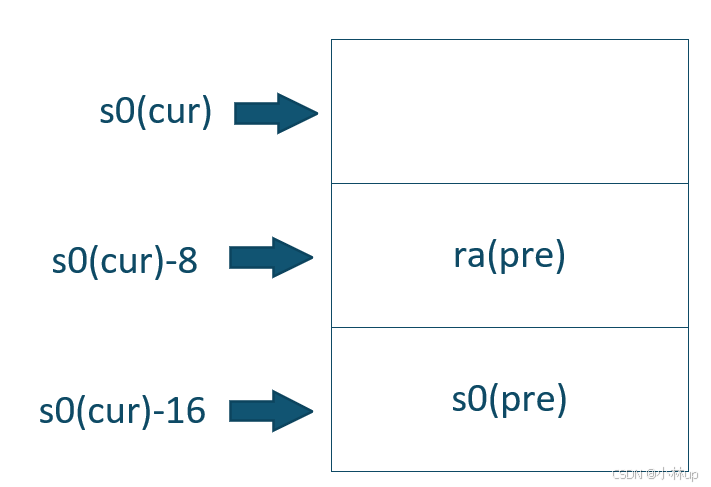
- These lecture notes have a picture of the layout of stack frames. Note that the return address lives at a fixed offset (-8) from the frame pointer of a stackframe, and that the saved frame pointer lives at fixed offset (-16) from the frame pointer.
- Xv6 allocates one page for each stack in the xv6 kernel at PAGE-aligned address. You can compute the top and bottom address of the stack page by using
PGROUNDDOWN(fp)andPGROUNDUP(fp)(seekernel/riscv.h. These number are helpful forbacktraceto terminate its loop.
Once your backtrace is working, call it frompanicinkernel/printf.cso that you see the kernel's backtrace when it panics.
2. 实现过程
2.1 代码实现
我们先看一下bttest:
c
#include "kernel/types.h"
#include "kernel/stat.h"
#include "user/user.h"

int
main(int argc, char *argv[])
{
  sleep(1);
  exit(0);
}这里调用了sleep,题目说backtrace要被插入到sleep里。
Add the prototype for backtrace to kernel/defs.h so that you can invoke backtrace in sys_sleep.
c
// printf.c
void            printf(char*, ...);
void            panic(char*) __attribute__((noreturn));
void            printfinit(void);
void            backtrace(void); // 添加在这里
The GCC compiler stores the frame pointer of the currently executing function in the register
s0. Add the following function tokernel/riscv.h
s0寄存器存放当前执行函数的frame指针。我们需要在kernel/riscv.h添加函数:
c
static inline uint64
r_fp()
{
  uint64 x;
  asm volatile("mv %0, s0" : "=r" (x) );
  return x;
}
call this function in
backtraceto read the current frame pointer. This function uses in-line assembly to reads0.
backtrace会使用上面的r_fp函数读取s0寄存器。
These lecture notes have a picture of the layout of stack frames. Note that the return address lives at a fixed offset (-8) from the frame pointer of a stackframe, and that the saved frame pointer lives at fixed offset (-16) from the frame pointer.
从这句话可以看出栈的布局
Xv6 allocates one page for each stack in the xv6 kernel at PAGE-aligned address. You can compute the top and bottom address of the stack page by using
PGROUNDDOWN(fp)andPGROUNDUP(fp)(seekernel/riscv.h. These number are helpful forbacktraceto terminate its loop.
xv6会为栈分配一页,backtrace沿着上面的内存布局不断上溯,其实是一个从低地址往高地址回溯的过程,停止的条件就是当fp超过[PGROUNDDOWN(fp), PGROUNDUP(fp))范围。
于是在printf我们很自然地可以写出backtrace:
c
void
backtrace()
{
  uint64 fp = r_fp();
  uint64 stackUp = PGROUNDUP(fp);
  uint64 stackBottom = PGROUNDDOWN(fp);
  while (fp >= stackBottom && fp < stackUp)
  {
    uint64 ra = *(uint64*)(fp - 8);
    printf("%p\n", ra);
    fp = *(uint64*)(fp - 16);
  }
}
我们测试一下:
c
make qemu
bttest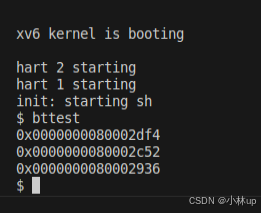
然后我们再使用作业所说的测试命令:
cpp
./grade-lab-traps backtrace
完活!理解了其实不难的。