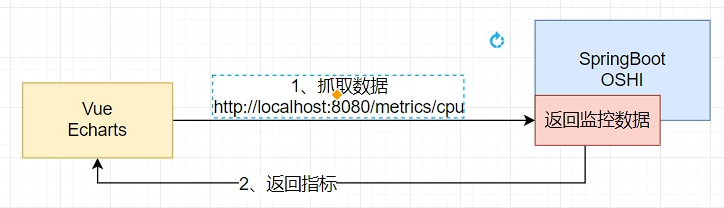
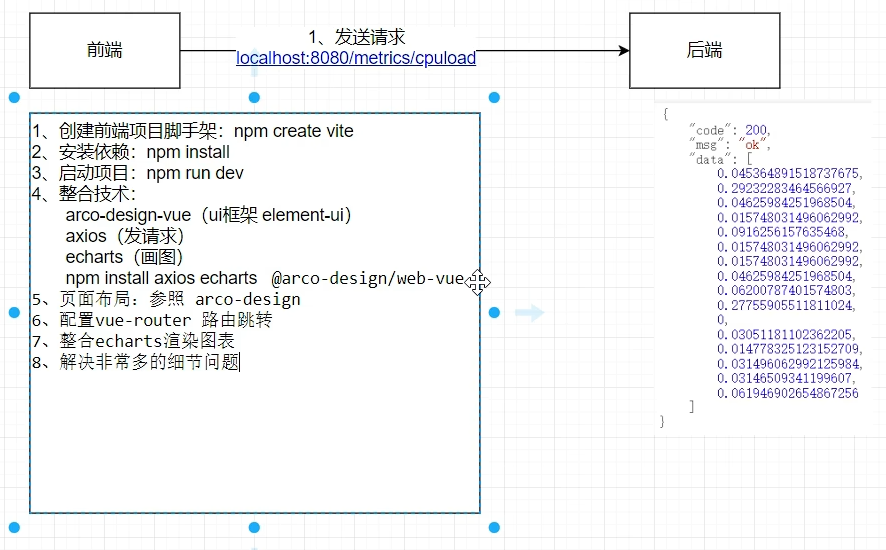
简介
在规划的"springboot+OSHI+Vue+ECharts"全栈监控系统中,OSHI是一个专门用于Java平台的、跨平台的操作系统与硬件信息采集库 ,它在系统中扮演着核心数据采集引擎的角色
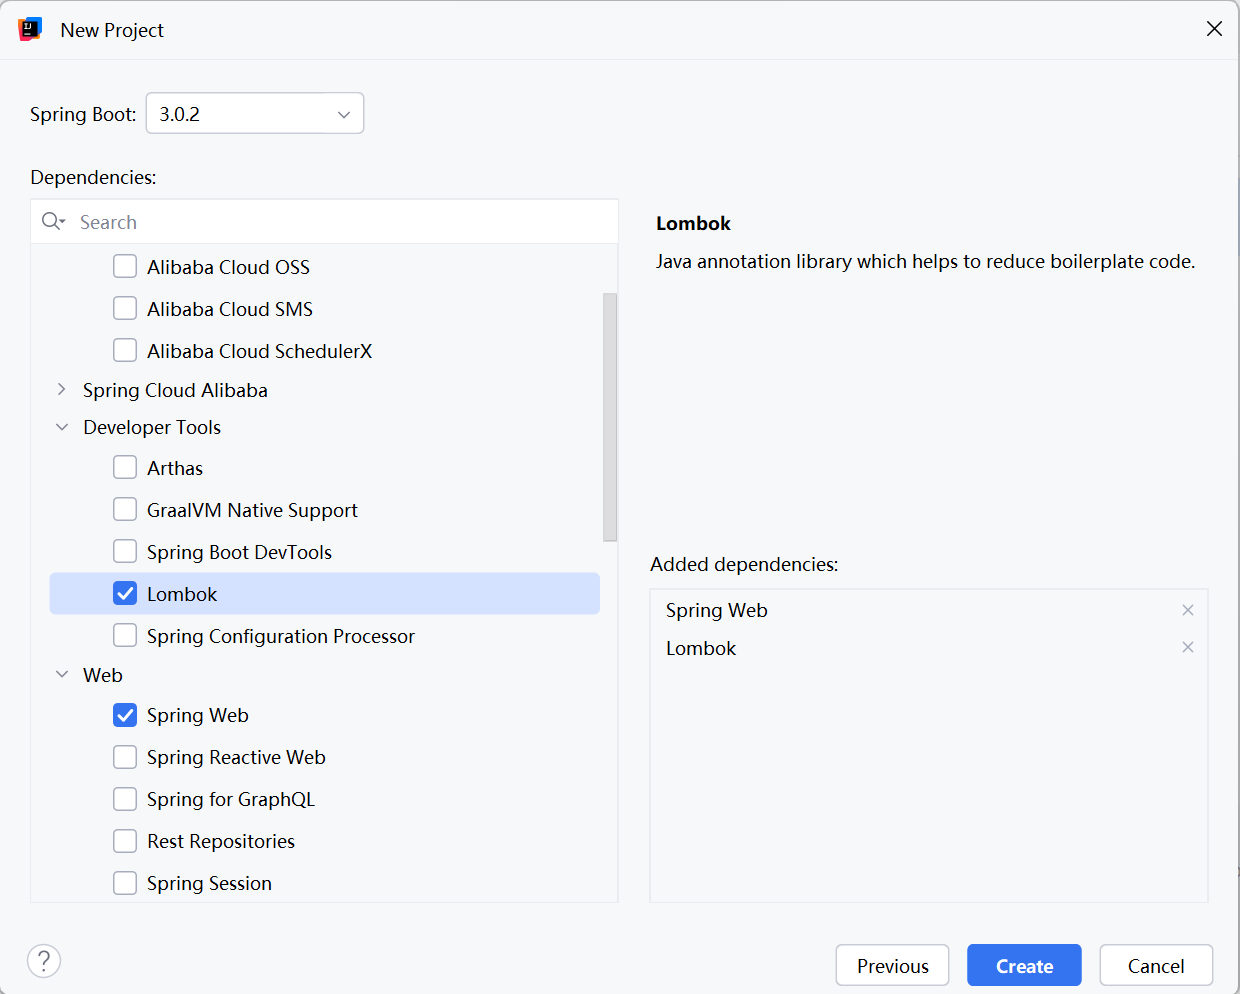
后端
选择两个就够了,其余的不够再添加
把这个指标数据交给前端,让前端可视化展示就行,输出里数组的每一项就是每一个逻辑处理器cpu的使用率
//获取cpu 1s 内的负载
double\[\] processorCpuLoad = processor.getProcessorCpuLoad(1000);
System.out.println("cpu一秒内的负载"+ Arrays.toString(processorCpuLoad));
后端的包结构为:
PS C:\Java\oshi-app\src> tree
卷 empty 的文件夹 PATH 列表
卷序列号为 8E61-6075
C:.
├─main
│  ├─java
│  │  └─com
│  │      └─haha
│  │          ├─common
│  │          ├─controller
│  │          └─service
│  └─resources
│      └─static
└─test
    └─java
        └─com
            └─haha
PS C:\Java\oshi-app\src>
com.haha.common.Result
package com.haha.common;

import lombok.Data;
import lombok.NoArgsConstructor;
//对接前端的Result,不用管范型
//可能对接后端做远程调用什么的,需要精确获取Result的某种类型,就需要做范型
@Data
@NoArgsConstructor
public class Result {
    private Integer code;
    private String msg;
    private Object data;

    public Result(Integer code, String msg) {
        this.code = code; // 将参数code的值赋给当前对象的code成员变量
        this.msg = msg;
    }
    public Result(Integer code, String msg, Object data) {
        this.code = code;
        this.msg = msg;
        this.data = data;
    }
    //快速的成功返回
    public static Result success() {
        return new Result(200, "success");
    }
    public static Result success(Object data) {
        return new Result(200, "success", data);
    }

    //快速的失败返回
    public static Result error() {
        return new Result(500, "error");
    }
    public static Result error(Object data) {
        return new Result(500, "error", data);
    }
    public static Result error(Integer code, String msg) {
        return new Result(code, msg);
    }
}
com.haha.controller.CpuLoadRestController
package com.haha.controller;


import com.haha.common.Result;
import com.haha.service.CpuLoadMetricsService;
import org.springframework.beans.factory.annotation.Autowired;
import org.springframework.web.bind.annotation.CrossOrigin;
import org.springframework.web.bind.annotation.GetMapping;
import org.springframework.web.bind.annotation.RequestMapping;
import org.springframework.web.bind.annotation.RestController;

@CrossOrigin //允许前端跨域访问,后端是8080,前端是5173,地址不一样,前端会有一个安全限制
@RequestMapping("/metrics")
@RestController
public class CpuLoadRestController {
    @Autowired
    private CpuLoadMetricsService cpuLoadMetricsService;

    @GetMapping("/cpuload")
    public Result getCpuLoad(){
        double[] cpuLoad = cpuLoadMetricsService.getCpuLoad();
        return Result.success(cpuLoad);
    }
}
com.haha.service.CpuLoadMetricsService
package com.haha.service;


import org.springframework.stereotype.Service;
import oshi.SystemInfo;
import oshi.hardware.CentralProcessor;
import oshi.hardware.HardwareAbstractionLayer;


@Service
public class CpuLoadMetricsService {
    //0SHI 提供的获取所有数据的入口
    SystemInfo si = new SystemInfo();

    public double[] getCpuLoad() {
        //通过si (SystemInfo实例)获取硬件抽象层对象
        HardwareAbstractionLayer hardware = si.getHardware();
        //拿到cpu信息
        CentralProcessor processor = hardware.getProcessor();
        //获取cpu 1s 内的负载
        double[] CpuLoad = processor.getProcessorCpuLoad(1000);
        return CpuLoad;
    }
}
com.haha.OshiAppApplication :启动类和controller,service,common包同层
后端这样就写完了,后端这里只写了cpu 1s 内的负载的数据,想返回其他数据自己通过看oshi api文档另加
启动项目,查看:
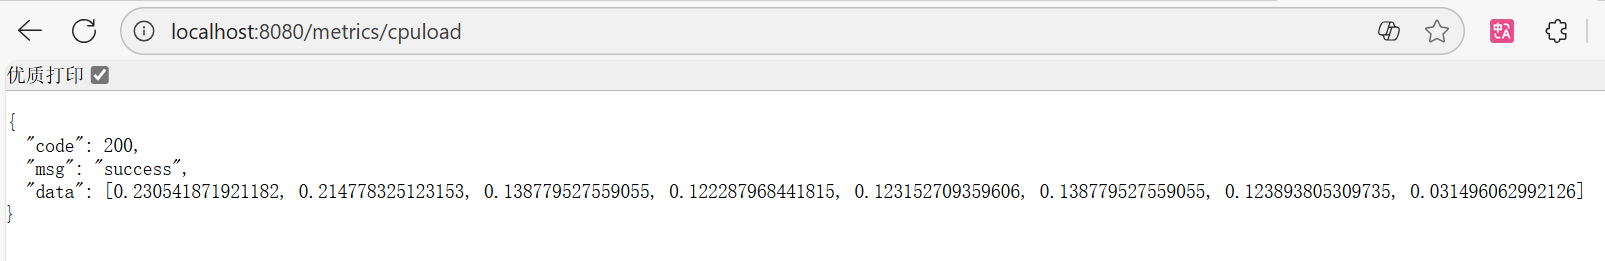
这样说明写的没有问题,后端接口已经准备好了
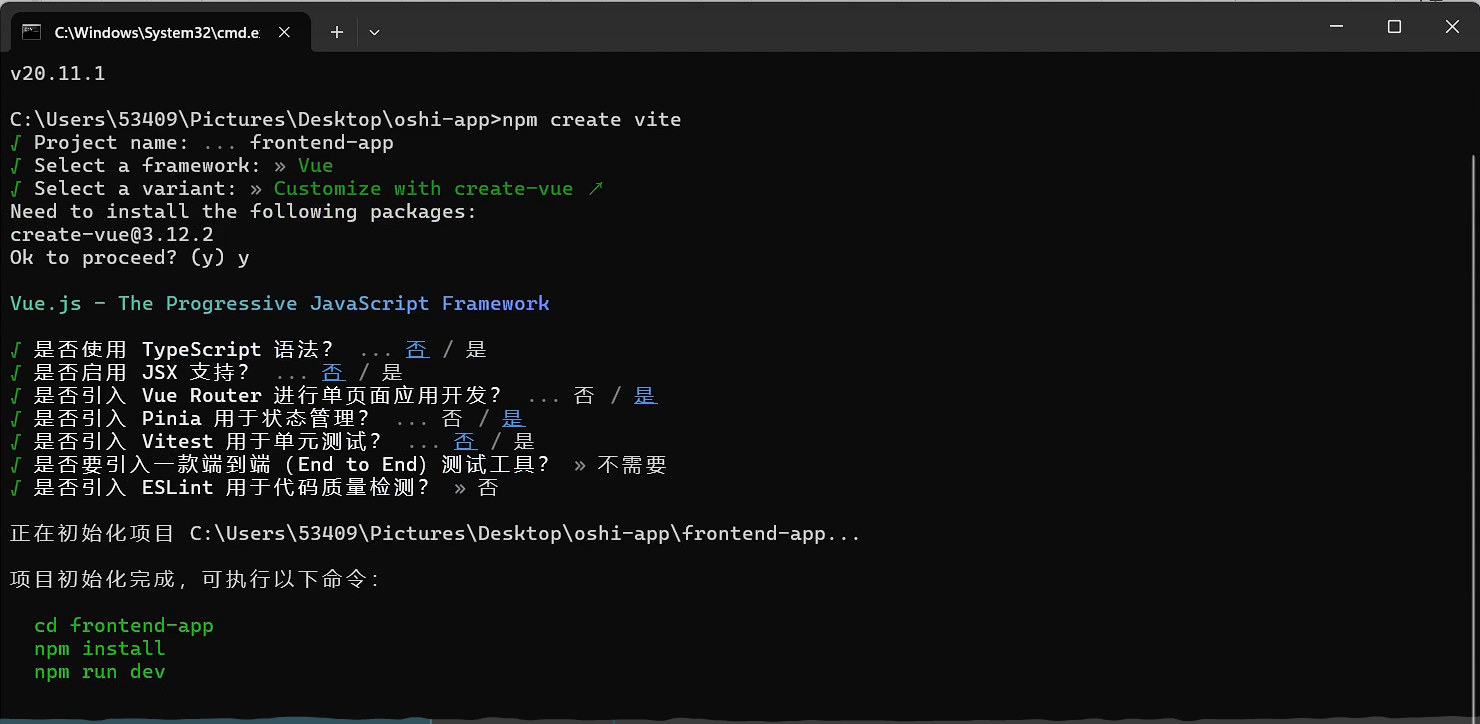
前端
出现这个问题:
PS C:\Java\oshi-app\monitor-app> npm install
npm : 无法加载文件 C:\Nvm\nvm\v22.20.0\npm.ps1,因为在此系统上禁止运行脚本。有关详细信息,请参阅 https:/go.microsoft.com/fwlink/?LinkID=135
170 中的 about_Execution_Policies。
所在位置 行:1 字符: 1
+ npm install
+ ~~~
    + CategoryInfo          : SecurityError: (:) [],PSSecurityException
    + FullyQualifiedErrorId : UnauthorizedAccess
解决办法:
1. 检查当前策略    Get-ExecutionPolicy -List
2. 强制设置当前进程    Set-ExecutionPolicy -ExecutionPolicy Bypass -Scope Process -Force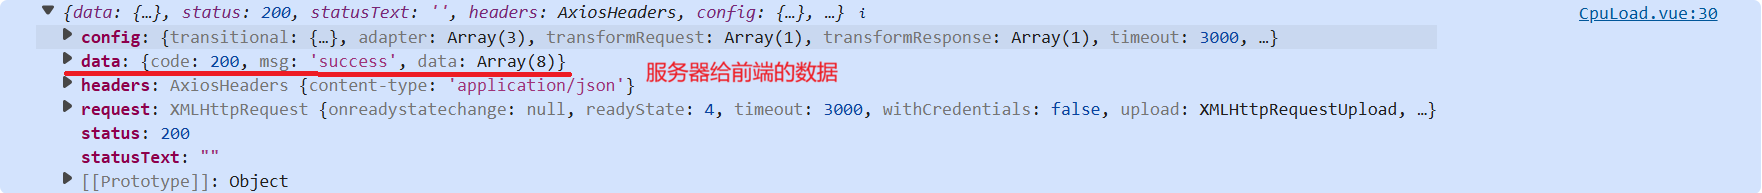
改这里:(拿到服务器真正的响应)
C:\Java\oshi-app\monitor-app\src\http\index.js
// 添加响应拦截器
http.interceptors.response.use(function (response) {
    // 2xx 范围内的状态码都会触发该函数。
    // 对响应数据做点什么
    //原生的响应对象中的 data 才是服务器返回的数据
    return response.data;
  }, function (error) {
    // 超出 2xx 范围的状态码都会触发该函数。
    // 对响应错误做点什么
    return Promise.reject(error); // 将错误继续抛出,让具体调用的地方能捕获处理
  });
前端的包结构为:
PS C:\Java\oshi-app\monitor-app\src> tree
卷 empty 的文件夹 PATH 列表
卷序列号为 8E61-6075
C:.
├─api
├─http
├─router
├─stores
└─views
    └─cpu
PS C:\Java\oshi-app\monitor-app\src>
src\api\cpuloadApi.js:
import axios from "axios";    //用来发请求的
import http from "@/http";

//获取cpu负载数据
const getCpuLoadApi =()=>{
    return http.get("/metrics/cpuload");
}

export{     //前端里面写的东西都得导出去,凡是export导出的,别人就能用
    getCpuLoadApi
}
src\http\index.js:
// 抽取 axios 发请求的方法
import axios from "axios";
const http = axios.create({
  baseURL: 'http://localhost:8080', //基础地址:你后端Spring Boot服务的地址
  timeout: 3000,                    // 超时时间:3秒无响应则自动取消请求,避免界面卡死
  headers: {'X-Custom-Header': 'foobar'} // 默认请求头:可以放一些后端约定的信息(如应用标识)
});

// 添加请求拦截器
http.interceptors.request.use(function (config) {
    // 在发送请求之前做些什么
    return config;
  }, function (error) {
    // 对请求错误做些什么
    return Promise.reject(error);
  });

// 添加响应拦截器
http.interceptors.response.use(function (response) {
    // 2xx 范围内的状态码都会触发该函数。
    // 对响应数据做点什么
    //原生的响应对象中的 data 才是服务器返回的数据
    return response.data;
  }, function (error) {
    // 超出 2xx 范围的状态码都会触发该函数。
    // 对响应错误做点什么
    return Promise.reject(error); // 将错误继续抛出,让具体调用的地方能捕获处理
  });

  export default http;
src\router\index.js:
import CpuLoad from '@/views/cpu/CpuLoad.vue'
import Home from '@/views/Home.vue'
import { createRouter, createWebHistory } from 'vue-router'

const router = createRouter({
  history: createWebHistory(import.meta.env.BASE_URL),
  routes: [
      {
        path:'/',
        name: 'home',
        component: Home,
      },
      {
        path:'/cpu',
        name: 'cpu',
        component: CpuLoad,
      },
  ],
})

export default router
src\stores\counter.js:
import { ref, computed } from 'vue'
import { defineStore } from 'pinia'
export const useCounterStore = defineStore('counter', () => {
const count = ref(0)
const doubleCount = computed(() => count.value * 2)
function increment() {
count.value++
}
return { count, doubleCount, increment }
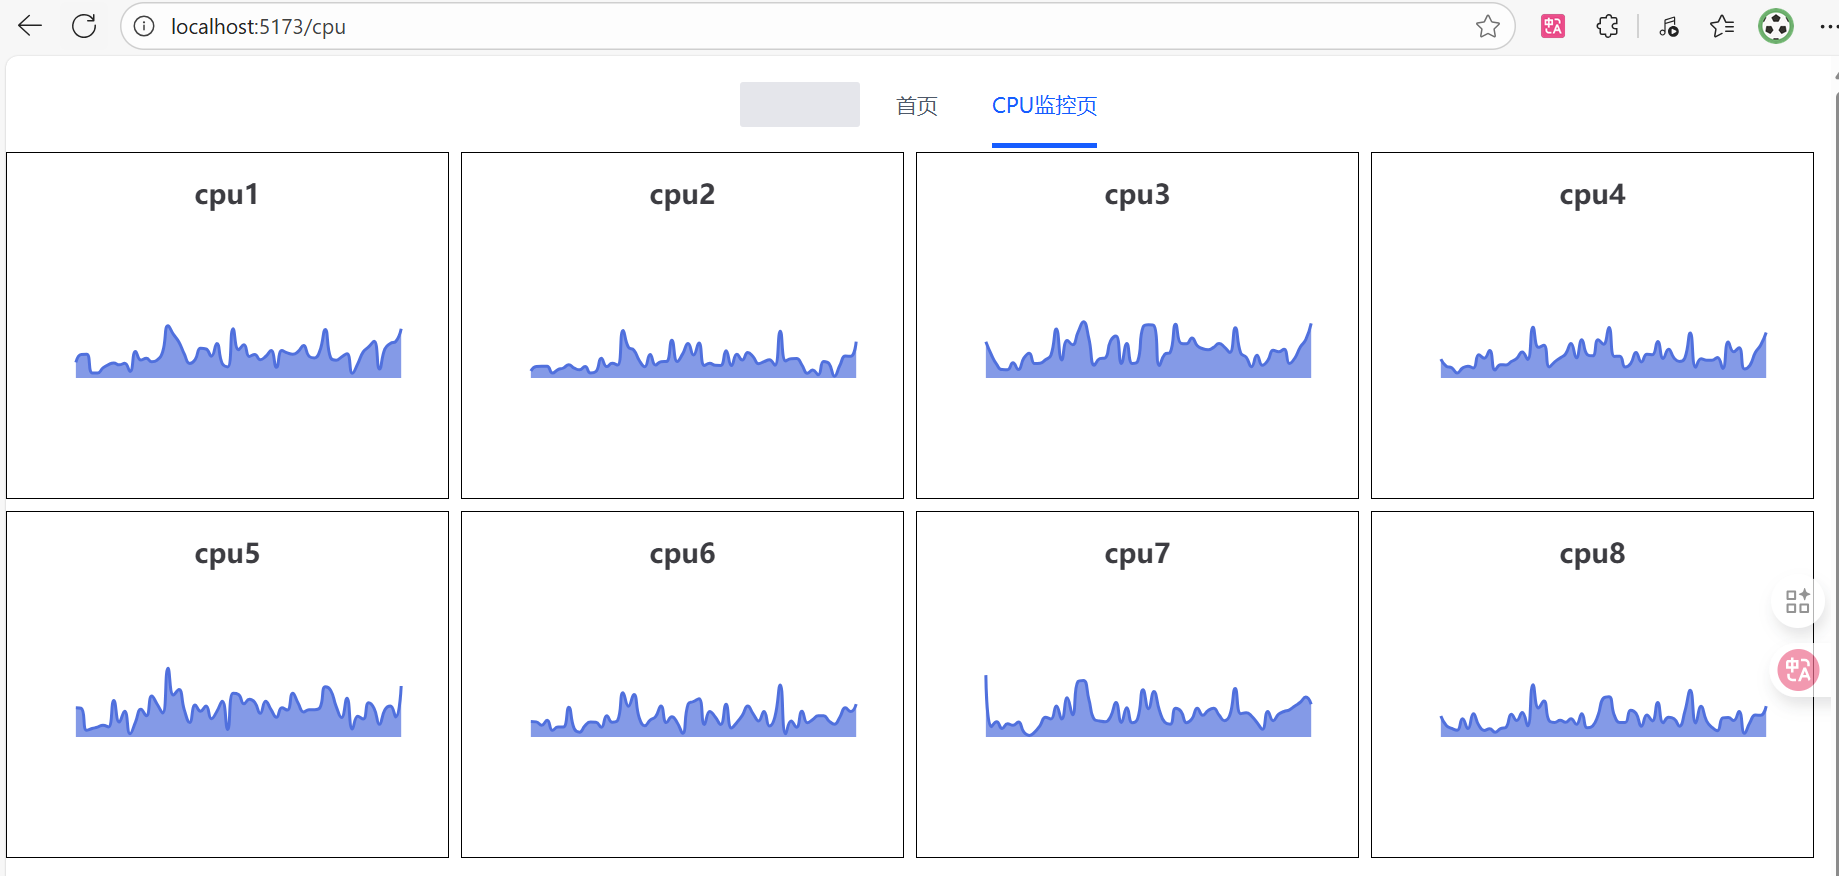
})src\views\cpu\CpuLoad.vue:
<template>
  <!--8个叫cpu-[1~8]-->
  <a-space wrap="true">
    <div
      :id="`cpu-${i}`"
      style="height: 230px; width: 294px; border: 1px solid black"
      :key="i"
      v-for="i in 8"
    ></div>
  </a-space>
</template>

<script setup>
import { TimelineItem } from "@arco-design/web-vue";
import * as echarts from "echarts";
import { ref, onMounted } from "vue";
import { getCpuLoadApi } from "@/api/cpuloadApi";

//保存所有初始化的图表
const chartDom = ref([]);

onMounted(() => {
  //drawCpuLoad();
  //初始化图标只需要进行一次
  initChart();
  getCpuData();
});

const initChart = () => {
  for (let i = 1; i <= 8; i++) {
    var dom = document.getElementById("cpu-" + i);
    //得到一个chart对象
    var myChart = echarts.init(dom);
    chartDom.value.push(myChart);
  }
};

//8核cpu 的所有数据
//每一核还是一个数组,这个数组中保存的是每秒的数据
//在这个里面隐藏的是二维数组,第一维是每一个cpu,每一个cpu里面又是一个数组,代表它里面的所有的数据,不然每个cpu只有一个数据
const cpuAllData = ref([]);

const getCpuData = async () => {
  //1.拿到服务器真正的响应 ,给服务器发送请求获取
  let resp = await getCpuLoadApi(); //等待 API 调用完成,并将结果赋值给 resp 变量,await要配合async一起使用
  //2.返回的是当前8核cpu当前的负载值
  let data = resp.data;
  for (let i = 0; i < 8; i++) {
    //把当前请求到的这个cpu的使用率放进自己的数组中,第一次要初始化数组
    if (!cpuAllData.value[i]) {
      cpuAllData.value[i] = [];
    }

    //60s内的cpu负载监控图
    if (cpuAllData.value[i].length > 60) {
      //把最老的一个数据删除,放入最新获取的这个数据
      let arr = cpuAllData.value[i].slice(-60);  //移除了最前一个元素的数组
      arr.push(data[i])
      cpuAllData.value[i] = arr;
    } else {
      cpuAllData.value[i].push(data[i]);
    }

    //这里会00M;这个数组最多放60个?超过60个删除最老的
    drawCpuLoad(i + 1, cpuAllData.value[i]);
  }
  await getCpuData();
};
//1、每个图显示CPU名
//2、每个图xy轴不显示(和windows一样)
//3、显示为面积图
const drawCpuLoad = (cpuIndex, cpuData) => {
  //页面加载出来,有div,dom元素才可以显示

  //得到一个chart对象
  var myChart = chartDom.value[cpuIndex - 1];
  var option;

  option = {
    title: {
      text: "cpu" + cpuIndex,
    },
    xAxis: {
      show: false,
      type: "category",
      data: cpuData.map((_, index) => index + 1)
    },
    yAxis: {
      show: false,
      type: "value",
      min: 0,
      max: 1
    },
    series: [
      {
        data: cpuData,
        type: "line",
        areaStyle: {},
        smooth: true,
        symbol: "none",
      },
    ],
  };

  option && myChart.setOption(option);
};
</script>

<style scoped>
</style>
src\views\NavBar.vue:
<script setup>
import { useRouter} from 'vue-router';    //vue里面导航的跳转要用useRouter函数
const router = useRouter();         //useRouter这个函数会给你返回一个路由器
const navTo =(url)=>{               //这个url是@click按钮传进来的
      router.push(url);
}
</script>

<template>
  <div class="menu-demo">
    <a-menu mode="horizontal" :default-selected-keys="['1']">
      <a-menu-item key="0" :style="{ padding: 0 }" disabled>
        <div
          :style="{
            width: '80px',
            height: '30px',
            borderRadius: '2px',
            background: 'var(--color-fill-3)',
            cursor: 'text',
          }"
        />
      </a-menu-item>
      <a-menu-item key="/" @click="navTo('/')">首页</a-menu-item>
      <a-menu-item key="/cpu" @click="navTo('/cpu')">CPU监控页</a-menu-item>
    </a-menu>
  </div>
</template>

<style scoped>
.menu-demo {
  box-sizing: border-box;
  width: 100%;
  background-color: var(--color-neutral-2);
}
</style>
src\App.vue:
<script setup>
import { RouterView } from 'vue-router';
import NavBar from './views/NavBar.vue';
</script>
<template>
<div class="layout-demo">
<a-layout style="height: 100vh;">
<a-layout-header>
<NavBar/>
</a-layout-header>
<a-layout-content>
<RouterView /> <!--表示内容是动态的 -->
</a-layout-content>
<a-layout-footer>Footer</a-layout-footer>
</a-layout>
</div>
</template>
<style scoped>
.layout-demo :deep(.arco-layout-header),
.layout-demo :deep(.arco-layout-footer),
.layout-demo :deep(.arco-layout-sider-children),
.layout-demo :deep(.arco-layout-content) {
display: flex;
flex-direction: column;
justify-content: center;
font-size: 16px;
font-stretch: condensed;
text-align: center;
}
.layout-demo :deep(.arco-layout-header),
.layout-demo :deep(.arco-layout-footer) {
height: 64px;
}
.layout-demo :deep(.arco-layout-sider) {
width: 206px;
}
.layout-demo :deep(.arco-layout-content) {
}
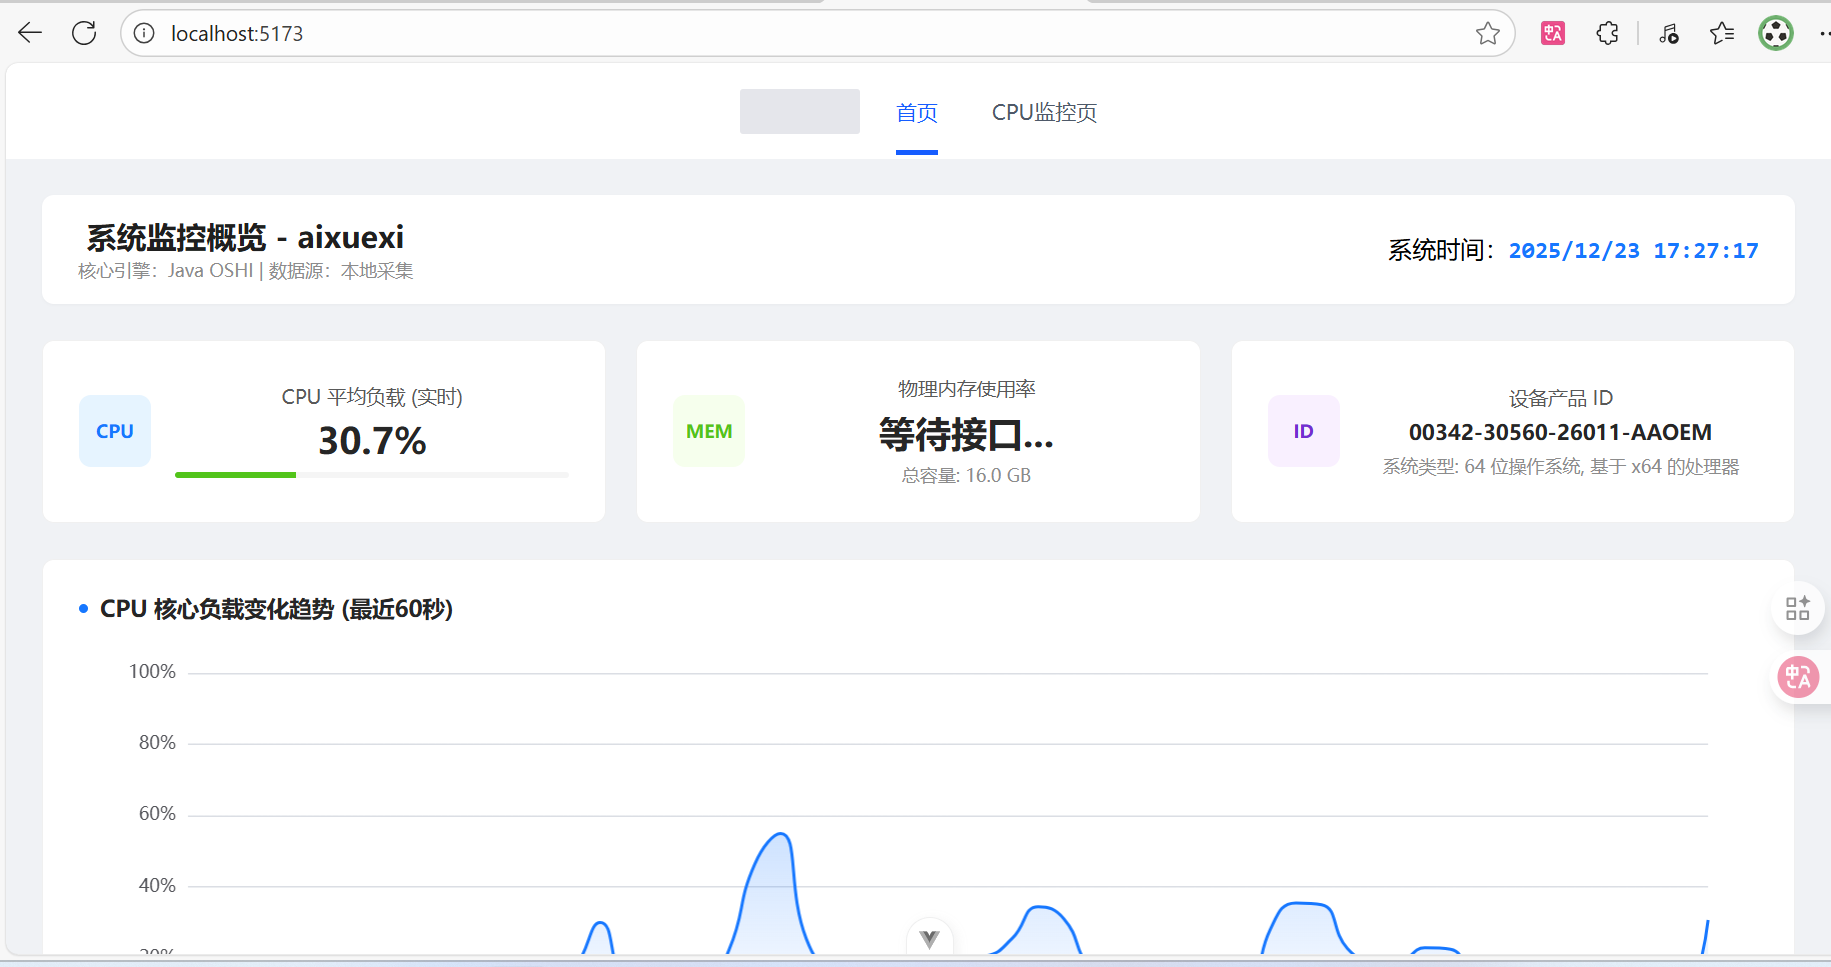
</style>src\views\Home.vue:
这个让前端最严厉的父亲来写
<template>
  <div class="dashboard-container">
    <div class="header-box">
      <div class="header-left">
        <h2>系统监控概览 - {{ deviceInfo.deviceName }}</h2>
        <p class="status-tag">核心引擎:Java OSHI | 数据源:本地采集</p >
      </div>
      <div class="header-right">
        <span class="time-label">系统时间:</span>
        <span class="time-value">{{ currentTime }}</span>
      </div>
    </div>

    <div class="card-grid">
      <div class="stat-card">
        <div class="card-icon cpu-theme">CPU</div>
        <div class="card-content">
          <div class="label">CPU 平均负载 (实时)</div>
          <div class="value">{{ currentAvgLoad !== null ? currentAvgLoad + '%' : '采集源连接中...' }}</div>
          <div class="progress-container">
            <div class="progress-bar" :style="{ width: currentAvgLoad + '%', backgroundColor: getLoadColor(currentAvgLoad) }"></div>
          </div>
        </div>
      </div>

      <div class="stat-card">
        <div class="card-icon mem-theme">MEM</div>
        <div class="card-content">
          <div class="label">物理内存使用率</div>
          <div class="value">{{ sysMetrics.memUsage || '等待接口...' }}</div>
          <div class="sub-label">总容量: {{ deviceInfo.ramTotal }}</div>
        </div>
      </div>

      <div class="stat-card">
        <div class="card-icon device-theme">ID</div>
        <div class="card-content">
          <div class="label">设备产品 ID</div>
          <div class="value small">{{ deviceInfo.productId }}</div>
          <div class="sub-label">系统类型: {{ deviceInfo.osType }}</div>
        </div>
      </div>
    </div>

    <div class="chart-section">
      <div class="chart-title">
        <span class="dot"></span> CPU 核心负载变化趋势 (最近60秒)
      </div>
      <div id="cpu-load-chart" class="chart-canvas"></div>
    </div>

    <div class="table-section">
      <div class="chart-title"><span class="dot"></span> 计算机硬件详细配置</div>
      <table class="data-table">
        <thead>
          <tr>
            <th width="200">配置项</th>
            <th>详细参数内容</th>
          </tr>
        </thead>
        <tbody>
          <tr>
            <td class="td-label">设备名称</td>
            <td>{{ deviceInfo.deviceName }}</td>
          </tr>
          <tr>
            <td class="td-label">处理器 (CPU)</td>
            <td>{{ deviceInfo.cpuModel }}</td>
          </tr>
          <tr>
            <td class="td-label">机带 RAM</td>
            <td>{{ deviceInfo.ramTotal }} (15.7 GB 可用)</td>
          </tr>
          <tr>
            <td class="td-label">设备 ID</td>
            <td>{{ deviceInfo.deviceId }}</td>
          </tr>
          <tr>
            <td class="td-label">产品 ID</td>
            <td>{{ deviceInfo.productId }}</td>
          </tr>
          <tr>
            <td class="td-label">系统类型</td>
            <td>{{ deviceInfo.osType }}</td>
          </tr>
          <tr>
            <td class="td-label">笔和触控</td>
            <td>{{ deviceInfo.touchSupport }}</td>
          </tr>
        </tbody>
      </table>
    </div>
  </div>
</template>

<script setup>
import { ref, reactive, onMounted, onUnmounted } from 'vue';
import * as echarts from 'echarts';
import { getCpuLoadApi } from '@/api/cpuloadApi';

// --- 你的真实电脑信息 (静态) ---
const deviceInfo = {
  deviceName: 'aixuexi',
  cpuModel: '11th Gen Intel(R) Core(TM) i5-1135G7 @ 2.40GHz (2.42 GHz)',
  ramTotal: '16.0 GB',
  deviceId: '123E150F-89F7-4E25-9A40-236BCEC9D001',
  productId: '00342-30560-26011-AAOEM',
  osType: '64 位操作系统, 基于 x64 的处理器',
  touchSupport: '没有可用于此显示器的笔或触控输入'
};

// --- 运行时动态指标 ---
const currentTime = ref('');
const currentAvgLoad = ref(null);
const loadHistory = ref([]); // 存储最近60个数据点

// 预留接口数据占位,不填入假数据
const sysMetrics = reactive({
  memUsage: null,
  upTime: null
});

let cpuChart = null;
let dataTimer = null;
let clockTimer = null;

// --- 逻辑处理 ---

// 获取 CPU 真实数据
const fetchRealCpuData = async () => {
  try {
    const res = await getCpuLoadApi();
    const loads = res.data || [];
    if (loads.length > 0) {
      // 计算所有核心的平均值并转为百分比
      const avg = (loads.reduce((a, b) => a + b, 0) / loads.length * 100).toFixed(1);
      currentAvgLoad.value = avg;

      // 更新历史记录
      const now = new Date().toLocaleTimeString('zh-CN', { hour12: false });
      if (loadHistory.value.length >= 60) loadHistory.value.shift();
      loadHistory.value.push({ time: now, value: avg });

      updateChart();
    }
  } catch (err) {
    console.error("无法获取CPU负载数据,请检查后端接口:", err);
  }
};

const initChart = () => {
  const chartDom = document.getElementById('cpu-load-chart');
  if (!chartDom) return;
  cpuChart = echarts.init(chartDom);
  cpuChart.setOption({
    tooltip: { trigger: 'axis', formatter: '{b} <br/> 负载: {c}%' },
    grid: { left: '3%', right: '3%', bottom: '3%', top: '5%', containLabel: true },
    xAxis: {
      type: 'category',
      boundaryGap: false,
      data: [],
      axisLine: { lineStyle: { color: '#ddd' } }
    },
    yAxis: {
      type: 'value',
      min: 0,
      max: 100,
      axisLabel: { formatter: '{value}%' }
    },
    series: [{
      name: 'CPU负载',
      type: 'line',
      smooth: true,
      symbol: 'none',
      areaStyle: {
        color: new echarts.graphic.LinearGradient(0, 0, 0, 1, [
          { offset: 0, color: 'rgba(22, 119, 255, 0.3)' },
          { offset: 1, color: 'rgba(22, 119, 255, 0)' }
        ])
      },
      lineStyle: { color: '#1677ff', width: 2 },
      data: []
    }]
  });
};

const updateChart = () => {
  if (!cpuChart) return;
  cpuChart.setOption({
    xAxis: { data: loadHistory.value.map(i => i.time) },
    series: [{ data: loadHistory.value.map(i => i.value) }]
  });
};

const getLoadColor = (val) => {
  if (val > 80) return '#ff4d4f'; // 红色(高负载)
  if (val > 50) return '#faad14'; // 黄色
  return '#52c41a'; // 绿色(正常)
};

const tick = () => {
  currentTime.value = new Date().toLocaleString();
};

onMounted(() => {
  tick();
  clockTimer = setInterval(tick, 1000);
  initChart();
  fetchRealCpuData();
  dataTimer = setInterval(fetchRealCpuData, 2000); // 2秒同步一次后端 OSHI 数据

  window.addEventListener('resize', () => cpuChart?.resize());
});

onUnmounted(() => {
  clearInterval(dataTimer);
  clearInterval(clockTimer);
  if (cpuChart) cpuChart.dispose();
});
</script>

<style scoped>
.dashboard-container {
  padding: 24px;
  background-color: #f0f2f5;
  min-height: 100vh;
}

.header-box {
  display: flex;
  justify-content: space-between;
  align-items: center;
  margin-bottom: 24px;
  padding: 16px 24px;
  background: #fff;
  border-radius: 8px;
  box-shadow: 0 1px 2px rgba(0,0,0,0.03);
}
.header-box h2 { margin: 0; font-size: 20px; color: #1f1f1f; }
.status-tag { margin: 4px 0 0 0; font-size: 12px; color: #8c8c8c; }
.time-value { font-family: 'Consolas', monospace; font-weight: bold; color: #1677ff; font-size: 16px; }

.card-grid {
  display: grid;
  grid-template-columns: repeat(auto-fit, minmax(320px, 1fr));
  gap: 20px;
  margin-bottom: 24px;
}
.stat-card {
  background: #fff;
  border-radius: 8px;
  padding: 24px;
  display: flex;
  align-items: center;
  border: 1px solid #f0f0f0;
}
.card-icon {
  width: 48px; height: 48px; border-radius: 8px;
  display: flex; align-items: center; justify-content: center;
  font-weight: bold; margin-right: 16px; font-size: 12px;
}
.cpu-theme { background: #e6f4ff; color: #1677ff; }
.mem-theme { background: #f6ffed; color: #52c41a; }
.device-theme { background: #f9f0ff; color: #722ed1; }

.card-content { flex: 1; overflow: hidden; }
.label { font-size: 13px; color: #595959; margin-bottom: 8px; }
.value { font-size: 24px; font-weight: bold; color: #262626; margin-bottom: 8px; }
.value.small { font-size: 14px; white-space: nowrap; text-overflow: ellipsis; overflow: hidden; }
.sub-label { font-size: 12px; color: #8c8c8c; }

.progress-container { height: 4px; background: #f5f5f5; border-radius: 2px; overflow: hidden; }
.progress-bar { height: 100%; transition: width 0.4s cubic-bezier(0.08, 0.82, 0.17, 1); }

.chart-section {
  background: #fff;
  border-radius: 8px;
  padding: 24px;
  margin-bottom: 24px;
  border: 1px solid #f0f0f0;
}
.chart-title {
  font-weight: bold; font-size: 15px; color: #262626; margin-bottom: 20px;
  display: flex; align-items: center;
}
.dot { width: 6px; height: 6px; background: #1677ff; border-radius: 50%; margin-right: 8px; }
.chart-canvas { height: 280px; width: 100%; }

.table-section {
  background: #fff;
  border-radius: 8px;
  padding: 24px;
  border: 1px solid #f0f0f0;
}
.data-table { width: 100%; border-collapse: collapse; }
.data-table th { text-align: left; padding: 12px 16px; background: #fafafa; color: #595959; font-size: 14px; border-bottom: 1px solid #f0f0f0; }
.data-table td { padding: 12px 16px; border-bottom: 1px solid #f0f0f0; font-size: 14px; color: #262626; }
.td-label { color: #8c8c8c; font-weight: 500; }
</style>
最终效果: