欢迎大家加入开源鸿蒙跨平台开发者社区,一起共建开源鸿蒙跨平台生态。
📌 概述
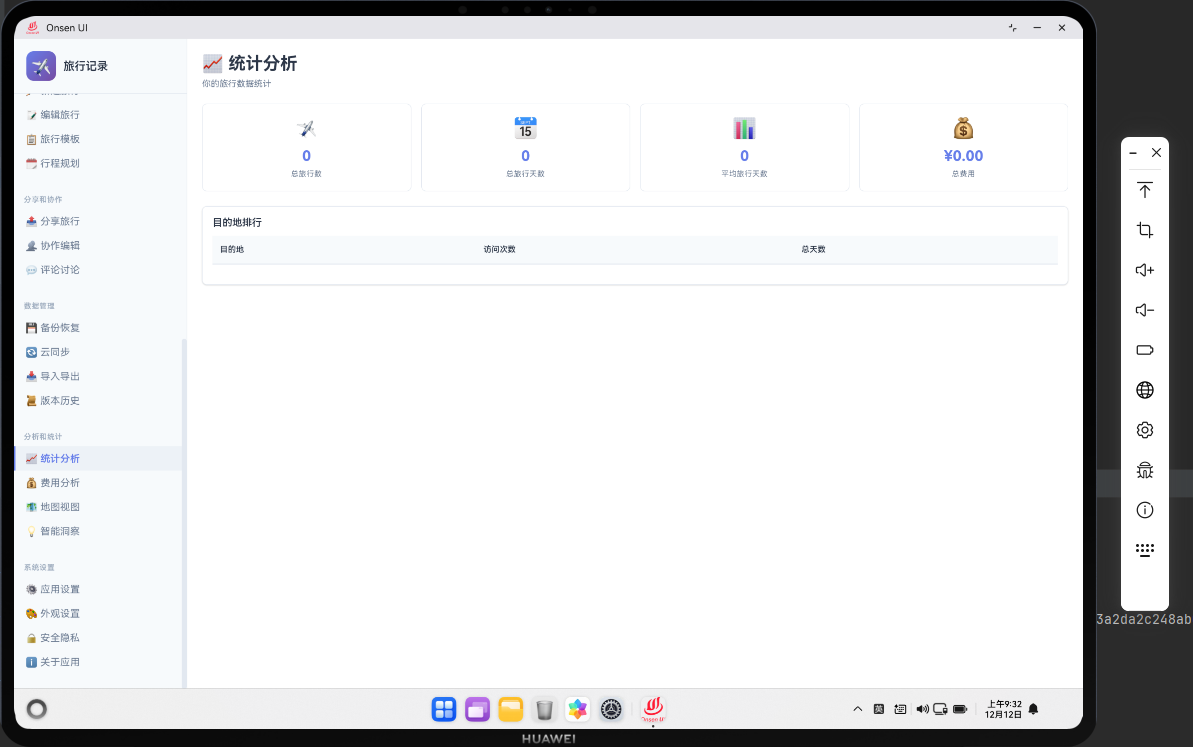
统计分析功能提供了旅行数据的深度分析。用户可以查看旅行的统计数据,如总旅行数、总花费、平均花费等。统计分析还支持按目的地、时间等维度进行分析。在 Cordova 与 OpenHarmony 的混合开发框架中,统计分析需要实现复杂的数据计算和可视化。
🔗 完整流程
第一步:数据统计计算
统计分析需要对旅行数据进行各种计算,如求和、平均、最大值、最小值等。计算结果需要按不同维度进行分组和排序。
第二步:统计结果展示与可视化
统计结果可以以表格、图表等形式展示。用户可以选择不同的统计维度和时间范围。
第三步:原生层数据处理与缓存
OpenHarmony 原生层可以实现高性能的数据计算和缓存。原生层还可以实现图表的渲染。
🔧 Web 代码实现
统计分析页面 HTML 结构
html
<div id="statistics-page" class="page">
    <div class="page-header">
        <h1>统计分析</h1>
    </div>

    <div class="statistics-container">
        <div class="stats-cards">
            <div class="stat-card">
                <span class="stat-label">总旅行数</span>
                <span class="stat-value" id="totalTrips">0</span>
            </div>
            <div class="stat-card">
                <span class="stat-label">总花费</span>
                <span class="stat-value" id="totalExpense">¥0</span>
            </div>
            <div class="stat-card">
                <span class="stat-label">平均花费</span>
                <span class="stat-value" id="avgExpense">¥0</span>
            </div>
            <div class="stat-card">
                <span class="stat-label">总天数</span>
                <span class="stat-value" id="totalDays">0</span>
            </div>
        </div>

        <div class="stats-chart" id="statsChart">
            <!-- 图表动态加载 -->
        </div>

        <div class="stats-table" id="statsTable">
            <!-- 统计表格动态加载 -->
        </div>
    </div>
</div>
HTML 结构包含统计卡片、图表和表格。
加载统计数据函数
javascript
async function loadStatistics() {
    try {
        // 获取所有旅行
        const trips = await db.getAllTrips();

        // 计算统计数据
        const stats = calculateStatistics(trips);

        // 更新统计卡片
        document.getElementById('totalTrips').textContent = stats.totalTrips;
        document.getElementById('totalExpense').textContent = `¥${stats.totalExpense}`;
        document.getElementById('avgExpense').textContent = `¥${stats.avgExpense}`;
        document.getElementById('totalDays').textContent = stats.totalDays;

        // 渲染统计表格
        renderStatisticsTable(stats.byDestination);
    } catch (error) {
        console.error('Error loading statistics:', error);
        showToast('加载统计数据失败');
    }
}
加载统计数据函数计算统计信息。
统计计算函数
javascript
function calculateStatistics(trips) {
    let totalTrips = trips.length;
    let totalExpense = 0;
    let totalDays = 0;
    const byDestination = {};

    trips.forEach(trip => {
        // 累加花费
        totalExpense += trip.expense || 0;

        // 计算天数
        const startDate = new Date(trip.startDate);
        const endDate = new Date(trip.endDate);
        const days = Math.ceil((endDate - startDate) / (1000 * 60 * 60 * 24)) + 1;
        totalDays += days;

        // 按目的地分组
        if (!byDestination[trip.destination]) {
            byDestination[trip.destination] = {
                count: 0,
                expense: 0,
                days: 0
            };
        }
        byDestination[trip.destination].count++;
        byDestination[trip.destination].expense += trip.expense || 0;
        byDestination[trip.destination].days += days;
    });

    const avgExpense = totalTrips > 0 ? Math.round(totalExpense / totalDays) : 0;

    return {
        totalTrips,
        totalExpense,
        avgExpense,
        totalDays,
        byDestination
    };
}
统计计算函数计算各种统计指标。
统计表格渲染函数
javascript
function renderStatisticsTable(byDestination) {
    const container = document.getElementById('statsTable');
    container.innerHTML = '<h3>按目的地统计</h3>';

    const table = document.createElement('table');
    table.className = 'stats-table';
    table.innerHTML = `
        <thead>
            <tr>
                <th>目的地</th>
                <th>次数</th>
                <th>总花费</th>
                <th>总天数</th>
                <th>平均花费</th>
            </tr>
        </thead>
        <tbody>
            ${Object.entries(byDestination).map(([destination, stats]) => `
                <tr>
                    <td>${destination}</td>
                    <td>${stats.count}</td>
                    <td>¥${stats.expense}</td>
                    <td>${stats.days}</td>
                    <td>¥${Math.round(stats.expense / stats.days)}</td>
                </tr>
            `).join('')}
        </tbody>
    `;

    container.appendChild(table);
}
统计表格渲染函数展示按目的地的统计数据。
🔌 OpenHarmony 原生代码实现
统计分析插件
typescript
// StatisticsPlugin.ets
import { BusinessError } from '@ohos.base';

export class StatisticsPlugin {
    // 处理统计数据加载事件
    onStatisticsLoaded(args: any, callback: Function): void {
        try {
            const tripCount = args[0].tripCount;
            const totalExpense = args[0].totalExpense;

            console.log(`[Statistics] Loaded: ${tripCount} trips, ¥${totalExpense}`);

            callback({ success: true, message: '统计数据已加载' });
        } catch (error) {
            callback({ success: false, error: error.message });
        }
    }
}
统计分析插件处理统计数据加载。
📝 总结
统计分析功能展示了如何在 Cordova 与 OpenHarmony 框架中实现一个数据分析系统。Web 层负责统计计算和 UI 展示,原生层负责高性能数据处理。通过统计分析,用户可以深入了解旅行数据。