在政企内网、涉密园区、封闭办公区等无法访问外网的场景中,基于高德、百度等商业地图 API 的 Web 地图方案往往无法落地 ------ 这类 API 的 Key 校验、瓦片加载等核心环节均依赖外网访问。本文将详细介绍基于开源瓦片数据 + Leaflet 的 Web 离线地图实现方案,并重点探讨该方案的法律风险与使用注意事项。
一、技术实现方案
1. 核心思路
离线地图的核心是摆脱对商业地图 API 外网服务的依赖,通过以下步骤实现:
- 下载开源地图瓦片数据(卫星图、标注层);
- 将瓦片数据部署到内网存储(本地项目 / MinIO / 内网服务器);
- 基于 Leaflet 加载内网瓦片,实现地图展示、打点、画线等核心功能。
2. 瓦片数据准备
(1)数据下载工具
推荐使用「全能地图下载器」或「水经注地图下载器」,这类工具支持:
- 选择地图层级(建议 1-10 级,层级越高数据量越大);
- 框选下载区域(如全国、某省份);
- 导出瓦片为
{z}/{x}/{y}.jpg/png格式(符合 Leaflet 瓦片加载规范)。
(2)数据存储方式
- 轻量场景 :层级≤5、区域较小的瓦片,可直接放入前端项目的
public目录; - 中大型场景:层级高、区域大的瓦片,建议部署到 MinIO(内网对象存储)或内网 HTTP 服务器,通过内网地址访问。
3. 前端核心实现(Vue+Leaflet)
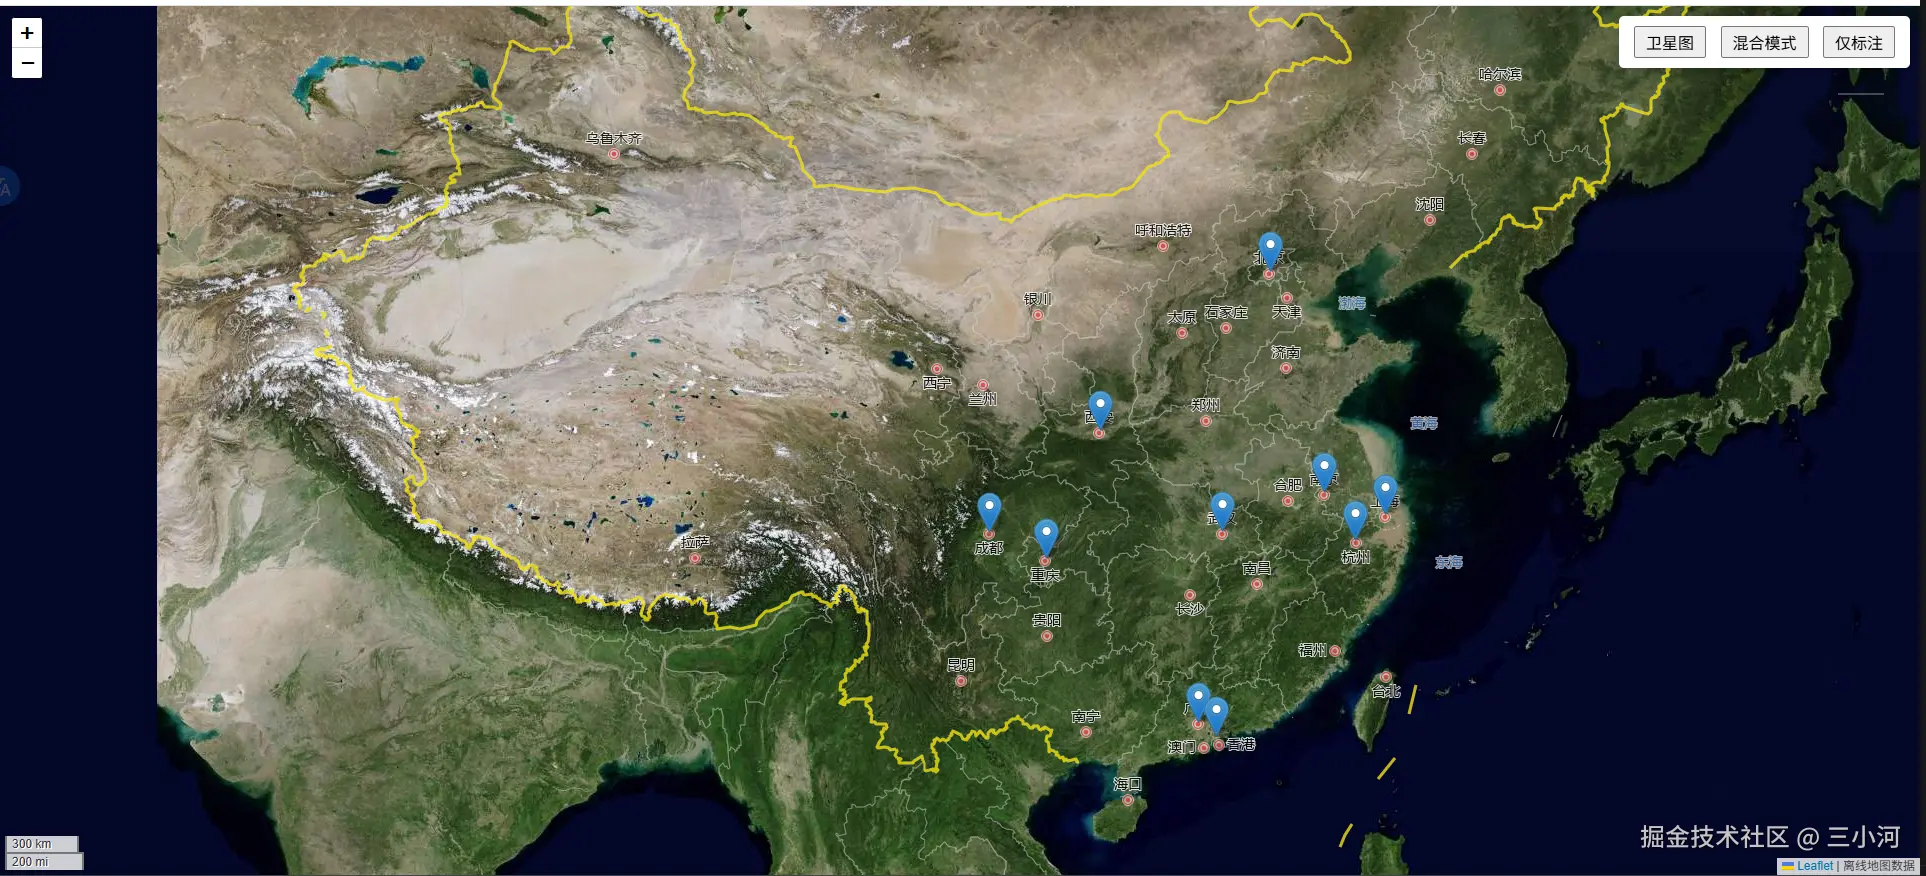
以下是完整的离线地图实现代码,包含地图初始化、多图层切换、点位标记、弹窗交互等核心功能 vue
xml
<template>
<div class="offline-map-container">
<!-- 地图容器 -->
<div ref="mapContainer" class="map-container" />
<!-- 图层切换控件 -->
<div class="controls">
<button @click="switchLayer('satellite')">卫星图</button>
<button @click="switchLayer('hybrid')">混合模式</button>
<button @click="switchLayer('overlay')">仅标注</button>
</div>
</div>
</template>
<script>
import L from 'leaflet'
import 'leaflet/dist/leaflet.css'
// 自定义标记图标(需自行准备)
import blueIcon from '@/assets/map/marker-icon.png'
import redIcon from '@/assets/map/marker-icon-red.png'
import shadowIcon from '@/assets/map/marker-shadow.png'
export default {
name: 'OfflineMap',
data() {
return {
map: null,
satelliteLayer: null, // 卫星图图层
overlayLayer: null, // 标注图层
currentLayerType: 'hybrid', // 默认混合图层
chinaCenter: [35.8617, 104.1954], // 中国地理中心点
defaultZoom: 6, // 默认缩放级别
// 模拟点位数据(实际可替换为业务数据)
markerDataList: [
{ id: 1, name: '北京', lat: 39.9042, lng: 116.4074, desc: '中国首都,政治文化中心' },
{ id: 2, name: '上海', lat: 31.2304, lng: 121.4737, desc: '国际化大都市,经济中心' },
{ id: 3, name: '广州', lat: 23.1291, lng: 113.2644, desc: '华南门户,商贸中心' },
{ id: 4, name: '深圳', lat: 22.5431, lng: 114.0579, desc: '科技创新之都,经济特区' },
{ id: 5, name: '成都', lat: 30.5728, lng: 104.0668, desc: '西南重镇,天府之国' },
{ id: 6, name: '重庆', lat: 29.5628, lng: 106.5516, desc: '直辖市,山城雾都' },
{ id: 7, name: '西安', lat: 34.3416, lng: 108.9398, desc: '十三朝古都,历史文化名城' },
{ id: 8, name: '武汉', lat: 30.5928, lng: 114.3055, desc: '九省通衢,中部核心城市' },
{ id: 9, name: '杭州', lat: 30.2741, lng: 120.1551, desc: '电商之都,风景旅游城市' },
{ id: 10, name: '南京', lat: 32.0603, lng: 118.7969, desc: '六朝古都,华东重要城市' }
],
markers: [], // 存储标记实例
activeMarkerId: null // 当前激活的点位ID
}
},
mounted() {
this.initMap()
this.initDefaultMarkers()
},
beforeUnmount() {
// 组件销毁时清理地图资源,避免内存泄漏
if (this.map) {
this.markers.forEach(item => this.map.removeLayer(item.marker))
this.map.remove()
this.map = null
}
},
methods: {
// 初始化地图
initMap() {
if (!this.$refs.mapContainer) {
console.error('地图容器不存在!')
return
}
// 创建地图实例并定位到中国中心
this.map = L.map(this.$refs.mapContainer).setView(this.chinaCenter, this.defaultZoom)
// 加载内网卫星图瓦片(替换为你的内网瓦片地址)
this.satelliteLayer = L.tileLayer('#######/juicefs-vol-001/public/demo/map/satellite/{z}/{x}/{y}.jpg', {
minZoom: 1,
maxZoom: 10,
tileSize: 256,
noWrap: true, // 禁止地图循环显示
attribution: '离线地图数据'
})
// 加载内网标注瓦片
this.overlayLayer = L.tileLayer('#######/juicefs-vol-001/public/demo/map/overlay/{z}/{x}/{y}.png', {
minZoom: 1,
maxZoom: 5,
tileSize: 256,
noWrap: true,
pane: 'overlayPane', // 标注层独立面板
opacity: 0.8, // 标注透明度
attribution: ''
})
// 默认显示混合图层(卫星图+标注)
this.satelliteLayer.addTo(this.map)
this.overlayLayer.addTo(this.map)
// 添加比例尺控件
L.control.scale().addTo(this.map)
// 瓦片加载失败处理
this.satelliteLayer.on('tileerror', (error) => {
console.warn('卫星图瓦片加载失败:', error)
})
this.overlayLayer.on('tileerror', (error) => {
console.warn('标注瓦片加载失败:', error)
})
},
// 初始化点位标记
initDefaultMarkers() {
// 定义默认图标和激活态图标
const defaultIcon = L.icon({
iconUrl: blueIcon,
shadowUrl: shadowIcon,
iconSize: [25, 41],
iconAnchor: [12, 41],
popupAnchor: [1, -34]
})
const activeRedIcon = L.icon({
iconUrl: redIcon,
shadowUrl: shadowIcon,
iconSize: [25, 41],
iconAnchor: [12, 41],
popupAnchor: [1, -34]
})
// 遍历创建点位标记
this.markerDataList.forEach(markerData => {
const marker = L.marker([markerData.lat, markerData.lng], {
icon: defaultIcon,
draggable: false // 禁止拖拽,如需开启可改为true
}).addTo(this.map)
// 点位点击事件:切换激活态+显示弹窗
marker.on('click', () => {
// 恢复上一个激活点位的默认样式
if (this.activeMarkerId !== null) {
const prevActiveMarker = this.markers.find(item => item.id === this.activeMarkerId)
if (prevActiveMarker) {
prevActiveMarker.marker.setIcon(defaultIcon)
}
}
// 设置当前点位为激活态
marker.setIcon(activeRedIcon)
this.activeMarkerId = markerData.id
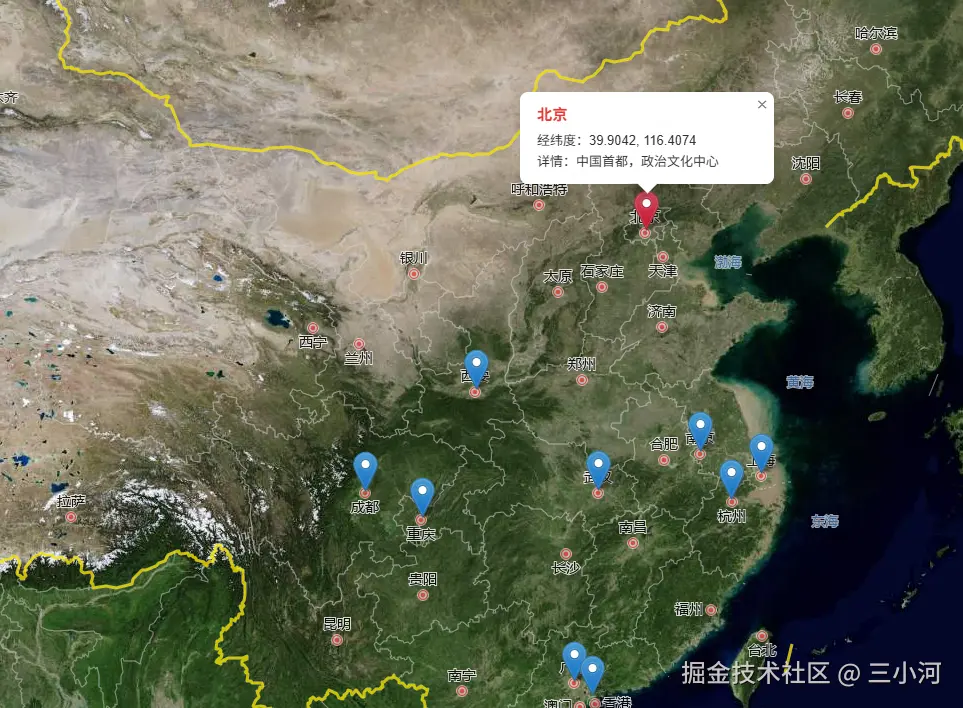
// 绑定并打开自定义弹窗
marker.bindPopup(`
<div class="marker-popup">
<h3 style="margin:0 0 8px 0; color:#e53935;">${markerData.name}</h3>
<p style="margin:4px 0;">经纬度:${markerData.lat.toFixed(4)}, ${markerData.lng.toFixed(4)}</p>
<p style="margin:4px 0;">详情:${markerData.desc}</p>
</div>
`).openPopup()
})
// 存储点位实例,方便后续管理
this.markers.push({
id: markerData.id,
marker: marker,
data: markerData
})
})
},
// 切换地图图层
switchLayer(type) {
if (this.currentLayerType === type) return
// 移除所有瓦片图层
this.map.eachLayer((layer) => {
if (layer instanceof L.TileLayer) {
this.map.removeLayer(layer)
}
})
// 根据类型添加对应图层
switch (type) {
case 'satellite':
this.satelliteLayer.addTo(this.map)
break
case 'overlay':
this.overlayLayer.addTo(this.map)
break
case 'hybrid':
this.satelliteLayer.addTo(this.map)
this.overlayLayer.addTo(this.map)
break
}
this.currentLayerType = type
}
}
}
</script>
<style scoped>
.offline-map-container {
width: 100%;
height: 100vh;
position: relative;
}
.map-container {
width: 100%;
height: 100%;
}
.controls {
position: absolute;
top: 10px;
right: 10px;
z-index: 1000;
background: white;
padding: 10px;
border-radius: 5px;
box-shadow: 0 2px 10px rgba(0, 0, 0, 0.2);
}
.controls button {
margin: 0 5px;
padding: 5px 10px;
cursor: pointer;
border: 1px solid #ccc;
border-radius: 4px;
background: #fff;
transition: all 0.2s;
}
.controls button:hover {
background: #f5f5f5;
border-color: #999;
}
/* 美化Leaflet弹窗样式 */
:deep(.leaflet-popup-content-wrapper) {
border-radius: 8px;
box-shadow: 0 3px 10px rgba(0, 0, 0, 0.15);
}
:deep(.leaflet-popup-content) {
margin: 12px 16px;
width: 220px !important;
}
</style>效果如下
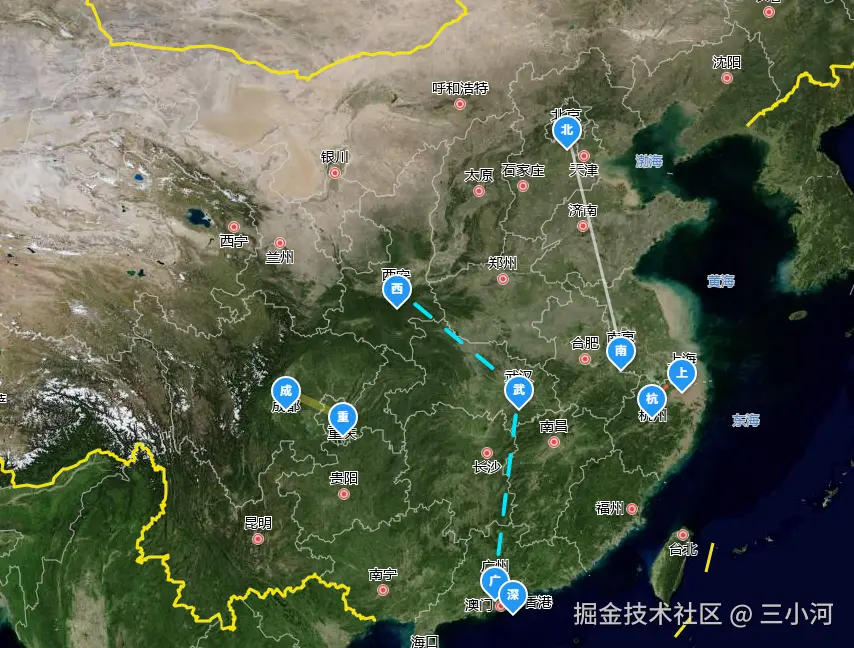
当然也支持 地图打点自定义组件 和 画线
js
<template>
  <div class="offline-map-container">
    <div ref="mapContainer" class="map-container" />

    <div class="controls">
      <button @click="switchLayer('satellite')">卫星图</button>
      <button @click="switchLayer('hybrid')">混合模式</button>
      <button @click="switchLayer('overlay')">仅标注</button>
    </div>
  </div>
</template>

<script>
import Vue from 'vue'
import L from 'leaflet'
import 'leaflet/dist/leaflet.css'
import MapMarker from './MapMarker.vue' // 确保路径正确

export default {
  name: 'OfflineMap',
  data() {
    return {
      map: null,
      satelliteLayer: null,
      overlayLayer: null,
      currentLayerType: 'hybrid',
      chinaCenter: [35.8617, 104.1954],
      defaultZoom: 5,
      markerDataList: [
        { id: 1, name: '北京', lat: 39.9042, lng: 116.4074, desc: '中国首都' },
        { id: 2, name: '上海', lat: 31.2304, lng: 121.4737, desc: '经济中心' },
        { id: 3, name: '广州', lat: 23.1291, lng: 113.2644, desc: '华南门户' },
        { id: 4, name: '深圳', lat: 22.5431, lng: 114.0579, desc: '科技创新之都' },
        { id: 5, name: '成都', lat: 30.5728, lng: 104.0668, desc: '天府之国' },
        { id: 6, name: '重庆', lat: 29.5628, lng: 106.5516, desc: '山城雾都' },
        { id: 7, name: '西安', lat: 34.3416, lng: 108.9398, desc: '十三朝古都' },
        { id: 8, name: '武汉', lat: 30.5928, lng: 114.3055, desc: '九省通衢' },
        { id: 9, name: '杭州', lat: 30.2741, lng: 120.1551, desc: '电商之都' },
        { id: 10, name: '南京', lat: 32.0603, lng: 118.7969, desc: '六朝古都' }
      ],
      markers: [],
      lines: [], // 存储线段实例
      activeMarkerId: null
    }
  },
  mounted() {
    this.initMap()
    this.initDefaultMarkers()
    this.initPolylines() // 初始化各种样式的线
  },
  beforeUnmount() {
    if (this.map) {
      // 销毁 Vue 实例,防止内存泄漏
      this.markers.forEach(item => {
        if (item.vueInstance) item.vueInstance.$destroy()
      })
      this.map.remove()
      this.map = null
    }
  },
  methods: {
    initMap() {
      if (!this.$refs.mapContainer) return
      this.map = L.map(this.$refs.mapContainer).setView(this.chinaCenter, this.defaultZoom)

      // 离线瓦片图层
      this.satelliteLayer = L.tileLayer('##########/juicefs-vol-001/public/demo/map/satellite/{z}/{x}/{y}.jpg', {
        minZoom: 1, maxZoom: 10, tileSize: 256, noWrap: true
      })
      this.overlayLayer = L.tileLayer('##########/juicefs-vol-001/public/demo/map/overlay/{z}/{x}/{y}.png', {
        minZoom: 1, maxZoom: 5, tileSize: 256, noWrap: true, pane: 'overlayPane'
      })

      this.satelliteLayer.addTo(this.map)
      this.overlayLayer.addTo(this.map)
      L.control.scale().addTo(this.map)
    },

    initDefaultMarkers() {
      const MarkerConstructor = Vue.extend(MapMarker)

      this.markerDataList.forEach(markerData => {
        // 创建并挂载 Vue 组件
        const instance = new MarkerConstructor({
          propsData: { name: markerData.name, active: false }
        }).$mount()

        // 使用 L.divIcon 承载 Vue 组件的 DOM
        const icon = L.divIcon({
          html: instance.$el,
          className: 'custom-leaflet-icon', // 必须在 CSS 中重置样式
          iconSize: [30, 30],
          iconAnchor: [15, 15]
        })

        const marker = L.marker([markerData.lat, markerData.lng], { icon }).addTo(this.map)

        marker.on('click', () => {
          // 切换状态逻辑
          if (this.activeMarkerId !== null) {
            const prev = this.markers.find(m => m.id === this.activeMarkerId)
            if (prev) prev.vueInstance.active = false
          }
          instance.active = true
          this.activeMarkerId = markerData.id

          marker.bindPopup(`<b>${markerData.name}</b><br>${markerData.desc}`).openPopup()
        })

        this.markers.push({ id: markerData.id, marker, vueInstance: instance })
      })
    },

    initPolylines() {
      const getPos = (id) => {
        const d = this.markerDataList.find(m => m.id === id)
        return [d.lat, d.lng]
      }

      // 1. 普通白色实线 (北京 - 南京)
      L.polyline([getPos(1), getPos(10)], {
        color: 'white', weight: 3, opacity: 0.6
      }).addTo(this.map)

      // 2. 红色虚线 (上海 - 杭州)
      L.polyline([getPos(2), getPos(9)], {
        color: '#ff5252', weight: 3, dashArray: '10, 10'
      }).addTo(this.map)

      // 3. 蓝色流光动画线 (西安 - 武汉 - 广州)
      L.polyline([getPos(7), getPos(8), getPos(3)], {
        color: '#00e5ff',
        weight: 4,
        dashArray: '15, 15',
        className: 'polyline-path-flow' // 对应 CSS 动画
      }).addTo(this.map)

      // 4. 黄色宽线 (成都 - 重庆)
      L.polyline([getPos(5), getPos(6)], {
        color: '#ffeb3b', weight: 8, opacity: 0.3
      }).addTo(this.map)
    },

    switchLayer(type) {
      if (this.currentLayerType === type) return
      this.map.eachLayer(layer => {
        if (layer instanceof L.TileLayer) this.map.removeLayer(layer)
      })
      if (type === 'satellite' || type === 'hybrid') this.satelliteLayer.addTo(this.map)
      if (type === 'overlay' || type === 'hybrid') this.overlayLayer.addTo(this.map)
      this.currentLayerType = type
    }
  }
}
</script>

<style scoped>
.offline-map-container {
  width: 100%;
  height: 100vh;
  position: relative;
  background: #001529;
  /* 深色底色让线条更明显 */
}

.map-container {
  width: 100%;
  height: 100%;
}

.controls {
  position: absolute;
  top: 10px;
  right: 10px;
  z-index: 1000;
  background: rgba(255, 255, 255, 0.9);
  padding: 10px;
  border-radius: 4px;
}

/* 关键:重置 Leaflet divIcon 的默认样式 */
:deep(.custom-leaflet-icon) {
  background: transparent !important;
  border: none !important;
}

/* 线条流光动画 */
:deep(.polyline-path-flow) {
  stroke-dasharray: 20, 20;
  animation: line-flow 10s linear infinite;
}

@keyframes line-flow {
  from {
    stroke-dashoffset: 400;
  }

  to {
    stroke-dashoffset: 0;
  }
}
</style>
js
<template>
    <div class="custom-marker" :class="{ 'is-active': active }">
        <div class="marker-container">
            <div class="marker-icon">
                <span>{{ name[0] }}</span>
            </div>
            <div class="marker-shadow"></div>
        </div>
    </div>
</template>

<script>
export default {
    props: ['name', 'active']
}
</script>

<style scoped>
.custom-marker {
    width: 30px;
    height: 30px;
    cursor: pointer;
}

.marker-container {
    position: relative;
    display: flex;
    justify-content: center;
}

.marker-icon {
    width: 30px;
    height: 30px;
    background: #2196f3;
    border-radius: 50% 50% 50% 0;
    transform: rotate(-45deg);
    display: flex;
    align-items: center;
    justify-content: center;
    color: white;
    border: 2px solid white;
    box-shadow: 0 2px 5px rgba(0, 0, 0, 0.3);
    transition: all 0.3s;
}

.marker-icon span {
    transform: rotate(45deg);
    font-size: 12px;
    font-weight: bold;
}

/* 激活状态样式 */
.is-active .marker-icon {
    background: #e53935;
    transform: rotate(-45deg) scale(1.2);
}

/* 呼吸动画 */
.is-active .marker-shadow {
    position: absolute;
    top: 50%;
    left: 50%;
    width: 20px;
    height: 20px;
    margin-left: -10px;
    margin-top: -10px;
    background: rgba(229, 57, 53, 0.4);
    border-radius: 50%;
    animation: pulse 1.5s infinite;
}

@keyframes pulse {
    0% {
        transform: scale(1);
        opacity: 1;
    }

    100% {
        transform: scale(3);
        opacity: 0;
    }
}
</style>
效果如下
4. 核心功能说明
- 多图层切换:支持卫星图、标注层、混合模式三种图层切换;
- 点位标记:自定义图标样式,点击点位切换激活态并显示详情弹窗;
- 资源清理:组件销毁时清理地图实例和标记,避免内存泄漏;
- 异常处理:添加瓦片加载失败监听,便于排查内网瓦片访问问题。
二、法律风险与使用注意事项
离线地图方案虽能解决内网使用需求,但地图数据涉及测绘、地理信息安全等敏感领域,切勿 "拿来主义" ,需重点关注以下合规要求:
1. 核心法律风险
(1)测绘资质合规风险
根据《中华人民共和国测绘法》,地图数据属于测绘成果,未经许可下载、使用、传播测绘成果可能涉嫌违法:
- 禁止使用无合法来源的地图瓦片数据;
- 企业若自行采集、处理地理信息数据,需取得对应的测绘资质;
- 严禁下载、使用涉密地理信息(如军事禁区、重要设施坐标)。
(2)数据来源合规风险
- 避免使用盗版下载工具获取地图数据;
- 拒绝使用未经授权的商业地图瓦片(如高德、百度未授权的离线瓦片),否则可能涉及著作权侵权;
- 优先选择有合法授权的开源地图数据(如 OpenStreetMap),并遵守其使用协议。
(3)数据使用范围风险
- 离线地图数据仅限内网自用,禁止对外提供、传播或用于商业盈利;
- 若涉及国境线、行政区域划分等敏感内容,需确保数据符合国家测绘标准,避免出现 "问题地图"。
2. 合规使用建议
-
数据来源审核:
- 确认地图瓦片数据的合法授权,保留授权文件;
- 优先使用国家测绘局认可的地图数据,避免使用境外未经审核的地图数据。
-
使用范围管控:
- 在内网部署时设置访问权限,仅限授权人员使用;
- 明确数据使用目的,仅用于企业内部业务,不扩散、不商用。
-
合规审查:
- 涉及敏感区域(如边境、军事区)的地图数据,需提交测绘主管部门审查;
- 企业建立地图数据使用台账,记录数据来源、使用范围、责任人。
-
替代方案:
- 若有条件,优先采购有内网部署授权的商业地图服务(如高德 / 百度的内网地图解决方案),降低合规风险;
- 对于非核心场景,可使用开源地图框架(如 Leaflet+OpenStreetMap)的合规瓦片,避免法律风险。
三、总结
内网 Web 离线地图的实现核心是 "开源瓦片 + Leaflet",该方案能有效解决外网依赖问题,但法律合规是前提。总结核心要点:
- 技术层面:通过下载瓦片、内网部署、Leaflet 加载,可快速实现离线地图的展示、打点、画线等功能;
- 合规层面:严禁无授权使用地图数据,避免 "问题地图",仅限内网自用,不扩散、不商用;
- 风险管控:优先选择合法授权的数据来源,涉及敏感内容需提交审查,降低法律风险。
在实际落地中,需平衡技术实现与合规要求,切勿因追求功能而忽视地理信息安全与法律规定,确保离线地图的使用符合国家法律法规和企业合规要求。