上图
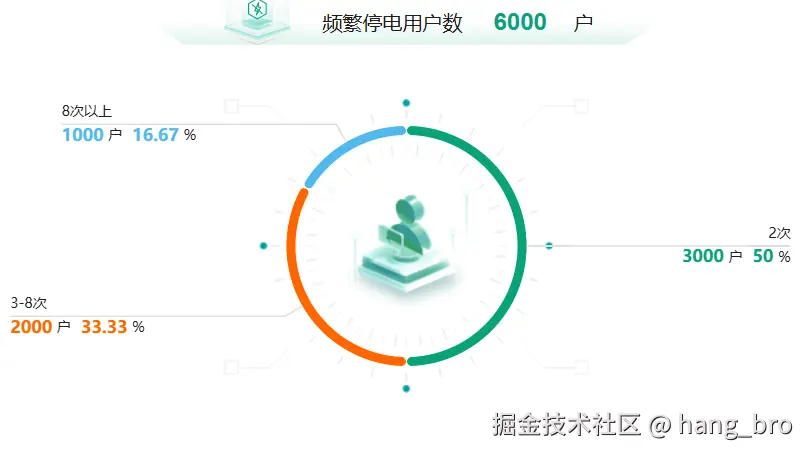
这是最终显示效果
代码
html
<template>
  <div class="w-full h-full py-[10px] px-[20px] flex flex-col gap-[10px]">
    <!-- 上 -->
    <div class="flex flex-col flex-1 bg-white rounded-[6px] px-[18px] py-[20px] shadow-[0px_0px_8px_rgba(0,0,0,0.16)]">
      <div class="flex items-center">
        <img src="@/assets/images/layout/yunhe/dashboard_title.png" class="w-[4px] h-[16px] mr-[10px]" alt="" />
        <h2 class="text-[18px] font-bold">单位汇总</h2>
      </div>
      <div class="flex-1 flex">
        <!-- 左 -->
        <div class="flex-1 flex flex-col items-center justify-center" style="border-right: 2px dashed #dfdfdf">
          <div
            class="flex items-end text-[20px] h-[51px] text-[#1e1e1e] w-[510px] bg-[url('@/assets/images/layout/yunhe/dashboard_top_bg.png')] bg-no-repeat bg-bottom bg-size-[510px_24px]"
          >
            <img
              src="@/assets/images/layout/yunhe/dashboard_top_left.png"
              class="w-[77px] h-[51px] ml-[67px] mr-[27px]"
              alt=""
            />
            <div class="mb-[5px]">
              <span>频繁停电用户数</span>
              <span class="font-bold ml-[31px] mr-[27px] text-[#08a279] text-[24px]">6000</span>
              <span>户</span>
            </div>
          </div>
          <div ref="leftPieChartRef" class="flex-1 w-full flex items-center justify-center"></div>
        </div>
        <!-- 右 -->
        <div class="flex-1 flex flex-col items-center justify-center">
          <div
            class="flex items-end text-[20px] h-[51px] text-[#1e1e1e] w-[510px] bg-[url('@/assets/images/layout/yunhe/dashboard_top_bg.png')] bg-no-repeat bg-bottom bg-size-[510px_24px]"
          >
            <img
              src="@/assets/images/layout/yunhe/dashboard_top_right.png"
              class="w-[77px] h-[51px] ml-[67px] mr-[27px]"
              alt=""
            />
            <div class="mb-[5px]">
              <span>昨日发生停电户数</span>
              <span class="font-bold ml-[31px] mr-[27px] text-[#08a279] text-[24px]">6000</span>
              <span>户</span>
            </div>
          </div>
          <div ref="rightPieChartRef" class="flex-1 w-full flex items-center justify-center">1</div>
        </div>
      </div>
    </div>

    </div>
    <!--  -->
  </div>
</template>
<script lang="ts" setup>
import { useEcharts, EchartsOption } from '@/hooks/useEcharts'
import { useEchartsOption } from '@/hooks/useEchartsOption'
import dashboardPieBg from '@/assets/images/layout/yunhe/dashboard_pie_bg.png'
import * as echarts from 'echarts'
const tableData = ref<any[]>([])
const chartData = ref<any[]>([])
const loading = ref(false)
const barChartRef = ref()
const leftPieChartRef = ref()
const rightPieChartRef = ref()


const getLeftPieOption = (): EchartsOption => {
  return {
    color: ['#08a279', '#ff6600', '#50b9ef'],
    tooltip: {
      trigger: 'item',
    },

    graphic: [
      {
        type: 'image',
        left: 'center', //调整图片位置
        top: 'center', //调整图片位置
        z: -10, //确保图片在饼图下方
        //设置图片样式
        style: {
          image: dashboardPieBg,
          width: 280 * 1.3, // 图片宽度
          height: 226 * 1.3, // 图片高度
        },
      },
    ],

    series: [
      {
        type: 'pie',
        radius: ['55%', '60%'],
        center: ['50%', '50%'],
        avoidLabelOverlap: false,
        itemStyle: {
          borderRadius: 50,
          borderColor: '#fff',
          borderWidth: 1,
        },
        label: {
          show: true,
          fontSize: 16,
          color: '#1e1e1e',
          verticalAlign: 'middle',
          // 启用富文本(关键配置)
          rich: {
            // 定义名称样式
            text: {
              fontSize: 14,
              color: '#1e1e1e',
              padding: [5, 5, 5, 0], // 上右下左内边距
              align: 'left', // 富文本内部左对齐
            },
            textRight: {
              fontSize: 14,
              color: '#1e1e1e',
              padding: [5, 5, 5, 0], // 上右下左内边距
              align: 'right', // 富文本内部右对齐
            },
            // 2次
            count2: {
              fontSize: 17,
              fontWeight: 'bold',
              color: '#08a279',
              align: 'left', // 统一左对齐
            },
            // 3-8次
            count3to8: {
              fontSize: 17,
              fontWeight: 'bold',
              color: '#ff6600',
              align: 'left', // 补充左对齐,避免默认居中
            },
            // 8次以上
            count8More: {
              fontSize: 17,
              fontWeight: 'bold',
              color: '#50b9ef',
              align: 'left', // 补充左对齐
            },
          },
          // 重构 formatter:移除无效空标签,简化逻辑
          formatter: (params) => {
            // 统一获取样式名,简化逻辑
            let styleName = ''
            if (params.name == '2次') styleName = 'count2'
            else if (params.name == '3-8次') styleName = 'count3to8'
            else if (params.name == '8次以上') styleName = 'count8More'

            const content = `{${styleName}|${params.value}} {text|户} {${styleName}|${params.percent}} {text|%}`

            // 最终返回:名称换行 + 数值内容,无多余空标签
            return `{${params.name == '2次' ? 'textRight' : 'text'}|${params.name}}\n${content}`
          },
        },
        labelLine: {
          show: true,
          length: 20,
          length2: 130,
          // smooth: true,
          lineStyle: {
            color: '#dfdfdf',
            width: 1.5,
          },
        },
        labelLayout: function (params: any) {
          const isLeft = params.labelRect.x < leftPieChartInstance.value.getWidth() / 2
          const points = params.labelLinePoints
          // Update the end point.
          points[2][0] = isLeft ? params.labelRect.x : params.labelRect.x + params.labelRect.width
          return {
            labelLinePoints: points,
          }
        },
        data: [
          { value: 3000, name: '2次' },
          { value: 2000, name: '3-8次' },
          { value: 1000, name: '8次以上' },
        ],
      },
    ],
  }
}

const { instance: leftPieChartInstance } = useEcharts(leftPieChartRef, getLeftPieOption())

const getList = () => {
  loading.value = true
  tableData.value = Array.from({ length: 40 }, (_, index) => ({
    gdsName: `供电所${index + 1}`,
    twoTimes: `${index * 100}`,
    threeToEightTimes: `${index * 200}`,
    eightTimesMore: `${index * 300}`,
    threeTimesMoreRatio: `${index * 400}`,
  }))

  loading.value = false
}
const getChartData = () => {
  chartData.value = [
    { value: 16, name: '一级预警' },
    { value: 27, name: '二级预警' },
    { value: 38, name: '三级预警' },
    { value: 22, name: '四级预警' },
  ]
  barChartInstance.value?.setOption(getBarOption())
}
const getLeftPieChartData = () => {}

onMounted(() => {
  getList()

  getLeftPieChartData()
})
</script>
<style lang="scss" scoped></style>