纯前端使用Docxtemplater生成docx报告,包含echart图表
需求:客户需要一个docx报告,后端想让前端码,so...
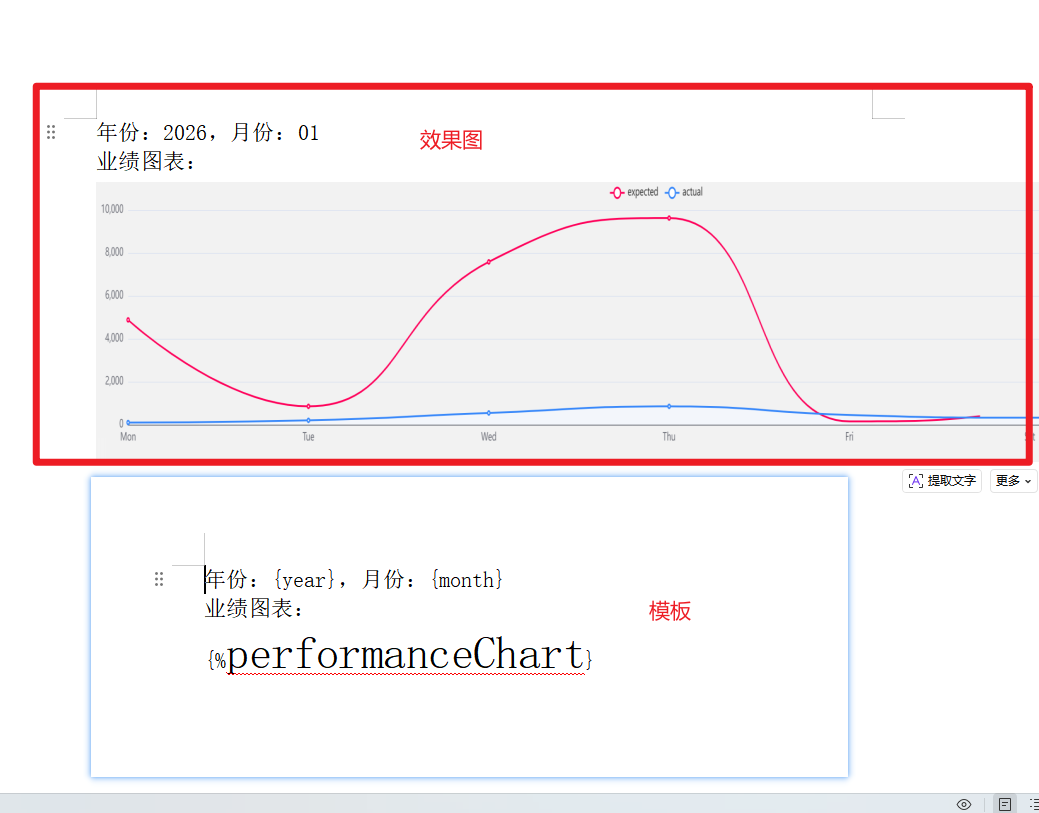
效果图
废话少说,效果图及模板内容!!
代码片段
父页面
javascript
<template>
<div>
<button @click="generateWord" :disabled="isGenerating">
{{ isGenerating ? '生成中...' : '生成并下载Word文件' }}
</button>
<LineChart @setChartInstance="getChartInstance" />
<h2>生成的base64图片</h2>
<!-- 本页面ECharts 容器(用于生成图表) -->
<img v-if="images" :src="images" width="800" height="200">
<!-- 隐藏本页面ECharts 容器(用于生成图表) -->
<!-- <div id="chartContainer" style="width: 800px; height: 400px;display:none;"></div> -->
</div>
</template>
<script>
// 引入依赖(版本统一,避免兼容性问题)
import Docxtemplater from 'docxtemplater'
import PizZip from 'pizzip'
import JSZipUtils from 'jszip-utils'
// 新增依赖:ECharts + 图片处理模块
import * as echarts from 'echarts'
import { saveAs } from 'file-saver'
import LineChart from "./components/LineChart.vue";
import ImageModule from 'docxtemplater-image-module-free'
import { Buffer } from 'buffer';
window.Buffer = Buffer;
console.log('Buffer是否可用:', !!window.Buffer);
export default {
name: 'WordGenerator',
components:{
LineChart
},
data() {
return {
// performanceChart: 'https://fuss10.elemecdn.com/e/5d/4a731a90594a4af544c0c25941171jpeg.jpeg',
isGenerating: false,// 防止重复点击
chartInstance: null, // ECharts 实例
images: ''
}
},
// mounted() {
// // 初始化隐藏的 ECharts 实例(页面加载时创建)
// this.initECharts()
// },
// beforeDestroy() {
// // 销毁 ECharts 实例,避免内存泄漏
// if (this.chartInstance) {
// this.chartInstance.dispose()
// }
// },
methods: {
// 子组件的echart实例
getChartInstance(val){
console.log(val,'子组件的echart实例');
this.chartInstance = val
},
// 本页面初始化 ECharts 实例(生成业绩图表)
// initECharts() {
// const chartDom = document.getElementById('chartContainer')
// this.chartInstance = echarts.init(chartDom)
// // 图表配置项(可根据后端数据动态修改)
// const option = {
// title: { text: '近半年业绩趋势' },
// xAxis: {
// type: 'category',
// data: ['1月', '2月', '3月', '4月', '5月', '6月']
// },
// yAxis: { type: 'value' },
// series: [{
// data: [120, 200, 150, 80, 70, 110],
// type: 'bar',
// smooth: true
// }]
// }
// this.chartInstance.setOption(option)
// },
// 1. 从后端获取数据(模拟接口,替换为真实接口)
async fetchDataFromBackend() {
try {
const res = await this.$axios.get('/api/user/info')
return res.data
} catch (error) {
console.error('获取后端数据失败:', error)
this.$message.error('数据获取失败,请重试')
return null
}
},
// 2. 读取本地Word模板文件(异步封装)
getTemplateFile(path) {
return new Promise((resolve, reject) => {
JSZipUtils.getBinaryContent(path, (error, content) => {
if (error) {
reject(new Error(`模板文件读取失败:${error.message}`))
} else {
resolve(content)
}
})
})
},
// 2. ECharts 图表转 base64 图片(关键步骤)
getChartBase64() {
return new Promise((resolve) => {
// 使用 ECharts 的 getDataURL 方法导出图片
// 可选格式:png(默认)、jpeg,可指定分辨率(pixelRatio)
const base64 = this.chartInstance.getDataURL({
type: 'png',
pixelRatio: 2, // 分辨率(2倍高清,避免模糊)
backgroundColor: '#f2f2f2' // 背景色(默认透明,嵌入Word可能显示异常)
})
resolve(base64)
})
},
// 3. 从后端获取数据(可补充图表相关数据)
async fetchDataFromBackend() {
try {
// const res = await this.$axios.get('/api/user/info') // 后端获取
const res = { year: '张三', month: 28, job: '前端开发', company: 'XX科技', }
// 后端返回数据格式(新增图表相关数据,可选)chartData:替换图表数据
// 示例:{ name: '张三', age: 28, job: '前端开发', company: 'XX科技', chartData: [120,200,150,80,70,110] }
return res // res.data
} catch (error) {
console.error('获取后端数据失败:', error)
this.$message.error('数据获取失败,请重试')
return null
}
},
// 4. 读取本地Word模板文件(原有逻辑不变)
getTemplateFile(path) {
return new Promise((resolve, reject) => {
JSZipUtils.getBinaryContent(path, (error, content) => {
if (error) {
reject(new Error(`模板文件读取失败:${error.message}`))
} else {
resolve(content)
}
})
})
},
// 5. 核心:生成Word(整合图表嵌入逻辑)
async generateWord() {
this.isGenerating = true
try {
// 步骤1:获取后端数据 + 生成图表base64
const data = { year: '2026', month: '01', job: '前端开发', company: 'XX科技', }//await this.fetchDataFromBackend()
if (!data) return
const chartBase64 = await this.getChartBase64()
this.images = chartBase64
// 步骤2:组装填充数据(新增图片字段,与模板占位符{%performanceChart%}对应)
const fillData = {
...data, // 原有文本数据
performanceChart: chartBase64 // 图表base64数据
}
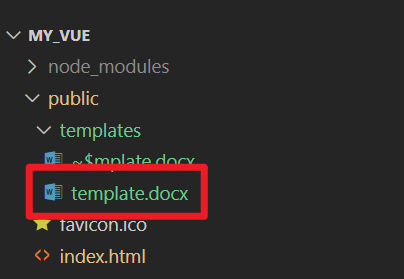
// 步骤3:读取Word模板
const templatePath = '/templates/template.docx'
const content = await this.getTemplateFile(templatePath)
// 步骤4:配置 docxtemplater 图片模块
const imageModuleOptions = {
// 图片处理回调:将base64转为Word可识别的格式
getImage: (tagValue, tagName) => {
// tagValue 即 fillData 中的 chartBase64
const base64Data = tagValue.replace(/^data:image\/png;base64,/, '')
return Buffer.from(base64Data, 'base64')
},
// 设置图片尺寸(单位:pt,1pt≈0.35mm)
getSize: (img, tagValue, tagName) => {
return [800, 200] // [宽度, 高度],可根据需求调整
}
}
// 步骤5:初始化PizZip和Docxtemplater(注入图片模块)
const zip = new PizZip(content)
const doc = new Docxtemplater()
// 加载图片模块
doc.attachModule(new ImageModule(imageModuleOptions))
doc.loadZip(zip)
doc.setOptions({
paragraphLoop: true,
linebreaks: true
})
// 步骤6:填充数据并渲染模板
doc.setData(fillData)
try {
doc.render()
} catch (renderError) {
if (renderError.name === 'TemplateError') {
const errorMsg = `模板标签错误:${renderError.message},错误标签:${renderError.properties.xtag}`
console.error(errorMsg, renderError)
this.$message.error(errorMsg + ',请检查模板占位符是否完整闭合、无多余符号')
return
}
throw renderError
}
// 步骤7:生成并下载Word文件
const out = doc.getZip().generate({
type: 'blob',
mimeType: 'application/vnd.openxmlformats-officedocument.wordprocessingml.document'
})
saveAs(out, `template_${new Date().getTime()}.docx`)
this.$message.success('Word文件生成成功(含图表)!')
} catch (error) {
console.error('生成Word失败:', error)
this.$message.error(`文件生成失败:${error.message}`)
} finally {
this.isGenerating = false
}
}
}
}
</script>代码片段
子组件
javascript
<template>
  <div :class="className" :style="{height:height,width:width}" />
</template>

<script>
import * as echarts from 'echarts'
require('echarts/theme/macarons') // echarts theme
import resize from './mixins/resize'

export default {
  mixins: [resize],
  props: {
    className: {
      type: String,
      default: 'chart'
    },
    width: {
      type: String,
      default: '100%'
    },
    height: {
      type: String,
      default: '300px'
    },
    autoResize: {
      type: Boolean,
      default: true
    },
    chartData: {
      type: Object,
      required: false
    }
  },
  data() {
    return {
      chart: null
    }
  },
  watch: {
    chartData: {
      deep: true,
      handler(val) {
        this.setOptions(val)
      }
    }
  },
  mounted() {
    this.$nextTick(() => {
      this.initChart()
    })
  },
  beforeDestroy() {
    if (!this.chart) {
      return
    }
    this.chart.dispose()
    this.chart = null
  },
  methods: {
    initChart() {
      this.chart = echarts.init(this.$el, 'macarons')
      this.setOptions(this.chartData)
      this.$emit('setChartInstance', this.chart)
    },
    setOptions({ expectedData, actualData } = {}) {
      this.chart.setOption({
        xAxis: {
          data: ['Mon', 'Tue', 'Wed', 'Thu', 'Fri', 'Sat', 'Sun'],
          boundaryGap: false,
          axisTick: {
            show: false
          }
        },
        grid: {
          left: 10,
          right: 10,
          bottom: 20,
          top: 30,
          containLabel: true
        },
        tooltip: {
          trigger: 'axis',
          axisPointer: {
            type: 'cross'
          },
          padding: [5, 10]
        },
        yAxis: {
          axisTick: {
            show: false
          }
        },
        legend: {
          data: ['expected', 'actual']
        },
        series: [{
          name: 'expected', itemStyle: {
            normal: {
              color: '#FF005A',
              lineStyle: {
                color: '#FF005A',
                width: 2
              }
            }
          },
          smooth: true,
          type: 'line',
          // data: expectedData,
          data: [4881,852,7584,9624,154,658,4415],
          animationDuration: 2800,
          animationEasing: 'cubicInOut'
        },
        {
          name: 'actual',
          smooth: true,
          type: 'line',
          itemStyle: {
            normal: {
              color: '#3888fa',
              lineStyle: {
                color: '#3888fa',
                width: 2
              },
              areaStyle: {
                color: '#f3f8ff'
              }
            }
          },
          // data: actualData,
          data: [100, 200,545, 852, 451,325,458],
          animationDuration: 2800,
          animationEasing: 'quadraticOut'
        }]
      })
    }
  }
}
</script>
依赖包及版本
javascript
"dependencies": {
    "buffer": "^6.0.3",
    "core-js": "^3.8.3",
    "docxtemplater": "^3.37.11",
    "docxtemplater-image-module-free": "^1.1.1",
    "echarts": "^5.4.0",
    "echarts-gl": "^2.0.9",
    "echarts-liquidfill": "^3.1.0",
    "element-ui": "^2.15.14",
    "file-saver": "^2.0.5",
    "html2canvas": "^1.4.1",
    "jszip-utils": "^0.1.0",
    "leader-line-vue": "^2.1.1",
    "pizzip": "^3.1.4",
    "relation-graph": "^2.2.11",
    "sass-loader": "^16.0.6",
    "vue": "^2.6.14",
    "vuedraggable": "^2.24.3",
    "ws": "^8.18.3",
    "zrender": "^5.4.4"
  },
扩展表格
javascript
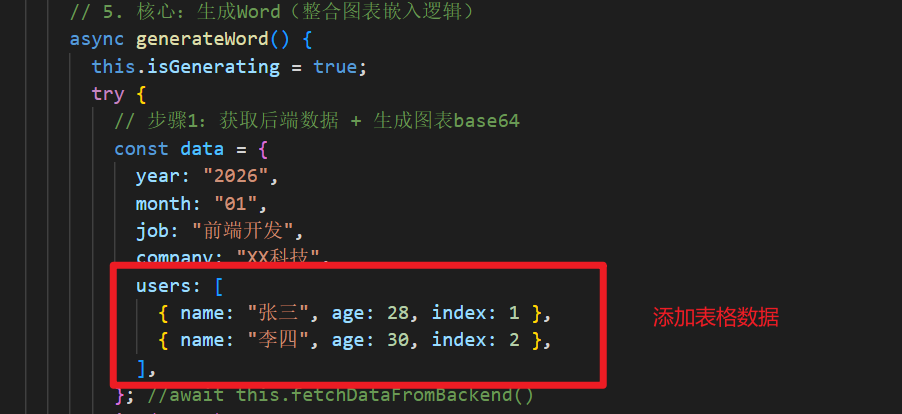
// 添加users表格数据
const data = { year: '2026', month: '01', job: '前端开发', company: 'XX科技',
			users: [
			{name: '张三', age:28, index: 1},
			{name: '李四', age:30, index: 2}
		  ]
}