一、引入echarts组件
在Dcloud插件市场下载echarts插件:https://ext.dcloud.net.cn/plugin?id=4899
下载解压后的文件结构如下图所示:
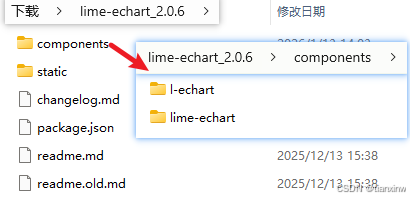
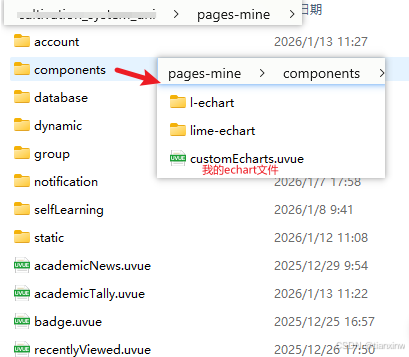
1、将提供的 components 文件复制到你项目对应的components目录中。
目录结构示意图如下:
2、将提供的static / app下的文件复制到你项目对应的 static 目录中。
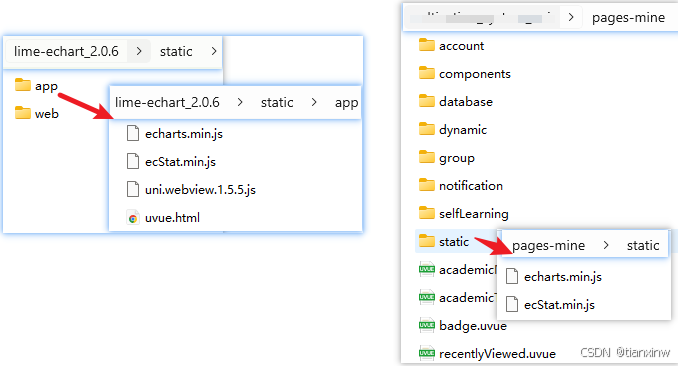
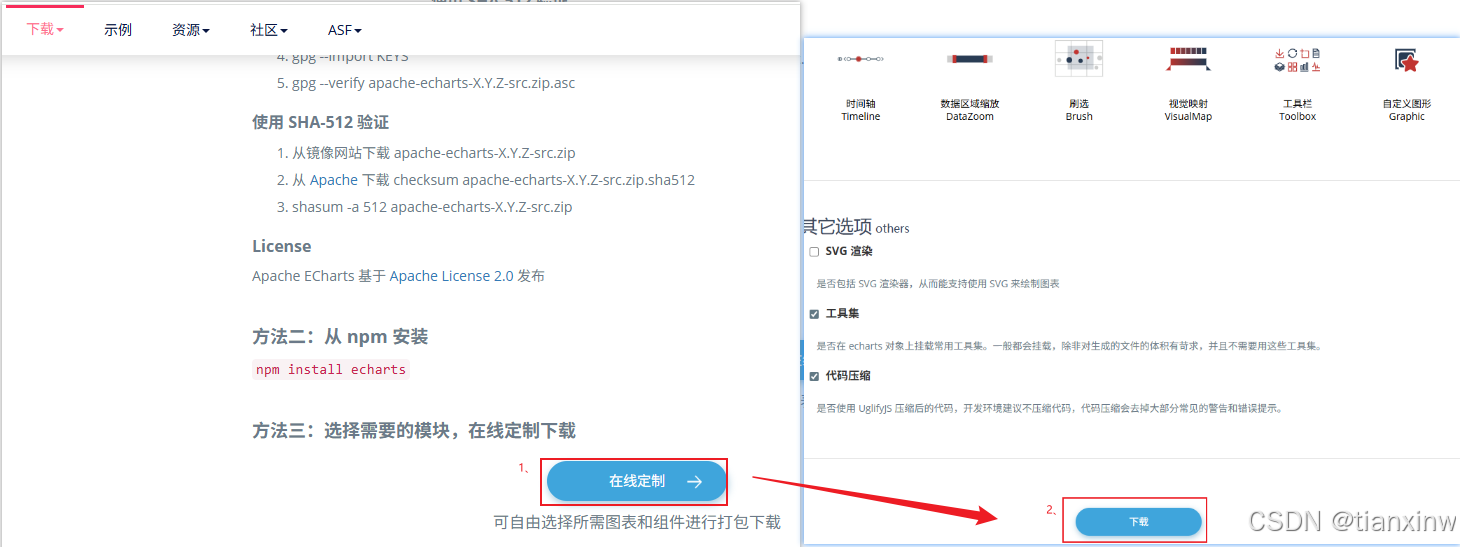
3、打开echarts官网(https://echarts.apache.org/zh/download.html),下载定制图表。
下载后得到echarts.min.js文件,替换原插件中的echarts.min.js(存放于static文件夹下)。
二、引入并实现Echarts图表
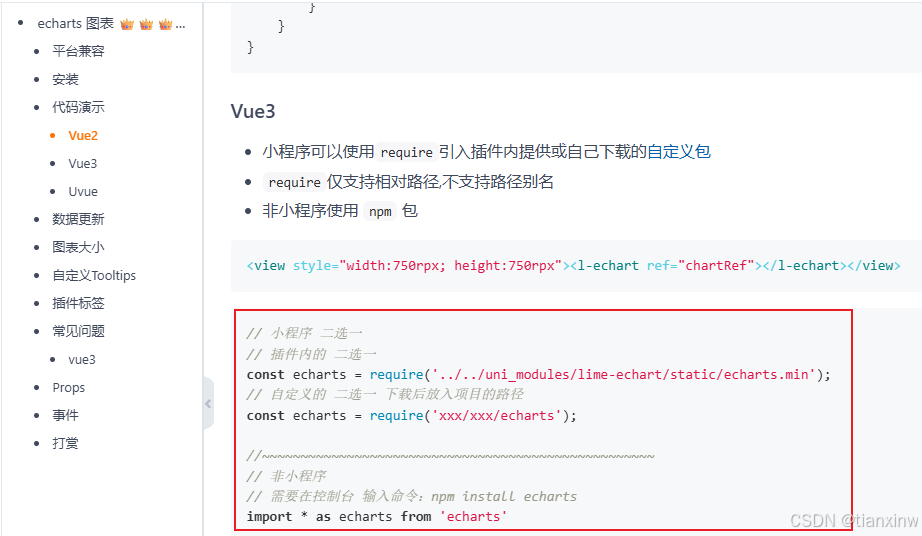
1、引入,参考:https://gitee.com/liangei/lime-echart#vue3
2、实现
父组件:
html
<CustomEcharts
    v-if="progressData.course_finish_data"
	:dataList="progressData.course_finish_data"
	@getFinishIds="getFinishIds"
/>
javascript
<script setup>
    import CustomEcharts from "./components/customEcharts.uvue";

    const getFinishIds = async (val:string) => {
		console.log(val, '获取的ids')
	}
</script>
子组件:
html
<template>
<view class="chart_content_item">
<LEchart ref="chartRef"></LEchart>
</view>
</template>
<script lang="ts" setup>
import LEchart from "./l-echart/l-echart.vue";
import { ref, onMounted, watch } from "vue"
const echarts = require('../static/echarts.min.js')
const chartRef = ref(null);
const chartInstance = ref(null); // 保存图表实例
const props = defineProps({
dataList: Array
});
const emits = defineEmits(['getFinishIds']); // 定义自定义事件
const new_data = Object.values(props.dataList).map(item => ({
value: item.finish_num,
name: item.title,
ids: item.finish_id_str,
// 可以添加其他需要传递的数据
itemData: item
}))
const pieOption = {
tooltip: {
trigger: 'item',
formatter: function(params) {
return `${params.name}: \n ${params.value}人`;
}
},
legend: {
top: '5%',
left: 'center'
},
series: [
{
name: '课程完成情况',
type: 'pie',
radius: ['40%', '70%'], // 饼图的半径
center: ['50%', '90%'], // 饼图的中心(圆心)坐标,[横坐标,纵坐标]。
startAngle: 180, // 起始角度,支持范围[0, 360]
endAngle: 360, // 结束角度,自动计算
itemStyle: {
color: function(params) {
const colorList = [
'#0ca8df', '#ffd10a', '#fb628b',
'#785db0', '#5070dd', '#b6d634',
'#56597a', '#ff9a4d'
];
return colorList[params.dataIndex % colorList.length];
}
},
// data: new_data
data: [
{ value: 1048, name: '完成1-3门课程人数', ids:"1" },
{ value: 735, name: '完成3-6门课程人数', ids:"1,2" },
{ value: 580, name: '完成6-9门课程人数', ids:"3,4" }
],
// 高亮样式
emphasis: {
itemStyle: {
shadowBlur: 10,
shadowOffsetX: 0,
shadowColor: 'rgba(0, 0, 0, 0.5)'
},
label: {
show: true,
fontSize: '16',
fontWeight: 'bold'
}
},
label: {
formatter: '{b}: {c}人 ({d}%)',
fontSize: 12
}
}
]
};
// 初始化图表
const initChart = () => {
if (!chartRef.value) return;
chartRef.value.init(echarts, (chart) => {
chartInstance.value = chart;
chart.setOption(pieOption);
// 绑定点击事件
bindChartEvents(chart);
});
};
// 绑定图表事件
const bindChartEvents = (chart) => {
// 监听饼图点击事件
chart.on('click', function(params) {
const clickedData = params.data; // 获取点击项的数据
const ids = clickedData.ids; // 获取ids
emits('getFinishIds', ids); // 传参
});
// 监听其他事件(可选)
chart.on('mouseover', function(params) {
// 鼠标悬停事件
console.log('鼠标悬停:', params.data);
});
chart.on('mouseout', function(params) {
// 鼠标移出事件
console.log('鼠标移出');
});
};
onMounted(() => {
setTimeout(() => {
initChart();
}, 300);
});
// 监听数据变化
watch(() => props.dataList, (newData) => {
if (!chartInstance.value) return;
// 更新数据
const updatedData = Object.values(newData).map(item => ({
value: item.finish_num,
name: item.title,
ids: item.finish_id_str,
itemData: item
}));
// 更新图表
chartInstance.value.setOption({
series: [{
data: updatedData
}]
});
}, { deep: true });
// 监听配置变化
watch(() => pieOption, (newOption) => {
if (chartInstance.value) {
chartInstance.value.setOption(newOption);
}
}, { deep: true });
// 暴露方法给父组件
defineExpose({
getSelectedData: () => {
if (!chartInstance.value) return null;
// 可以通过其他方式获取当前选中的数据
},
refreshChart: () => {
if (chartInstance.value) {
chartInstance.value.resize();
}
}
});
</script>
<style lang="scss" scoped>
.chart_content_item {
width: 100%;
height: 150px;
}
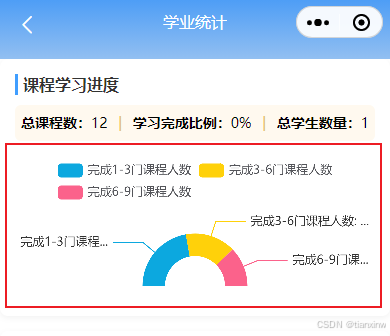
</style>最终实现效果: