研发要求:
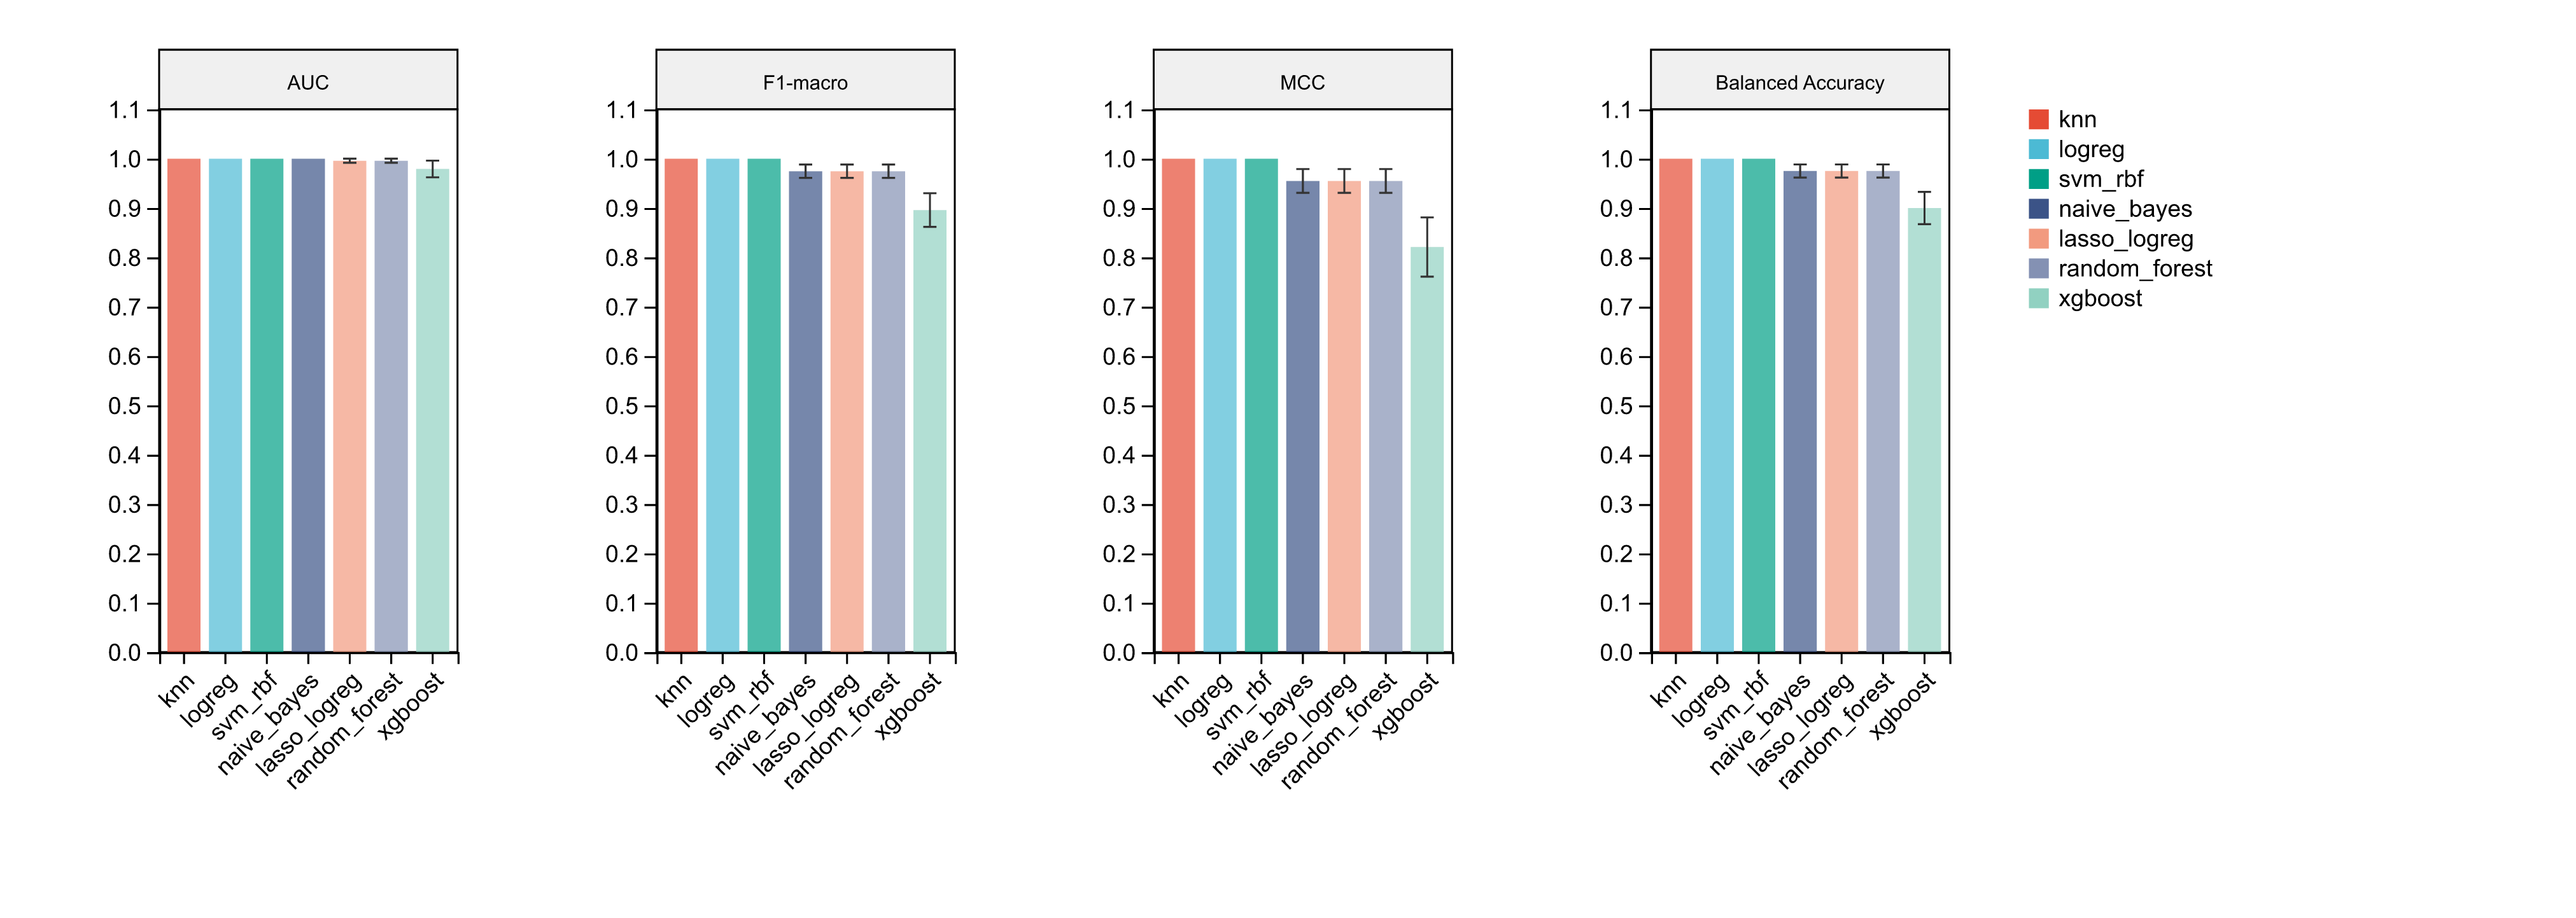
模型指标柱形图
绘图数据库
- 基础结果表格(绘图数据,部分)
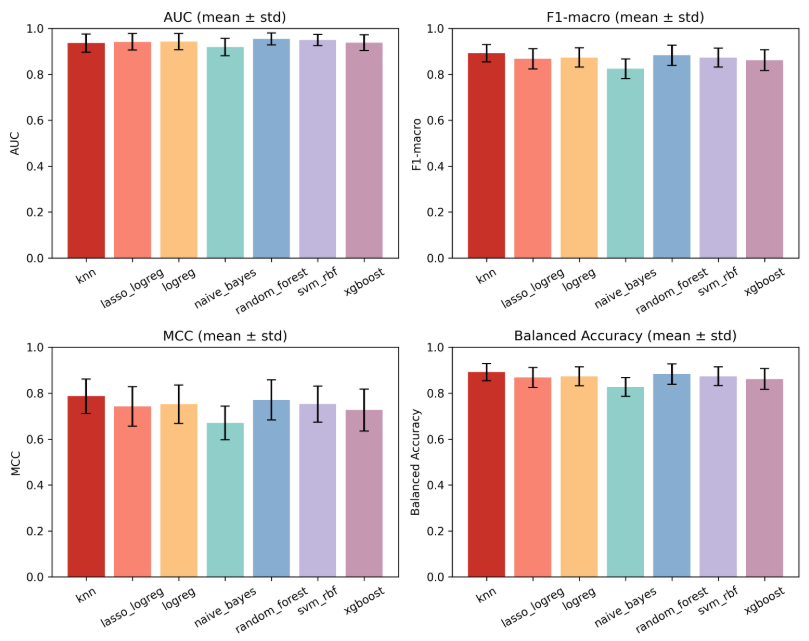
绘图主体数据如下:
|---------------|------------------------|-----------------------|--------------------|----------------------|--------------------|---------------------|--------------------|----------------------|
| model | balanced_accuracy_mean | balanced_accuracy_std | f1_macro_mean | f1_macro_std | mcc_mean | mcc_std | roc_auc_mean | roc_auc_std |
| knn | 0.8916666666666667 | 0.03740066207715475 | 0.8914331740832622 | 0.037508348044268065 | 0.7865403443895932 | 0.07472119925775829 | 0.9360833333333333 | 0.03960989084030596 |
| lasso_logreg | 0.8683333333333334 | 0.04377975178854565 | 0.8677022853200794 | 0.044307950126272325 | 0.7426471658672575 | 0.08591119803594947 | 0.9413333333333332 | 0.035991897236276216 |
| logreg | 0.8733333333333333 | 0.04169046939163962 | 0.8728830870339066 | 0.04190768461644646 | 0.7516841690440129 | 0.0832163789908282 | 0.9421666666666667 | 0.035189114929532 |
| naive_bayes | 0.8266666666666667 | 0.04060553563012715 | 0.823992954443956 | 0.042816724373632875 | 0.6705379609973605 | 0.07282923472391678 | 0.9183333333333333 | 0.037460296442017205 |
| random_forest | 0.8833333333333333 | 0.04398322190931229 | 0.883027227293281 | 0.04414080415129268 | 0.7703477401769945 | 0.08759134382943089 | 0.9540000000000001 | 0.026208300211955762 |
| svm_rbf | 0.8733333333333333 | 0.0406055356301271 | 0.8727085376691789 | 0.04114741004379621 | 0.7526944629079465 | 0.07857788941679007 | 0.9491666666666667 | 0.024470584868562604 |
| xgboost | 0.8616666666666667 | 0.04518480570575317 | 0.8613776825771929 | 0.045142018203609365 | 0.7266974396488949 | 0.0913351224439478 | 0.9371666666666666 | 0.03428955831625435 |
model : 模型 名称 ;
balanced_accuracy _mean: balanced_accuracy 均值 ;
balanced_accuracy _std: balanced_accuracy 标准差 ;
mcc _mean: m c c 均值 ;
m c c _std: m c c 标准差 ;
f 1 _mean: f 1 均值 ;
f 1 _std: f 1 标准差 ;
roc_auc _mean: roc_auc 均值 ;
roc_auc _std: roc_auc 标准差 ;
图形展示示例
常规柱形图
注意:
- 需要 四张 图 拼在 一起 , 不是 分开 的
基础【图表调整】参数需求(可以参考 其他 柱形图 展示 , 按实际研发中进行调整和增加)
>> 图表设置
- 图表宽度
- 图表高度
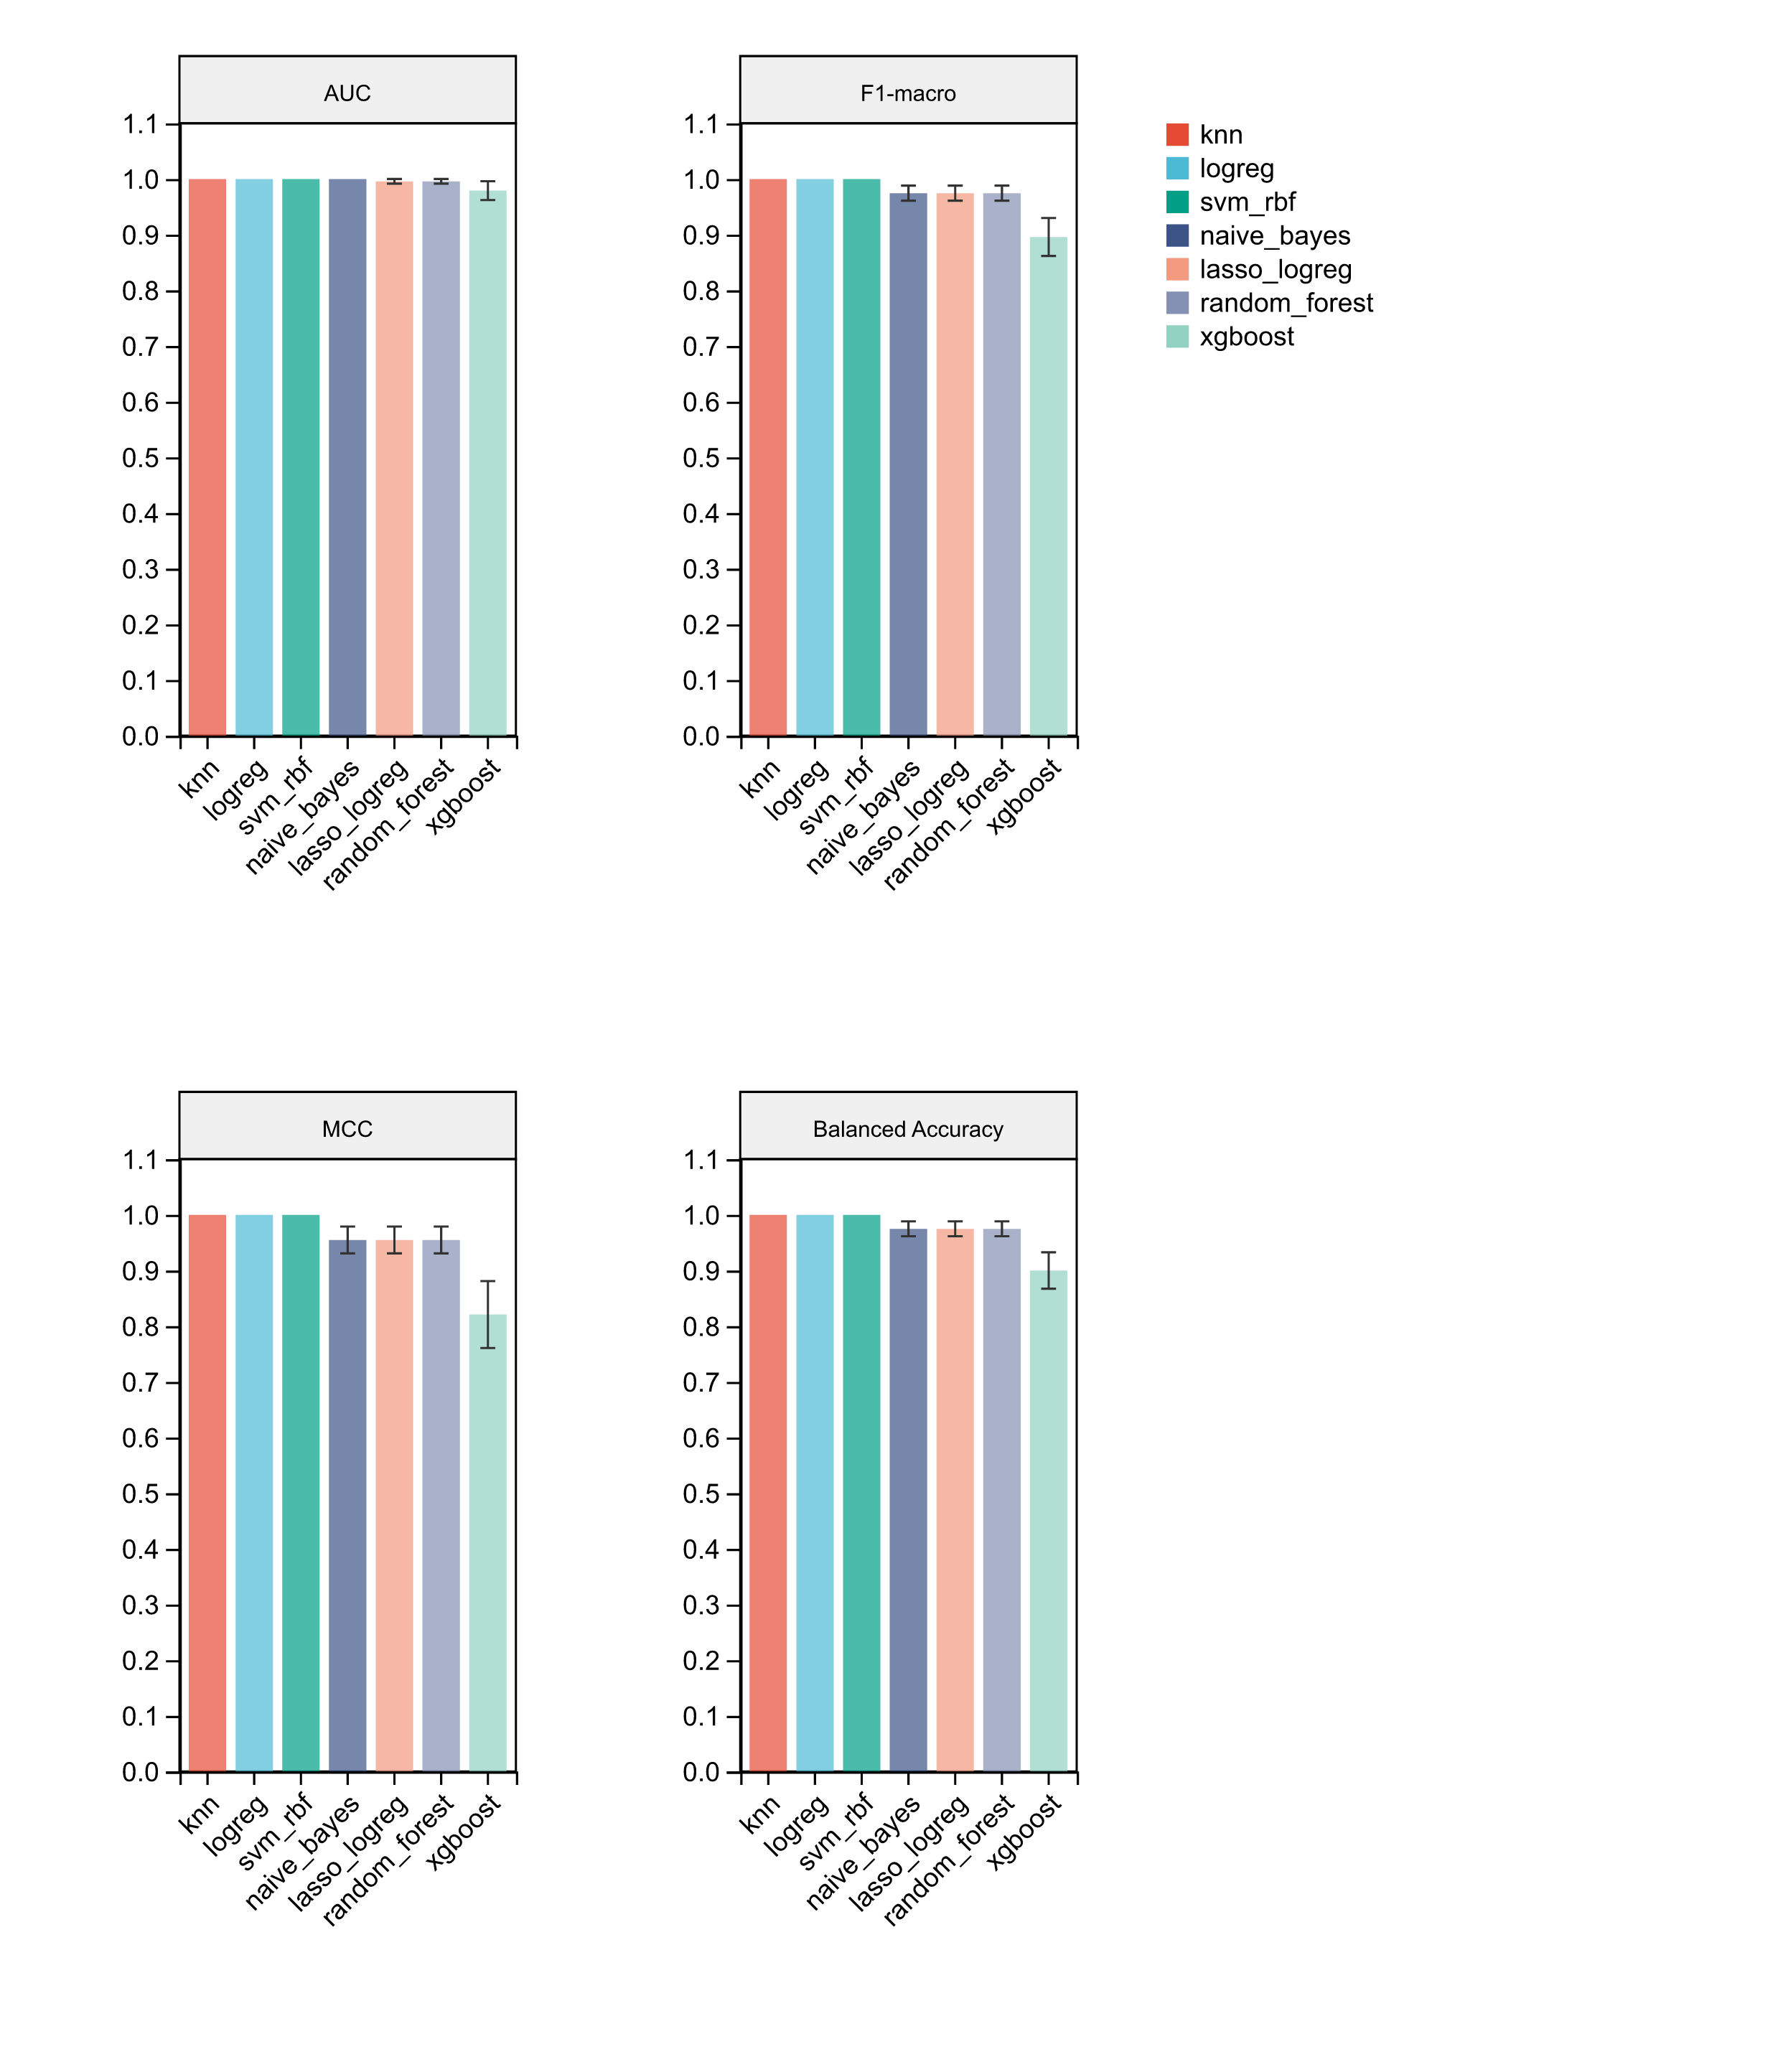
- 每行面板数:只可选1,2,4 (每行的展示图形个数)
- 展示顺序
- 图表样式
- 误差线:标准差、标准误、隐藏
- 填充颜色
- 透明度:分组填充色透明度,范围:0-1
- >> 主标题设置
标题样式
- 标题:主标题内容
- 字体/字号
- 颜色
>> X轴设置
标题样式
- 标题:X标题内容
- 字体/字号
- 颜色
标签样式
- 字体/字号
- 颜色
- 角度:范围 :-90:90
>> Y轴设置
标题样式
- 标题:Y标题内容
- 字体/字号
- 颜色
标签样式
- 字体/字号
- 颜色
模型算法:
- 勾选需要展示的模型
- 图中的模型展示顺序与该顺序对应
下面是项目里封装好的方法 可以直接调用,上代码:
import * as d3 from "d3";
import { getColorList } from "@/utils/commonMethod";

const CombinationBoxPlot = (options = {}) => {
  let data = options.data.plot_data;
  if (!data) return;

  let chartHeight = 140 * (options.params.height / 100) + 250;
  let chartWidth = 250 * (options.params.width / 100);

  function getSvgTextStyle({
    text = "",
    fontSize = 14,
    fontFamily = "Arial",
    fontWeight = "normal"
  } = {}) {
    const svg = d3
      .select("body")
      .append("svg")
      .attr("class", "get-svg-text-style");

    const textStyle = svg
      .append("text")
      .text(text)
      .attr("font-size", fontSize)
      .attr("font-family", fontFamily)
      .attr("font-weight", fontWeight)
      .node()
      .getBBox();

    svg.remove();

    return {
      width: textStyle.width,
      height: textStyle.height
    };
  }

  function getSvgBandAxisStyle({
    fontSize = 20,
    orient = "bottom",
    fontFamily = "Arial",
    fontWeight = "normal",
    rotate = 0,
    domain = ["A", "B", "C"],
    range = [0, 200]
  } = {}) {
    let axis;
    let svg = d3
      .select("body")
      .append("svg")
      .attr("width", 200)
      .attr("height", 100)
      .attr("transform", "translate(300, 200)")
      .attr("class", "get-svg-axis-style");

    let scale = d3.scaleBand().domain(domain).range(range);

    if (orient === "bottom" || orient === "top") {
      axis = d3.axisBottom(scale);
    } else {
      axis = d3.axisLeft(scale);
    }

    let axisStyle = svg
      .append("g")
      .call(axis)
      .call(g => {
        g.selectAll("text")
          .attr("fill", "#555")
          .attr("font-size", fontSize)
          .attr("font-family", fontFamily)
          .attr("font-weight", fontWeight)
          .attr(
            "tmpY",
            g.select("text").attr("tmpY") || g.select("text").attr("dy")
          )
          .attr(
            "dy",
            rotate > 70 && rotate <= 90
              ? "0.35em"
              : rotate >= -90 && rotate < -70
              ? "0.4em"
              : g.select("text").attr("tmpY")
          )
          .attr(
            "text-anchor",
            orient === "left"
              ? "end"
              : rotate
              ? rotate > 0
                ? "start"
                : "end"
              : "middle"
          )
          .attr(
            "transform",
            `translate(0, 0) ${
              rotate ? `rotate(${rotate} 0 ${g.select("text").attr("y")})` : ""
            }`
          );
      })
      .node()
      .getBBox();

    svg.remove();
    return {
      width: axisStyle.width,
      height: axisStyle.height
    };
  }

  let {
    margin = { top: 30, right: 20, bottom: 40, left: 50 },
    panelsPerRow = 3,
    boxHeightRatio = 0.7,
    background = "#f0f0f0",
    plotAreaBg = "white",
    areaBgOpacity = 1,
    isBorder = true,
    isSmallTitle = true,
    grid = false,
    isError = true,
    barWidthRatio = 1,
    barOpacity = 0.7,
    errorType = "error",
    errorLineColor = "#333",
    errorLineWidth = 1,

    x_title = "",
    x_title_color = "#000",
    x_title_font = "Arial",
    x_title_size = 14,
    x_text_rotate = 90,
    x_text_color = "#000000",
    x_text_size = 12,
    x_text_font = "Arial",

    y_title = "",
    y_title_color = "#000",
    y_title_font = "Arial",
    y_title_size = 14,
    y_text_color = "#000000",
    y_text_size = 12,
    y_text_font = "Arial",
    main_title = "",
    main_title_color = "#000",
    main_title_font = "Arial",
    main_title_size = 14,

    panel_title_font = "Arial",
    panel_title_size = 10,
    panel_title_color = "#000000",

    legend_title = "",
    legend_title_color = "#000",
    legend_title_size = 14,
    legend_title_font = "Arial",
    legend_text_color = "#000000",
    legend_text_font = "Arial",
    legend_text_size = 12,
    group_order
  } = options.params;

  x_text_rotate = -x_text_rotate;
  margin.left = isSmallTitle ? 80 : margin.left;
  let colors = getColorList(options.params.color);

  const box = document.querySelector(options.container);

  if (!box || !options.data.plot_data) return;

  const metrics = [...new Set(data.map(d => d.metric))];
  const dataByMetric = d3.group(data, d => d.metric);
  const allGroups = [
    ...new Set(
      metrics.flatMap(metric => dataByMetric.get(metric).map(d => d.group))
    )
  ];
  const xDomain =
    Array.isArray(group_order) && group_order.length
      ? group_order.filter(g => allGroups.includes(g))
      : allGroups;

  const yDomain = options.data.yDomain;

  let mainTitleH = getSvgTextStyle({
    text: main_title,
    fontSize: main_title_size,
    fontFamily: main_title_font
  }).height;

  mainTitleH = main_title ? mainTitleH + 10 : 0;

  const xAxisH = getSvgBandAxisStyle({
    fontSize: x_text_size,
    fontFamily: x_text_font,
    rotate: x_text_rotate,
    domain: xDomain
  }).height;

  const maxLength = data.reduce(
    (max, item) => Math.max(max, String(item.group).length),
    0
  );
  const legendWidth = 100 + maxLength * 15;
  const chartsPerRow = panelsPerRow
    ? Math.min(panelsPerRow, metrics.length)
    : Math.floor(window.innerWidth / chartWidth);

  const totalWidth = chartsPerRow * chartWidth + legendWidth;
  const rows = Math.ceil(metrics.length / chartsPerRow);
  const totalHeight = rows * (chartHeight + xAxisH) + mainTitleH;

  !d3.select(options.container).select("svg").empty() &&
    d3.select(options.container).select("svg").remove();

  const svg = d3
    .select(options.container)
    .append("svg")
    .attr("width", totalWidth)
    .attr("height", totalHeight)
    .attr("id", "combination-boxPlot");

  svg
    .append("text")
    .attr("class", "main-title")
    .attr(
      "x",
      isSmallTitle
        ? (totalWidth - legendWidth) / 2
        : (totalWidth - legendWidth + margin.left) / 2
    )
    .attr("y", mainTitleH)
    .text(main_title)
    .attr("text-anchor", "middle")
    .attr("font-family", main_title_font)
    .attr("font-size", main_title_size)
    .attr("fill", main_title_color);

  const chartVerticalOffset = mainTitleH + 25;

  metrics.forEach((metric, index) => {
    const metricData = dataByMetric.get(metric);
    const orderMap = new Map(xDomain.map((g, idx) => [g, idx]));
    metricData.sort(
      (a, b) => (orderMap.get(a.group) ?? 0) - (orderMap.get(b.group) ?? 0)
    );
    const row = Math.floor(index / chartsPerRow);
    const col = index % chartsPerRow;

    const xOffset = col * chartWidth;
    const yOffset = row * (chartHeight + xAxisH) + chartVerticalOffset;

    const chart = svg
      .append("g")
      .attr("transform", `translate(${xOffset},${yOffset})`);
    const titleWidth = isSmallTitle
      ? chartWidth - margin.left - margin.right
      : 0;

    chart
      .append("rect")
      .attr("class", "title-background")
      .attr("x", margin.left)
      .attr("y", 0)
      .attr("width", titleWidth)
      .attr("height", 30)
      .style("fill", background)
      .style("stroke", "#000")
      .style("stroke-width", "1px")
      .style("stroke-top", "1px")
      .style("stroke-left", "1px")
      .style("stroke-right", "1px");

    if (isSmallTitle) {
      chart
        .append("text")
        .attr("class", "chart-title")
        .attr("x", margin.left + titleWidth / 2)
        .attr("y", 20)
        .text(metric)
        .attr("font-family", panel_title_font)
        .attr("font-size", panel_title_size)
        .attr("fill", panel_title_color)
        .style("text-anchor", "middle");
    }

    const plotHeight = chartHeight * boxHeightRatio;

    if (!isSmallTitle) {
      margin.left = 100;
      chart
        .append("line")
        .attr("x1", chartWidth - margin.right)
        .attr("y1", margin.top)
        .attr("x2", chartWidth - margin.right)
        .attr("y2", margin.top + plotHeight)
        .style("stroke", "#000")
        .style("stroke-width", "1px");

      chart
        .append("line")
        .attr("x1", margin.left)
        .attr("y1", margin.top)
        .attr("x2", chartWidth - margin.right)
        .attr("y2", margin.top)
        .style("stroke", "#000")
        .style("stroke-width", "1px");

      chart
        .append("text")
        .attr("class", "x-axis-title")
        .attr("x", margin.left + (chartWidth - margin.left - margin.right) / 2)
        .attr("y", margin.top + plotHeight + margin.bottom + 15)
        .text(x_title)
        .attr("text-anchor", "middle")
        .attr("font-family", x_title_font)
        .attr("font-size", x_title_size)
        .attr("fill", x_title_color);

      chart
        .append("text")
        .attr("class", "y-axis-title")
        .attr("x", -margin.top - plotHeight / 2)
        .attr("y", margin.left / 2 - 15)
        .text(y_title)
        .attr("text-anchor", "middle")
        .attr("transform", "rotate(-90)")
        .attr("font-family", y_title_font)
        .attr("font-size", y_title_size)
        .attr("fill", y_title_color);
    }

    const xScale = d3
      .scaleBand()
      .domain(xDomain)
      .range([margin.left, chartWidth - margin.right])
      .padding(0.2);

    let metricYDomain = yDomain[metric];
    const yScale = d3
      .scaleLinear()
      .domain(metricYDomain)
      .range([plotHeight, 0]);

    chart
      .append("rect")
      .attr("x", margin.left)
      .attr("y", margin.top)
      .attr("width", titleWidth)
      .attr("height", plotHeight)
      .style("fill", plotAreaBg)
      .style("opacity", areaBgOpacity);

    if (grid) {
      chart
        .selectAll(".y-grid")
        .data(yScale.ticks())
        .enter()
        .append("line")
        .attr("class", "y-grid")
        .attr("x1", margin.left)
        .attr("x2", chartWidth - margin.right)
        .attr("y1", d => margin.top + yScale(d))
        .attr("y2", d => margin.top + yScale(d))
        .style("stroke", "rgba(0, 0, 0, 0.2)")
        .style("stroke-opacity", 1)
        .style("stroke-width", 0.5);

      chart
        .selectAll(".x-grid")
        .data(xScale.domain())
        .enter()
        .append("line")
        .attr("class", "x-grid")
        .attr("x1", d => xScale(d) + xScale.bandwidth() / 2)
        .attr("x2", d => xScale(d) + xScale.bandwidth() / 2)
        .attr("y1", margin.top)
        .attr("y2", margin.top + plotHeight)
        .style("stroke", "rgba(0, 0, 0, 0.2)")
        .style("stroke-opacity", 1)
        .style("stroke-width", 0.5);
    }

    if (isBorder) {
      chart
        .append("rect")
        .attr("x", margin.left)
        .attr("y", margin.top)
        .attr("width", titleWidth)
        .attr("height", plotHeight)
        .style("stroke", "#000")
        .style("stroke-width", "1px")
        .style("fill", "none");
    }

    metricData.forEach((d, i) => {
      if (!d.bar) return;

      const color = colors[i % colors.length];
      const center = xScale(d.group) + xScale.bandwidth() / 2;
      const barWidth = xScale.bandwidth() * barWidthRatio;

      chart
        .append("rect")
        .attr("class", "bar")
        .attr("x", center - barWidth / 2)
        .attr("y", margin.top + yScale(d.bar.value))
        .attr("width", barWidth)
        .attr("height", plotHeight - yScale(d.bar.value))
        .attr("fill", color)
        .attr("opacity", barOpacity);

      if (isError && d.bar.error) {
        const currentYDomain = yDomain[metric];

        let errorTop = 0;
        let errorBottom = 0;

        if (errorType === "error") {
          errorTop = Math.min(d.bar.value + d.bar.error, currentYDomain[1]);
          errorBottom = Math.max(d.bar.value - d.bar.error, currentYDomain[0]);
        } else {
          errorTop = Math.min(d.bar.value + d.bar.deviation, currentYDomain[1]);
          errorBottom = Math.max(
            d.bar.value - d.bar.deviation,
            currentYDomain[0]
          );
        }

        chart
          .append("line")
          .attr("class", "error-line")
          .attr("x1", center)
          .attr("x2", center)
          .attr("y1", margin.top + yScale(errorTop))
          .attr("y2", margin.top + yScale(errorBottom))
          .attr("stroke", errorLineColor)
          .attr("stroke-width", errorLineWidth);

        chart
          .append("line")
          .attr("class", "error-cap")
          .attr("x1", center - barWidth / 5)
          .attr("x2", center + barWidth / 5)
          .attr("y1", margin.top + yScale(errorTop))
          .attr("y2", margin.top + yScale(errorTop))
          .attr("stroke", errorLineColor)
          .attr("stroke-width", errorLineWidth);

        chart
          .append("line")
          .attr("class", "error-cap")
          .attr("x1", center - barWidth / 5)
          .attr("x2", center + barWidth / 5)
          .attr("y1", margin.top + yScale(errorBottom))
          .attr("y2", margin.top + yScale(errorBottom))
          .attr("stroke", errorLineColor)
          .attr("stroke-width", errorLineWidth);
      }
    });

    const xAxis = d3.axisBottom(xScale);

    chart
      .append("g")
      .attr("class", "x-axis")
      .attr("transform", `translate(0,${margin.top + plotHeight})`)
      .call(xAxis)
      .call(g => {
        g.selectAll(".tick text")
          .attr("fill", x_text_color)
          .attr("font-size", x_text_size)
          .attr("font-family", x_text_font)
          .each(function () {
            const text = d3.select(this);
            text.attr("tmpY", text.attr("dy") || 0);
          })
          .attr("dy", (d, i, nodes) => {
            const text = d3.select(nodes[i]);
            const rotate = x_text_rotate;
            if (rotate > 70 && rotate <= 90) return "0.35em";
            if (rotate >= -90 && rotate < -70) return "0.4em";
            return text.attr("tmpY");
          })
          .attr("text-anchor", () =>
            x_text_rotate ? (x_text_rotate > 0 ? "start" : "end") : "middle"
          )
          .attr("transform", (d, i, nodes) =>
            x_text_rotate
              ? `rotate(${x_text_rotate} 0 ${d3.select(nodes[i]).attr("y")})`
              : ""
          );
      });

    const yAxis = d3.axisLeft(yScale);
    chart
      .append("g")
      .attr("class", "y-axis")
      .attr("transform", `translate(${margin.left},${margin.top})`)
      .call(yAxis)
      .selectAll(".tick text")
      .attr("fill", y_text_color)
      .attr("font-size", y_text_size)
      .attr("font-family", y_text_font);
  });

  const legend = svg
    .append("g")
    .attr("class", "legend")
    .attr(
      "transform",
      `translate(${chartsPerRow * chartWidth + 20}, ${
        30 + chartVerticalOffset
      })`
    );

  legend
    .append("text")
    .attr("class", "legend-title")
    .attr("x", 0)
    .attr("y", -15)
    .text(legend_title)
    .attr("font-family", legend_title_font)
    .attr("fill", legend_title_color)
    .attr("font-size", legend_title_size);

  const groups = xDomain;

  groups.forEach((group, i) => {
    const legendItem = legend
      .append("g")
      .attr("transform", `translate(0, ${i * 15})`);

    legendItem
      .append("rect")
      .attr("width", 10)
      .attr("height", 10)
      .attr("fill", colors[i % colors.length]);

    legendItem
      .append("text")
      .attr("class", "legend-item")
      .attr("x", 15)
      .attr("y", 9)
      .text(group)
      .attr("font-family", legend_text_font)
      .attr("fill", legend_text_color)
      .attr("font-size", legend_text_size);
  });
};

export default CombinationBoxPlot;
调用:
 multibarplot({
              container: "#barplot-container",
              data: plots,
              params: chartParam
            });
参数:
const bar_params = {
    width: 100,
    height: 100,
    panelsPerRow: 2,
    type: "barPlot",
    grid: false,
    meanValue: false,
    color: "NPG",
    barOpacity: 0.7,
    signColor: "rgba(0, 0, 0, 0.8)",
    background: "#f0f0f0",
    borderSelect: "fill",
    isSmallTitle: true,
    errorType: "error",
    group_order: [],

    main_title: "",
    main_title_font: "Arial",
    main_title_color: "#000000",
    main_title_size: 12,

    x_title: "111",
    x_title_size: 12,
    x_title_font: "Arial",
    x_title_color: "#000000",
    x_text_font: "Arial",
    x_text_size: 12,
    x_text_color: "#000000",
    x_text_rotate: 45,

    y_title: "222",
    y_title_size: 12,
    y_title_font: "Arial",
    y_title_color: "#000000",
    y_text_font: "Arial",
    y_text_size: 12,
    y_text_color: "#000000",

    legend_title: "",
    legend_title_size: 12,
    legend_title_font: "Arial",
    legend_title_color: "#000000",
    legend_text_font: "Arial",
    legend_text_size: 12,
    legend_text_color: "#000000"
  };
效果图: