摘要
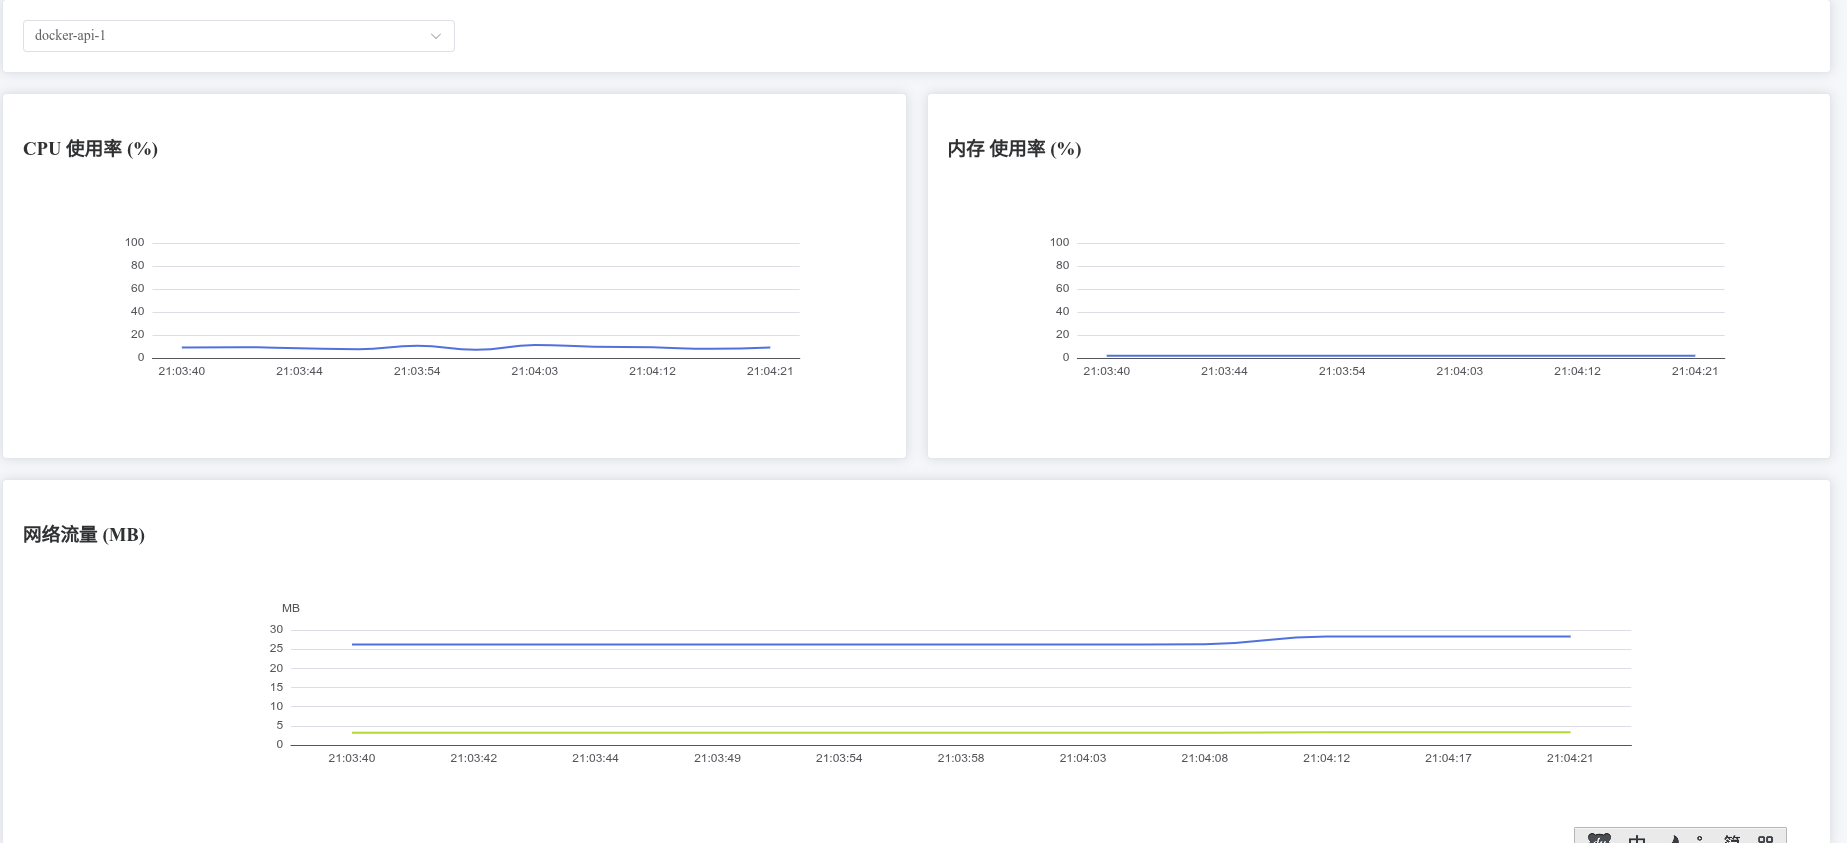
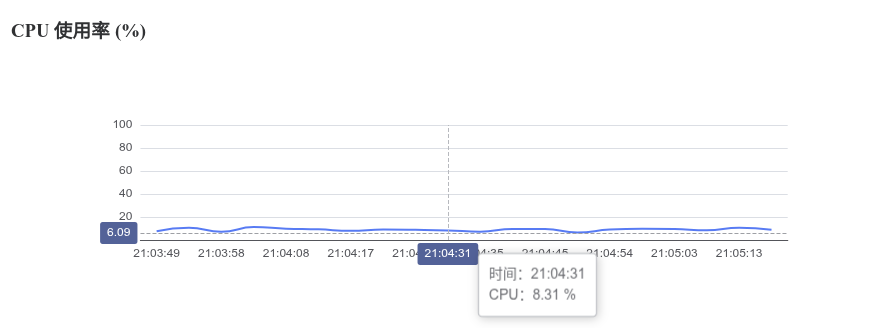
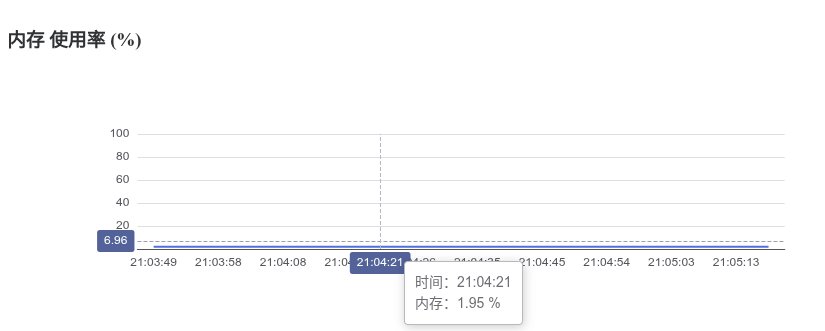
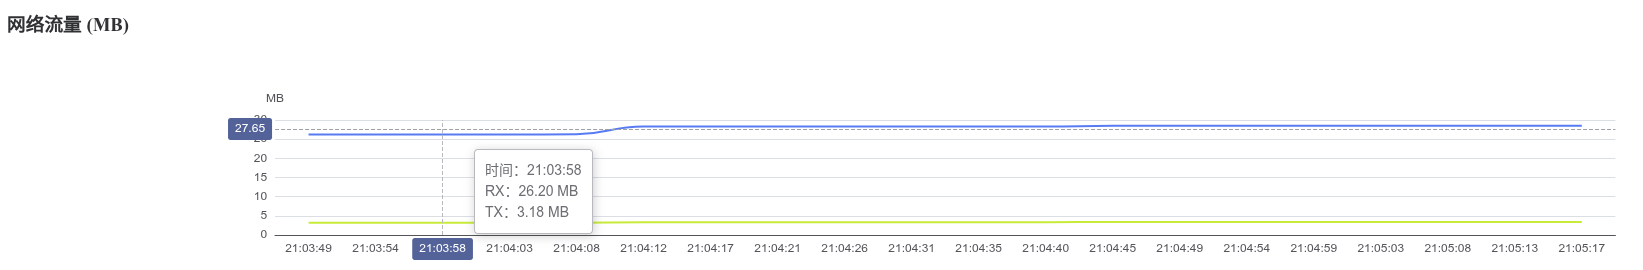
本文介绍了如何使用 Python Tornado + WebSocket + Vue3 + Element Plus + ECharts 搭建一个 Docker 实时监控单页面应用。通过 Tornado 后端收集 docker stats 数据并通过 WebSocket 推送给前端,前端使用 Vue3 和 ECharts 渲染 CPU、内存、网络流量 等实时图表,并支持 容器选择 和 鼠标悬停 tooltip 查看详细数值。
一、项目目录
text
docker-monitor/
├── templates/
│   └── index.html      # 前端单页面 HTML
└── websocket_server.py # 后端 Tornado WebSocket 服务
说明:
templates/:存放 HTML 页面websocket_server.py:负责 WebSocket 服务、收集 Docker stats 数据
二、后端:websocket_server.py
python
import json
import asyncio
import pytz
from datetime import datetime
from subprocess import Popen, PIPE, STDOUT
from tornado import websocket, web, ioloop

# ----------------------
# 工具函数:执行命令
# ----------------------
def run_cmd(cmd):
    p = Popen(cmd, shell=True, stdout=PIPE, stderr=STDOUT)
    out, _ = p.communicate()
    return out.decode()

# ----------------------
# 全局存储 WebSocket 客户端
# ----------------------
clients = set()

# ----------------------
# 收集 Docker stats
# ----------------------
def collect_stats(container=None):
    fmt = '{{.BlockIO}}#{{.CPUPerc}}#{{.Container}}#{{.ID}}#{{.MemPerc}}#{{.MemUsage}}#{{.Name}}#{{.NetIO}}#{{.PIDs}}'
    cmd = f'docker stats {container or ""} --no-stream --format "{fmt}"'
    out = run_cmd(cmd)

    now = datetime.now(pytz.timezone('Asia/Shanghai'))
    result = []

    for line in out.splitlines():
        ls = line.split("#")
        if len(ls) < 9:
            continue
        result.append({
            "name": ls[6],
            "id": ls[3],
            "time": now.strftime('%H:%M:%S'),
            "cpu": float(ls[1].replace("%", "")),
            "mem": float(ls[4].replace("%", "")),
            "net": ls[7],
            "block": ls[0],
            "pids": int(ls[8])
        })

    return result

# ----------------------
# 循环推送数据给所有客户端
# ----------------------
async def push_loop():
    while True:
        data = collect_stats()
        if clients:
            msg = json.dumps({"type": "stats", "data": data})
            for c in clients:
                c.write_message(msg)
        await asyncio.sleep(2)  # 每 2 秒推送一次

# ----------------------
# WebSocket Handler
# ----------------------
class WSHandler(websocket.WebSocketHandler):
    def check_origin(self, origin):
        return True  # 允许跨域

    def open(self):
        clients.add(self)
        print("客户端连接")

    def on_close(self):
        clients.discard(self)
        print("客户端断开")

    def on_message(self, message):
        msg = json.loads(message)
        if msg.get("type") == "single":
            data = collect_stats(msg["container"])
            self.write_message(json.dumps({"type": "single", "data": data}))

# ----------------------
# HTTP 页面 Handler
# ----------------------
class IndexHandler(web.RequestHandler):
    def get(self):
        self.render("index.html")

# ----------------------
# 启动 Tornado 应用
# ----------------------
def make_app():
    return web.Application(
        [
            (r"/", IndexHandler),
            (r"/ws", WSHandler),
        ],
        template_path="templates",
        debug=True
    )

if __name__ == "__main__":
    app = make_app()
    app.listen(9001)
    ioloop.IOLoop.current().spawn_callback(push_loop)
    print("Tornado 服务已启动,访问 http://localhost:9001")
ioloop.IOLoop.current().start()三、前端:templates/index.html
html
<!DOCTYPE html>
<html lang="zh">
<head>
  <meta charset="UTF-8">
  <title>Docker 实时监控</title>

  <!-- Element Plus -->
  <link rel="stylesheet" href="https://unpkg.com/element-plus/dist/index.css">
  <script src="https://unpkg.com/vue@3/dist/vue.global.js"></script>
  <script src="https://unpkg.com/element-plus"></script>

  <!-- ECharts -->
  <script src="https://cdn.jsdelivr.net/npm/echarts/dist/echarts.min.js"></script>

  <style>
    body {
      background: #f5f7fa;
      padding: 20px;
    }
    .chart {
      height: 260px;
    }
  </style>
</head>

<body>
<div id="app">
  <!-- 顶部选择 -->
  <el-card>
    <el-row :gutter="20">
      <el-col :span="6">
        <el-select v-model="current" placeholder="选择容器" @change="switchContainer" style="width:100%">
          <el-option
            v-for="c in containers"
            :key="c"
            :label="c"
            :value="c"
          />
        </el-select>
      </el-col>
    </el-row>
  </el-card>

  <!-- CPU / MEM -->
  <el-row :gutter="20" style="margin-top:20px">
    <el-col :span="12">
      <el-card>
        <h3>CPU 使用率 (%)</h3>
        <div id="cpu" class="chart"></div>
      </el-card>
    </el-col>

    <el-col :span="12">
      <el-card>
        <h3>内存 使用率 (%)</h3>
        <div id="mem" class="chart"></div>
      </el-card>
    </el-col>
  </el-row>

  <!-- 网络 -->
  <el-row :gutter="20" style="margin-top:20px">
    <el-col :span="24">
      <el-card>
        <h3>网络流量 (MB)</h3>
        <div id="net" class="chart"></div>
      </el-card>
    </el-col>
  </el-row>
</div>

<script>
const { createApp, ref, onMounted } = Vue

createApp({
  setup() {
    const containers = ref([])
    const current = ref(null)
    let ws = null

    const times = []
    const cpuData = []
    const memData = []
    const netRx = []
    const netTx = []

    let cpuChart, memChart, netChart

    function parseNet(v) {
      if (!v) return 0
      let n = parseFloat(v)
      if (v.includes('KB')) return n / 1024
      if (v.includes('GB')) return n * 1024
      return n
    }

    /* ========== 初始化图表(重点:tooltip 就在这里) ========== */
    function initCharts() {
      cpuChart = echarts.init(document.getElementById('cpu'))
      memChart = echarts.init(document.getElementById('mem'))
      netChart = echarts.init(document.getElementById('net'))

      cpuChart.setOption({
        tooltip: {
          trigger: 'axis',
          axisPointer: { type: 'cross' },
          formatter: p => `时间:${p[0].axisValue}<br/>CPU:${p[0].data.toFixed(2)} %`
        },
        xAxis: { type: 'category' },
        yAxis: { max: 100 },
        series: [{ type: 'line', smooth: true, symbol: 'none' }]
      })

      memChart.setOption({
        tooltip: {
          trigger: 'axis',
          axisPointer: { type: 'cross' },
          formatter: p => `时间:${p[0].axisValue}<br/>内存:${p[0].data.toFixed(2)} %`
        },
        xAxis: { type: 'category' },
        yAxis: { max: 100 },
        series: [{ type: 'line', smooth: true, symbol: 'none' }]
      })

      netChart.setOption({
        tooltip: {
          trigger: 'axis',
          axisPointer: { type: 'cross' },
          formatter: params => {
            let html = `时间:${params[0].axisValue}<br/>`
            params.forEach(p => {
              html += `${p.seriesName}:${p.data.toFixed(2)} MB<br/>`
            })
            return html
          }
        },
        xAxis: { type: 'category' },
        yAxis: { name: 'MB' },
        series: [
          { name: 'RX', type: 'line', smooth: true, symbol: 'none' },
          { name: 'TX', type: 'line', smooth: true, symbol: 'none' }
        ]
      })
    }

    function resetData() {
      times.length = cpuData.length = memData.length = netRx.length = netTx.length = 0
    }

    function updateCharts(item) {
      times.push(item.time)
      cpuData.push(item.cpu)
      memData.push(item.mem)

      const [rx, tx] = item.net.split('/')
      netRx.push(parseNet(rx))
      netTx.push(parseNet(tx))

      if (times.length > 20) {
        times.shift()
        cpuData.shift()
        memData.shift()
        netRx.shift()
        netTx.shift()
      }

      cpuChart.setOption({ xAxis:{data:times}, series:[{data:cpuData}] })
      memChart.setOption({ xAxis:{data:times}, series:[{data:memData}] })
      netChart.setOption({
        xAxis:{data:times},
        series:[
          { data: netRx },
          { data: netTx }
        ]
      })
    }

    function switchContainer() {
      resetData()
      ws.send(JSON.stringify({ type:'single', container: current.value }))
    }

    function connectWS() {
      ws = new WebSocket(
        (location.protocol === 'https:' ? 'wss' : 'ws')
        + '://' + location.host + '/ws'
      )

      ws.onmessage = e => {
        const msg = JSON.parse(e.data)
        if (!msg.data) return

        msg.data.forEach(item => {
          if (!containers.value.includes(item.name)) {
            containers.value.push(item.name)
            if (!current.value) {
              current.value = item.name
              ws.send(JSON.stringify({ type:'single', container: current.value }))
            }
          }

          if (item.name === current.value) {
            updateCharts(item)
          }
        })
      }
    }

    onMounted(() => {
      initCharts()
      connectWS()
    })

    return { containers, current, switchContainer }
  }
}).use(ElementPlus).mount('#app')
</script>
</body>
</html>
四、运行步骤
- 安装依赖
bash
pip install tornado pytz- 确保 Docker 可执行
bash
docker ps- 启动 Tornado 服务
bash
python websocket_server.py-
浏览器访问
-
查看实时监控图表、容器选择下拉框