html
<div ref="echartRef" style="height: 50px;"></div>js
const init = async () => {
let option = {
tooltip: {
trigger: 'axis'
},
grid: {
left: '-15px',
right: '-15px',
top: '1px',
bottom: '1px',
},
xAxis: {
show: false, // 隐藏xAxis
type: 'category',
data: ['1', '2', '3', '4', '5', '6', '7', '8', '9', '10', '11', '12'], // 示例数据,可根据需要调整或移除
scale: true
},
yAxis: {
show: false, // 隐藏yAxis
type: 'value',
scale: true
},
series: [{
data: [10, 199, 4, 0, 55, 0, 34, 0, 88, 0, 99, 0], // 示例数据,可根据需要调整或移除
type: 'line', // 指定图表类型为折线图
smooth: true, // 使折线平滑显示
showSymbol: false,
itemStyle: {
normal: {
opacity: 1 // 默认状态完全不透明
},
emphasis: {
opacity: 0 // 鼠标悬停时透明度为0,隐藏小圆点
}
}
}],
};
var myChart = echarts.init(proxy.$refs.echartRef);
myChart.clear();
nextTick(() => {
myChart.setOption(option);
})
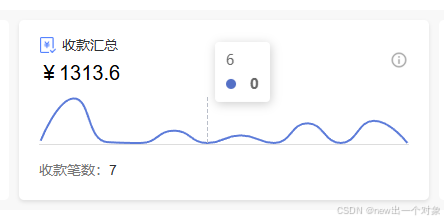
};效果图