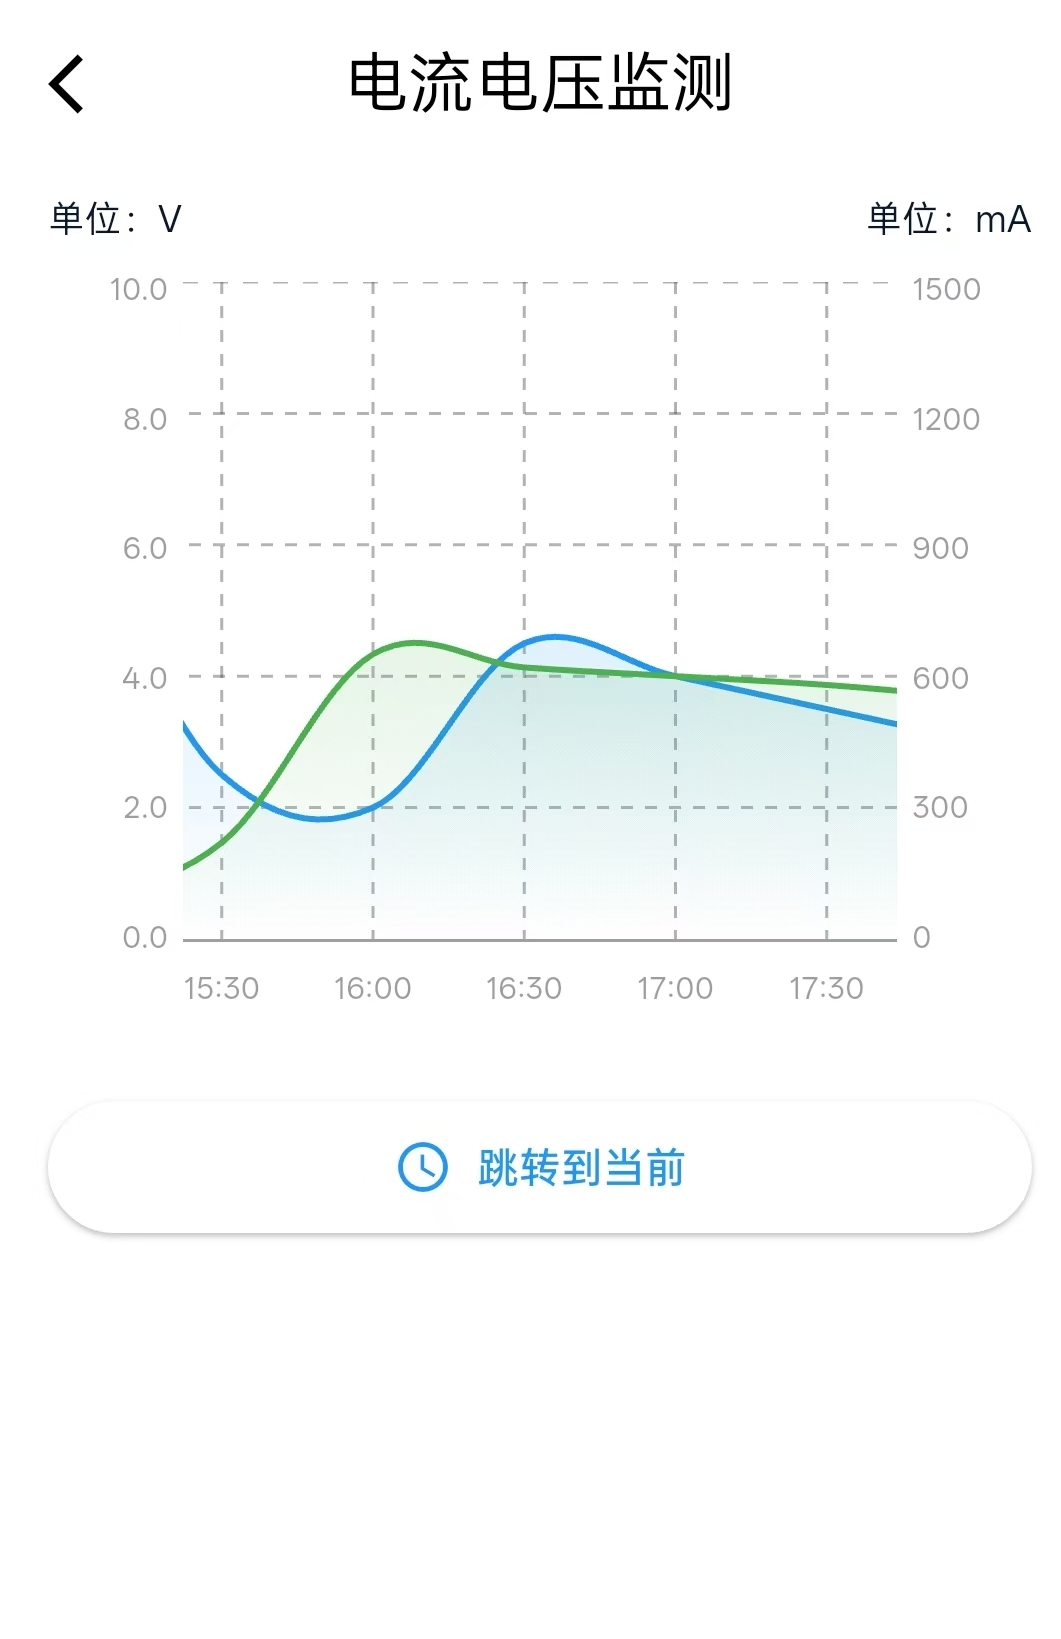
效果图
实现步骤
1.引入外部类
fl_chart: ^0.66.02.准备电压数据点和电流数据点
Dart
//电压数据点 (蓝色)
  List<FlSpot> _voltageData = [
    FlSpot(0, 0.5),   // 00:00
    FlSpot(1, 1.2),   // 00:30
    FlSpot(2, 2.0),   // 01:00
    FlSpot(3, 1.8),   // 01:30
    FlSpot(4, 2.5),   // 02:00
    FlSpot(5, 3.0),   // 02:30
    FlSpot(6, 2.8),   // 03:00
    FlSpot(7, 2.2),   // 03:30
    FlSpot(8, 2.5),   // 04:00
    FlSpot(9, 4.0),   // 04:30
    FlSpot(10, 4.5),  // 05:00
    FlSpot(11, 3.0),  // 05:30
    FlSpot(12, 3.5),  // 06:00
    FlSpot(13, 2.0),  // 06:30
    FlSpot(14, 6.5),  // 07:00
    FlSpot(15, 2.0),  // 07:30
    FlSpot(16, 7.5),  // 08:00
    FlSpot(17, 8.0),  // 08:30
    FlSpot(18, 8.5),  // 09:00
    FlSpot(19, 9.0),  // 09:30
    FlSpot(20, 9.5),  // 10:00
    FlSpot(21, 0.0),  // 10:30
    FlSpot(22, 9.8),  // 11:00
    FlSpot(23, 9.5),  // 11:30
    FlSpot(24, 9.0),  // 12:00
    FlSpot(25, 8.5),  // 12:30
    FlSpot(26, 8.0),  // 13:00
    FlSpot(27, 7.5),  // 13:30
    FlSpot(28, 7.0),  // 14:00
    FlSpot(29, 6.5),  // 14:30
    FlSpot(30, 6.0),  // 15:00
    FlSpot(31, 2.5),  // 15:30
    FlSpot(32, 2.0),  // 16:00
    FlSpot(33, 4.5),  // 16:30
    FlSpot(34, 4.0),  // 17:00
    FlSpot(35, 3.5),  // 17:30
    FlSpot(36, 3.0),  // 18:00
    FlSpot(37, 2.5),  // 18:30
    FlSpot(38, 2.0),  // 19:00
    FlSpot(39, 1.5),  // 19:30
    FlSpot(40, 1.0),  // 20:00
    FlSpot(41, 0.5),  // 20:30
    FlSpot(42, 0.0),  // 21:00
    FlSpot(43, 9.5),  // 21:30
    FlSpot(44, 9),  // 22:00
    FlSpot(45, 2.5),  // 22:30
    FlSpot(46, 8.0),  // 23:00
    FlSpot(47, 2.5),  // 23:30
    FlSpot(48, 7.0),  // 24:00
  ];

  //电流数据点(绿色)
  List<FlSpot> _currentData = [
    FlSpot(0, 1500),    // 00:00
    FlSpot(1, 1450),    // 00:30
    FlSpot(2, 1400),    // 01:00
    FlSpot(3, 1380),    // 01:30
    FlSpot(4, 1350),    // 02:00
    FlSpot(5, 1320),    // 02:30
    FlSpot(6, 1300),    // 03:00
    FlSpot(7, 1280),    // 03:30
    FlSpot(8, 1250),    // 04:00
    FlSpot(9, 1220),    // 04:30
    FlSpot(10, 1200),   // 05:00
    FlSpot(11, 1180),   // 05:30
    FlSpot(12, 1150),   // 06:00
    FlSpot(13, 1120),   // 06:30
    FlSpot(14, 1100),   // 07:00
    FlSpot(15, 1080),   // 07:30
    FlSpot(16, 1050),   // 08:00
    FlSpot(17, 1020),   // 08:30
    FlSpot(18, 1000),   // 09:00
    FlSpot(19, 980),    // 09:30
    FlSpot(20, 950),    // 10:00
    FlSpot(21, 920),    // 10:30
    FlSpot(22, 900),    // 11:00
    FlSpot(23, 880),    // 11:30
    FlSpot(24, 850),    // 12:00
    FlSpot(25, 820),    // 12:30
    FlSpot(26, 800),    // 13:00
    FlSpot(27, 780),    // 13:30
    FlSpot(28, 750),    // 14:00
    FlSpot(29, 110),      // 14:30
    FlSpot(30, 100),    // 15:00
    FlSpot(31, 220),    // 15:30
    FlSpot(32, 650),    // 16:00
    FlSpot(33, 620),    // 16:30
    FlSpot(34, 600),    // 17:00
    FlSpot(35, 580),    // 17:30
    FlSpot(36, 550),    // 18:00
    FlSpot(37, 520),    // 18:30
    FlSpot(38, 500),    // 19:00
    FlSpot(39, 480),    // 19:30
    FlSpot(40, 450),    // 20:00
    FlSpot(41, 420),    // 20:30
    FlSpot(42, 400),    // 21:00
    FlSpot(43, 380),    // 21:30
    FlSpot(44, 350),    // 22:00
    FlSpot(45, 320),    // 22:30
    FlSpot(46, 300),    // 23:00
    FlSpot(47, 280),    // 23:30
    FlSpot(48, 250),    // 24:00
  ];
3.定义一些必要的变量
Dart
 final ScrollController _scrollController = ScrollController(); //滚动控制器

  // 电压值的范围
  final double _voltageMinY = 0;
  final double _voltageMaxY = 10;

  //电流值的范围
  final double _currentMinY = 0;
  final double _currentMaxY = 1500;
4.销毁操作
Dart
  @override
  void dispose() {
    _scrollController.dispose();
    super.dispose();
  }
5.构建折线图 ****
Dart
1.左侧Y轴
2.图表区域
3.右侧Y轴
Widget _buildFixedYAxisChart() {
return Container(
height: 260,
child: Row(
children: [
// 左侧固定Y轴 - 电压轴
Container(
width: 40,
padding: const EdgeInsets.only(bottom: 30),
color: Colors.white,
child: Column(
mainAxisAlignment: MainAxisAlignment.spaceBetween,
crossAxisAlignment: CrossAxisAlignment.end,
children: [
Text("${_voltageMaxY.toStringAsFixed(1)}",
style: const TextStyle(
fontSize: 10,
color: Colors.grey,
),
),
Text("${(_voltageMinY + (_voltageMaxY - _voltageMinY) * 0.8).toStringAsFixed(1)}",
style: const TextStyle(
fontSize: 10,
color: Colors.grey,
),
),
Text("${(_voltageMinY + (_voltageMaxY - _voltageMinY) * 0.6).toStringAsFixed(1)}",
style: const TextStyle(
fontSize: 10,
color: Colors.grey,
),
),
Text("${(_voltageMinY + (_voltageMaxY - _voltageMinY) * 0.4).toStringAsFixed(1)}",
style: const TextStyle(
fontSize: 10,
color: Colors.grey,
),
),
Text("${(_voltageMinY + (_voltageMaxY - _voltageMinY) * 0.2).toStringAsFixed(1)}",
style: const TextStyle(
fontSize: 10,
color: Colors.grey,
),
),
Text("${_voltageMinY.toStringAsFixed(1)}",
style: const TextStyle(
fontSize: 10,
color: Colors.grey,
),
),
],
),
),
SizedBox(width: 5),
// 可滚动的图表区域
Expanded(
child: SingleChildScrollView(
scrollDirection: Axis.horizontal, //水平滚动
controller: _scrollController, //滚动控制器
child: Container(
width: 48 * 50.0 + 60,
height: 250,
padding: const EdgeInsets.symmetric(horizontal: 20.0),
child: Stack(
children: [
LineChart( //折线图主体
LineChartData(
lineTouchData: LineTouchData(
enabled: false, //不让点击折线图显示相关点的数据
),
gridData: FlGridData(
show: true, //显示网格系统
drawHorizontalLine: true, //绘制水平网格线
drawVerticalLine: true, //绘制垂直网格线
horizontalInterval:(_voltageMaxY - _voltageMinY) / 5, //水平线之间的间隔距离
verticalInterval: 1, //垂直线之间的间隔距离 - 每1个X轴单位画一条垂直线
getDrawingHorizontalLine: (value) { //水平线样式自定义
return FlLine(
color: Color(0xFF404040).withOpacity(0.4),
strokeWidth: 1,
dashArray: [4,4]
);
},
getDrawingVerticalLine: (value) { //垂直线样式自定义
return FlLine(
color: Color(0xFF404040).withOpacity(0.4),
strokeWidth: 1,
dashArray: [4,4]
);
},
),
titlesData: FlTitlesData( //坐标轴标题配置
show: true, //显示坐标轴标题
bottomTitles: AxisTitles( //底部X轴标题
sideTitles: SideTitles(
showTitles: true, //显示刻度标签
reservedSize: 30, //为标签预留空间
interval: 1, //每一个单位显示一个标签
getTitlesWidget: (value, meta) { //自定义标签被内容
//判断是否为偶数
if (value.toInt() % 2 == 0) {
final hour = value ~/ 2; //除2取整得到小时数
return Padding(
padding: const EdgeInsets.only(top: 8.0), //顶部间距
child: Text(
'${hour.toString().padLeft(2, '0')}:00',
style: const TextStyle(
fontSize: 10,
color: Colors.grey,
),
),
);
}
//判断是否为奇数
if (value.toInt() % 2 == 1) {
final hour = value ~/ 2;
return Padding(
padding: const EdgeInsets.only(top: 8.0),
child: Text(
'${hour.toString().padLeft(2, '0')}:30',
style: const TextStyle(
fontSize: 10,
color: Colors.grey,
),
),
);
}
return Container(); //其他情况返回空容器
},
),
),
//上左右不显示标题
leftTitles: const AxisTitles(
sideTitles: SideTitles(showTitles: false),
),
rightTitles: const AxisTitles(
sideTitles: SideTitles(showTitles: false),
),
topTitles: const AxisTitles(
sideTitles: SideTitles(showTitles: false),
),
),
borderData: FlBorderData( //边框显示
show: true,
border: Border(
bottom: BorderSide( //显示下边框
color: Color(0xFF404040).withOpacity(0.5),
width: 1,
),
top: BorderSide.none,
left: BorderSide.none,
right: BorderSide.none,
),
),
minX: 0, //x轴最小值
maxX: 48, //X轴最大值
minY: _voltageMinY, //Y轴最小值 ,使用的是电压的值
maxY: _voltageMaxY, //Y轴最大值
lineBarsData: [
// 电压线 - 蓝色
LineChartBarData(
spots: _voltageData, //使用预先定义的电压数据点数组
isCurved: true, //使用曲线链接点
curveSmoothness: 0.5, // 降低平滑度(0.0-1.0,越小越接近直线)
preventCurveOverShooting: true, // 防止过冲
preventCurveOvershootingThreshold: 0.1, // 过冲阈值
color: Colors.blue, //线条颜色
barWidth: 2, //线条宽度
isStrokeCapRound: true, //线条端点使用圆角
dotData: const FlDotData(show: false), //不显示每个数据点的小圆点
belowBarData: BarAreaData( //渐变填充区域配置
show: true, //显示线条下方的填充区域
gradient: LinearGradient(
colors: [
Colors.blue.withOpacity(0.3),
Colors.blue.withOpacity(0.0),
],
begin: Alignment.topCenter,
end: Alignment.bottomCenter,
),
),
),
// 电流线 - 绿色(需要转换到电压范围)
LineChartBarData(
spots: _convertCurrentToVoltageSpots(), //转为电压显示在图表上
isCurved: true,
curveSmoothness: 0.5, // 降低平滑度(0.0-1.0,越小越接近直线)
preventCurveOverShooting: true, // 防止过冲
preventCurveOvershootingThreshold: 0.1, // 过冲阈值
color: Colors.green,
barWidth: 2,
isStrokeCapRound: true,
dotData: const FlDotData(show: false),
belowBarData: BarAreaData(
show: true,
gradient: LinearGradient(
colors: [
Colors.green.withOpacity(0.3),
Colors.green.withOpacity(0.0),
],
begin: Alignment.topCenter,
end: Alignment.bottomCenter,
),
),
),
],
),
),
// 虚线装饰
Positioned(
top: 0,
left: 0,
right: 0,
child: CustomPaint(
painter: _DashedLinePainter(
direction: DashedLineDirection.horizontal,
),
child: Container(height: 1),
),
),
Positioned(
left: 0,
top: 0,
bottom: 30,
child: CustomPaint(
painter: _DashedLinePainter(
direction: DashedLineDirection.vertical,
),
child: Container(width: 1),
),
),
Positioned(
right: 0,
top: 0,
bottom: 30,
child: CustomPaint(
painter: _DashedLinePainter(
direction: DashedLineDirection.vertical,
),
child: Container(width: 1),
),
),
],
),
),
),
),
SizedBox(width: 5),
// 右侧固定Y轴 - 电流轴
Container(
width: 40,
padding: const EdgeInsets.only(bottom: 30),
color: Colors.white,
child: Column(
mainAxisAlignment: MainAxisAlignment.spaceBetween,
crossAxisAlignment: CrossAxisAlignment.start,
children: [
Text("${_currentMaxY.toInt()}",
style: const TextStyle(
fontSize: 10,
color: Colors.grey,
),
),
Text("${(_currentMinY + (_currentMaxY - _currentMinY) * 0.8).toInt()}",
style: const TextStyle(
fontSize: 10,
color: Colors.grey,
),
),
Text("${(_currentMinY + (_currentMaxY - _currentMinY) * 0.6).toInt()}",
style: const TextStyle(
fontSize: 10,
color: Colors.grey,
),
),
Text("${(_currentMinY + (_currentMaxY - _currentMinY) * 0.4).toInt()}",
style: const TextStyle(
fontSize: 10,
color: Colors.grey,
),
),
Text("${(_currentMinY + (_currentMaxY - _currentMinY) * 0.2).toInt()}",
style: const TextStyle(
fontSize: 10,
color: Colors.grey,
),
),
Text("${_currentMinY.toInt()}",
style: const TextStyle(
fontSize: 10,
color: Colors.grey,
),
),
],
),
),
],
),
);
}6.将电流转换为电压范围的方法
Dart
List<FlSpot> _convertCurrentToVoltageSpots() {
    return _currentData.map((spot) {
      // 将电流值映射到电压范围
      double voltageValue = _voltageMinY +
          (spot.y - _currentMinY) *
              ((_voltageMaxY - _voltageMinY) / (_currentMaxY - _currentMinY));
      return FlSpot(spot.x, voltageValue);
    }).toList();
  }
7.UI架构
Dart
  @override
  Widget build(BuildContext context) {
    return Scaffold(
      appBar: AppBar(
        leading: IconButton(
          onPressed: () {
            Navigator.pop(context);
          },
          icon: Icon(Icons.arrow_back_ios),
        ),
        title: const Text('电流电压监测'),
        centerTitle: true,
        elevation: 0,
      ),
      body: SingleChildScrollView(
        child: Column(
          crossAxisAlignment: CrossAxisAlignment.start,
          children: [
            // 图表标题
            Padding(
              padding: const EdgeInsets.fromLTRB(16, 8, 16, 8),
              child: Row(
                mainAxisAlignment: MainAxisAlignment.spaceBetween,
                children: [
                  Text(
                    '单位:V',
                    style: const TextStyle(
                        fontSize: 12,
                        color: Color(0xFF09172F)
                    ),
                  ),
                  Text(
                    '单位:mA',
                    style: const TextStyle(
                        fontSize: 12,
                        color: Color(0xFF09172F)
                    ),
                  ),
                ],
              ),
            ),

            // 固定Y轴的可滚动图表
            Container(
              margin: const EdgeInsets.symmetric(horizontal: 16),
              decoration: BoxDecoration(
                color: Colors.white,
              ),
              child: Column(
                children: [
                  _buildFixedYAxisChart(),
                ],
              ),
            ),

            // 操作按钮
            Padding(
              padding: const EdgeInsets.all(16),
              child: Row(
                children: [

                  Expanded(
                    child: ElevatedButton.icon(
                      onPressed: _scrollToNow,
                      icon: const Icon(Icons.access_time, size: 20),
                      label: const Text('跳转到当前'),
                      style: ElevatedButton.styleFrom(
                        padding: const EdgeInsets.symmetric(vertical: 12),
                      ),
                    ),
                  ),
                ],
              ),
            ),
          ],
        ),
      ),
    );
  }
8.跳转到当前时间的方法
Dart
  void _scrollToNow() {
    final now = DateTime.now();
    final hour = now.hour;
    final minute = now.minute;

    int index = hour * 2;
    if (minute >= 30) {
      index += 1;
    }

    index = index.clamp(0, 47);

    final scrollPosition = index * 50.0 - MediaQuery.of(context).size.width / 2 + 100;

    _scrollController.animateTo(
      scrollPosition.clamp(0, _scrollController.position.maxScrollExtent),
      duration: const Duration(milliseconds: 500),
      curve: Curves.easeInOut,
    );

    ScaffoldMessenger.of(context).showSnackBar(
      SnackBar(
        content: Text('已跳转到 ${hour.toString().padLeft(2, '0')}:${minute.toString().padLeft(2, '0')}'),
        duration: const Duration(seconds: 1),
      ),
    );
  }
9.虚线类
Dart
enum DashedLineDirection { horizontal, vertical }

class _DashedLinePainter extends CustomPainter {
  final DashedLineDirection direction;
  final Color color;
  final double strokeWidth;
  final double dashLength;
  final double dashSpace;
  final double opacity;

  _DashedLinePainter({
    this.direction = DashedLineDirection.horizontal,
    this.color = const Color(0xFF404040),
    this.strokeWidth = 1.0,
    this.dashLength = 5.0,
    this.dashSpace = 5.0,
    this.opacity = 0.4,
  });

  @override
  void paint(Canvas canvas, Size size) {
    final paint = Paint()
      ..color = color.withOpacity(opacity)
      ..strokeWidth = strokeWidth
      ..style = PaintingStyle.stroke;

    if (direction == DashedLineDirection.horizontal) {
      double startX = 0;
      while (startX < size.width) {
        canvas.drawLine(
          Offset(startX, 0),
          Offset(startX + dashLength, 0),
          paint,
        );
        startX += dashLength + dashSpace;
      }
    } else {
      double startY = 0;
      while (startY < size.height) {
        canvas.drawLine(
          Offset(0, startY),
          Offset(0, startY + dashLength),
          paint,
        );
        startY += dashLength + dashSpace;
      }
    }
  }

  @override
  bool shouldRepaint(covariant CustomPainter oldDelegate) => false;
}
代码实例
Dart
import 'package:flutter/cupertino.dart';
import 'package:flutter/material.dart';
import 'package:fl_chart/fl_chart.dart';
import 'dart:math';
class CurrentVoltageCard extends StatefulWidget {
const CurrentVoltageCard({super.key});
@override
State<StatefulWidget> createState() => _CurrentVoltageCardState();
}
class _CurrentVoltageCardState extends State<CurrentVoltageCard> {
//电压数据点 (蓝色)
List<FlSpot> _voltageData = [
FlSpot(0, 0.5), // 00:00
FlSpot(1, 1.2), // 00:30
FlSpot(2, 2.0), // 01:00
FlSpot(3, 1.8), // 01:30
FlSpot(4, 2.5), // 02:00
FlSpot(5, 3.0), // 02:30
FlSpot(6, 2.8), // 03:00
FlSpot(7, 2.2), // 03:30
FlSpot(8, 2.5), // 04:00
FlSpot(9, 4.0), // 04:30
FlSpot(10, 4.5), // 05:00
FlSpot(11, 3.0), // 05:30
FlSpot(12, 3.5), // 06:00
FlSpot(13, 2.0), // 06:30
FlSpot(14, 6.5), // 07:00
FlSpot(15, 2.0), // 07:30
FlSpot(16, 7.5), // 08:00
FlSpot(17, 8.0), // 08:30
FlSpot(18, 8.5), // 09:00
FlSpot(19, 9.0), // 09:30
FlSpot(20, 9.5), // 10:00
FlSpot(21, 0.0), // 10:30
FlSpot(22, 9.8), // 11:00
FlSpot(23, 9.5), // 11:30
FlSpot(24, 9.0), // 12:00
FlSpot(25, 8.5), // 12:30
FlSpot(26, 8.0), // 13:00
FlSpot(27, 7.5), // 13:30
FlSpot(28, 7.0), // 14:00
FlSpot(29, 6.5), // 14:30
FlSpot(30, 6.0), // 15:00
FlSpot(31, 2.5), // 15:30
FlSpot(32, 2.0), // 16:00
FlSpot(33, 4.5), // 16:30
FlSpot(34, 4.0), // 17:00
FlSpot(35, 3.5), // 17:30
FlSpot(36, 3.0), // 18:00
FlSpot(37, 2.5), // 18:30
FlSpot(38, 2.0), // 19:00
FlSpot(39, 1.5), // 19:30
FlSpot(40, 1.0), // 20:00
FlSpot(41, 0.5), // 20:30
FlSpot(42, 0.0), // 21:00
FlSpot(43, 9.5), // 21:30
FlSpot(44, 9), // 22:00
FlSpot(45, 2.5), // 22:30
FlSpot(46, 8.0), // 23:00
FlSpot(47, 2.5), // 23:30
FlSpot(48, 7.0), // 24:00
];
//电流数据点(绿色)
List<FlSpot> _currentData = [
FlSpot(0, 1500), // 00:00
FlSpot(1, 1450), // 00:30
FlSpot(2, 1400), // 01:00
FlSpot(3, 1380), // 01:30
FlSpot(4, 1350), // 02:00
FlSpot(5, 1320), // 02:30
FlSpot(6, 1300), // 03:00
FlSpot(7, 1280), // 03:30
FlSpot(8, 1250), // 04:00
FlSpot(9, 1220), // 04:30
FlSpot(10, 1200), // 05:00
FlSpot(11, 1180), // 05:30
FlSpot(12, 1150), // 06:00
FlSpot(13, 1120), // 06:30
FlSpot(14, 1100), // 07:00
FlSpot(15, 1080), // 07:30
FlSpot(16, 1050), // 08:00
FlSpot(17, 1020), // 08:30
FlSpot(18, 1000), // 09:00
FlSpot(19, 980), // 09:30
FlSpot(20, 950), // 10:00
FlSpot(21, 920), // 10:30
FlSpot(22, 900), // 11:00
FlSpot(23, 880), // 11:30
FlSpot(24, 850), // 12:00
FlSpot(25, 820), // 12:30
FlSpot(26, 800), // 13:00
FlSpot(27, 780), // 13:30
FlSpot(28, 750), // 14:00
FlSpot(29, 110), // 14:30
FlSpot(30, 100), // 15:00
FlSpot(31, 220), // 15:30
FlSpot(32, 650), // 16:00
FlSpot(33, 620), // 16:30
FlSpot(34, 600), // 17:00
FlSpot(35, 580), // 17:30
FlSpot(36, 550), // 18:00
FlSpot(37, 520), // 18:30
FlSpot(38, 500), // 19:00
FlSpot(39, 480), // 19:30
FlSpot(40, 450), // 20:00
FlSpot(41, 420), // 20:30
FlSpot(42, 400), // 21:00
FlSpot(43, 380), // 21:30
FlSpot(44, 350), // 22:00
FlSpot(45, 320), // 22:30
FlSpot(46, 300), // 23:00
FlSpot(47, 280), // 23:30
FlSpot(48, 250), // 24:00
];
final ScrollController _scrollController = ScrollController(); //滚动控制器
// 电压值的范围
final double _voltageMinY = 0;
final double _voltageMaxY = 10;
//电流值的范围
final double _currentMinY = 0;
final double _currentMaxY = 1500;
@override
void dispose() {
_scrollController.dispose();
super.dispose();
}
// 构建折线图
Widget _buildFixedYAxisChart() {
return Container(
height: 260,
child: Row(
children: [
// 左侧固定Y轴 - 电压轴
Container(
width: 40,
padding: const EdgeInsets.only(bottom: 30),
color: Colors.white,
child: Column(
mainAxisAlignment: MainAxisAlignment.spaceBetween,
crossAxisAlignment: CrossAxisAlignment.end,
children: [
Text("${_voltageMaxY.toStringAsFixed(1)}",
style: const TextStyle(
fontSize: 10,
color: Colors.grey,
),
),
Text("${(_voltageMinY + (_voltageMaxY - _voltageMinY) * 0.8).toStringAsFixed(1)}",
style: const TextStyle(
fontSize: 10,
color: Colors.grey,
),
),
Text("${(_voltageMinY + (_voltageMaxY - _voltageMinY) * 0.6).toStringAsFixed(1)}",
style: const TextStyle(
fontSize: 10,
color: Colors.grey,
),
),
Text("${(_voltageMinY + (_voltageMaxY - _voltageMinY) * 0.4).toStringAsFixed(1)}",
style: const TextStyle(
fontSize: 10,
color: Colors.grey,
),
),
Text("${(_voltageMinY + (_voltageMaxY - _voltageMinY) * 0.2).toStringAsFixed(1)}",
style: const TextStyle(
fontSize: 10,
color: Colors.grey,
),
),
Text("${_voltageMinY.toStringAsFixed(1)}",
style: const TextStyle(
fontSize: 10,
color: Colors.grey,
),
),
],
),
),
SizedBox(width: 5),
// 可滚动的图表区域
Expanded(
child: SingleChildScrollView(
scrollDirection: Axis.horizontal, //水平滚动
controller: _scrollController, //滚动控制器
child: Container(
width: 48 * 50.0 + 60,
height: 250,
padding: const EdgeInsets.symmetric(horizontal: 20.0),
child: Stack(
children: [
LineChart( //折线图主体
LineChartData(
lineTouchData: LineTouchData(
enabled: false, //不让点击折线图显示相关点的数据
),
gridData: FlGridData(
show: true, //显示网格系统
drawHorizontalLine: true, //绘制水平网格线
drawVerticalLine: true, //绘制垂直网格线
horizontalInterval:(_voltageMaxY - _voltageMinY) / 5, //水平线之间的间隔距离
verticalInterval: 1, //垂直线之间的间隔距离 - 每1个X轴单位画一条垂直线
getDrawingHorizontalLine: (value) { //水平线样式自定义
return FlLine(
color: Color(0xFF404040).withOpacity(0.4),
strokeWidth: 1,
dashArray: [4,4]
);
},
getDrawingVerticalLine: (value) { //垂直线样式自定义
return FlLine(
color: Color(0xFF404040).withOpacity(0.4),
strokeWidth: 1,
dashArray: [4,4]
);
},
),
titlesData: FlTitlesData( //坐标轴标题配置
show: true, //显示坐标轴标题
bottomTitles: AxisTitles( //底部X轴标题
sideTitles: SideTitles(
showTitles: true, //显示刻度标签
reservedSize: 30, //为标签预留空间
interval: 1, //每一个单位显示一个标签
getTitlesWidget: (value, meta) { //自定义标签被内容
//判断是否为偶数
if (value.toInt() % 2 == 0) {
final hour = value ~/ 2; //除2取整得到小时数
return Padding(
padding: const EdgeInsets.only(top: 8.0), //顶部间距
child: Text(
'${hour.toString().padLeft(2, '0')}:00',
style: const TextStyle(
fontSize: 10,
color: Colors.grey,
),
),
);
}
//判断是否为奇数
if (value.toInt() % 2 == 1) {
final hour = value ~/ 2;
return Padding(
padding: const EdgeInsets.only(top: 8.0),
child: Text(
'${hour.toString().padLeft(2, '0')}:30',
style: const TextStyle(
fontSize: 10,
color: Colors.grey,
),
),
);
}
return Container(); //其他情况返回空容器
},
),
),
//上左右不显示标题
leftTitles: const AxisTitles(
sideTitles: SideTitles(showTitles: false),
),
rightTitles: const AxisTitles(
sideTitles: SideTitles(showTitles: false),
),
topTitles: const AxisTitles(
sideTitles: SideTitles(showTitles: false),
),
),
borderData: FlBorderData( //边框显示
show: true,
border: Border(
bottom: BorderSide( //显示下边框
color: Color(0xFF404040).withOpacity(0.5),
width: 1,
),
top: BorderSide.none,
left: BorderSide.none,
right: BorderSide.none,
),
),
minX: 0, //x轴最小值
maxX: 48, //X轴最大值
minY: _voltageMinY, //Y轴最小值 ,使用的是电压的值
maxY: _voltageMaxY, //Y轴最大值
lineBarsData: [
// 电压线 - 蓝色
LineChartBarData(
spots: _voltageData, //使用预先定义的电压数据点数组
isCurved: true, //使用曲线链接点
curveSmoothness: 0.5, // 降低平滑度(0.0-1.0,越小越接近直线)
preventCurveOverShooting: true, // 防止过冲
preventCurveOvershootingThreshold: 0.1, // 过冲阈值
color: Colors.blue, //线条颜色
barWidth: 2, //线条宽度
isStrokeCapRound: true, //线条端点使用圆角
dotData: const FlDotData(show: false), //不显示每个数据点的小圆点
belowBarData: BarAreaData( //渐变填充区域配置
show: true, //显示线条下方的填充区域
gradient: LinearGradient(
colors: [
Colors.blue.withOpacity(0.3),
Colors.blue.withOpacity(0.0),
],
begin: Alignment.topCenter,
end: Alignment.bottomCenter,
),
),
),
// 电流线 - 绿色(需要转换到电压范围)
LineChartBarData(
spots: _convertCurrentToVoltageSpots(), //转为电压显示在图表上
isCurved: true,
curveSmoothness: 0.5, // 降低平滑度(0.0-1.0,越小越接近直线)
preventCurveOverShooting: true, // 防止过冲
preventCurveOvershootingThreshold: 0.1, // 过冲阈值
color: Colors.green,
barWidth: 2,
isStrokeCapRound: true,
dotData: const FlDotData(show: false),
belowBarData: BarAreaData(
show: true,
gradient: LinearGradient(
colors: [
Colors.green.withOpacity(0.3),
Colors.green.withOpacity(0.0),
],
begin: Alignment.topCenter,
end: Alignment.bottomCenter,
),
),
),
],
),
),
// 虚线装饰
Positioned(
top: 0,
left: 0,
right: 0,
child: CustomPaint(
painter: _DashedLinePainter(
direction: DashedLineDirection.horizontal,
),
child: Container(height: 1),
),
),
Positioned(
left: 0,
top: 0,
bottom: 30,
child: CustomPaint(
painter: _DashedLinePainter(
direction: DashedLineDirection.vertical,
),
child: Container(width: 1),
),
),
Positioned(
right: 0,
top: 0,
bottom: 30,
child: CustomPaint(
painter: _DashedLinePainter(
direction: DashedLineDirection.vertical,
),
child: Container(width: 1),
),
),
],
),
),
),
),
SizedBox(width: 5),
// 右侧固定Y轴 - 电流轴
Container(
width: 40,
padding: const EdgeInsets.only(bottom: 30),
color: Colors.white,
child: Column(
mainAxisAlignment: MainAxisAlignment.spaceBetween,
crossAxisAlignment: CrossAxisAlignment.start,
children: [
Text("${_currentMaxY.toInt()}",
style: const TextStyle(
fontSize: 10,
color: Colors.grey,
),
),
Text("${(_currentMinY + (_currentMaxY - _currentMinY) * 0.8).toInt()}",
style: const TextStyle(
fontSize: 10,
color: Colors.grey,
),
),
Text("${(_currentMinY + (_currentMaxY - _currentMinY) * 0.6).toInt()}",
style: const TextStyle(
fontSize: 10,
color: Colors.grey,
),
),
Text("${(_currentMinY + (_currentMaxY - _currentMinY) * 0.4).toInt()}",
style: const TextStyle(
fontSize: 10,
color: Colors.grey,
),
),
Text("${(_currentMinY + (_currentMaxY - _currentMinY) * 0.2).toInt()}",
style: const TextStyle(
fontSize: 10,
color: Colors.grey,
),
),
Text("${_currentMinY.toInt()}",
style: const TextStyle(
fontSize: 10,
color: Colors.grey,
),
),
],
),
),
],
),
);
}
//==============================将电流值转换到电压范围================================
List<FlSpot> _convertCurrentToVoltageSpots() {
return _currentData.map((spot) {
// 将电流值映射到电压范围
double voltageValue = _voltageMinY +
(spot.y - _currentMinY) *
((_voltageMaxY - _voltageMinY) / (_currentMaxY - _currentMinY));
return FlSpot(spot.x, voltageValue);
}).toList();
}
@override
Widget build(BuildContext context) {
return Scaffold(
appBar: AppBar(
leading: IconButton(
onPressed: () {
Navigator.pop(context);
},
icon: Icon(Icons.arrow_back_ios),
),
title: const Text('电流电压监测'),
centerTitle: true,
elevation: 0,
),
body: SingleChildScrollView(
child: Column(
crossAxisAlignment: CrossAxisAlignment.start,
children: [
// 图表标题
Padding(
padding: const EdgeInsets.fromLTRB(16, 8, 16, 8),
child: Row(
mainAxisAlignment: MainAxisAlignment.spaceBetween,
children: [
Text(
'单位:V',
style: const TextStyle(
fontSize: 12,
color: Color(0xFF09172F)
),
),
Text(
'单位:mA',
style: const TextStyle(
fontSize: 12,
color: Color(0xFF09172F)
),
),
],
),
),
// 固定Y轴的可滚动图表
Container(
margin: const EdgeInsets.symmetric(horizontal: 16),
decoration: BoxDecoration(
color: Colors.white,
),
child: Column(
children: [
_buildFixedYAxisChart(),
],
),
),
// 操作按钮
Padding(
padding: const EdgeInsets.all(16),
child: Row(
children: [
Expanded(
child: ElevatedButton.icon(
onPressed: _scrollToNow,
icon: const Icon(Icons.access_time, size: 20),
label: const Text('跳转到当前'),
style: ElevatedButton.styleFrom(
padding: const EdgeInsets.symmetric(vertical: 12),
),
),
),
],
),
),
],
),
),
);
}
// 跳转到当前时间
void _scrollToNow() {
final now = DateTime.now();
final hour = now.hour;
final minute = now.minute;
int index = hour * 2;
if (minute >= 30) {
index += 1;
}
index = index.clamp(0, 47);
final scrollPosition = index * 50.0 - MediaQuery.of(context).size.width / 2 + 100;
_scrollController.animateTo(
scrollPosition.clamp(0, _scrollController.position.maxScrollExtent),
duration: const Duration(milliseconds: 500),
curve: Curves.easeInOut,
);
ScaffoldMessenger.of(context).showSnackBar(
SnackBar(
content: Text('已跳转到 ${hour.toString().padLeft(2, '0')}:${minute.toString().padLeft(2, '0')}'),
duration: const Duration(seconds: 1),
),
);
}
}
///虚线类
enum DashedLineDirection { horizontal, vertical }
class _DashedLinePainter extends CustomPainter {
final DashedLineDirection direction;
final Color color;
final double strokeWidth;
final double dashLength;
final double dashSpace;
final double opacity;
_DashedLinePainter({
this.direction = DashedLineDirection.horizontal,
this.color = const Color(0xFF404040),
this.strokeWidth = 1.0,
this.dashLength = 5.0,
this.dashSpace = 5.0,
this.opacity = 0.4,
});
@override
void paint(Canvas canvas, Size size) {
final paint = Paint()
..color = color.withOpacity(opacity)
..strokeWidth = strokeWidth
..style = PaintingStyle.stroke;
if (direction == DashedLineDirection.horizontal) {
double startX = 0;
while (startX < size.width) {
canvas.drawLine(
Offset(startX, 0),
Offset(startX + dashLength, 0),
paint,
);
startX += dashLength + dashSpace;
}
} else {
double startY = 0;
while (startY < size.height) {
canvas.drawLine(
Offset(0, startY),
Offset(0, startY + dashLength),
paint,
);
startY += dashLength + dashSpace;
}
}
}
@override
bool shouldRepaint(covariant CustomPainter oldDelegate) => false;
}