记录下工作中使用echarts做出的特殊组件
js
import { defineComponent, ref, watchPostEffect, onBeforeUnmount } from 'vue'
import { FONT_SIZE, getImagePath, getMax } from './createChart'
const propData = [
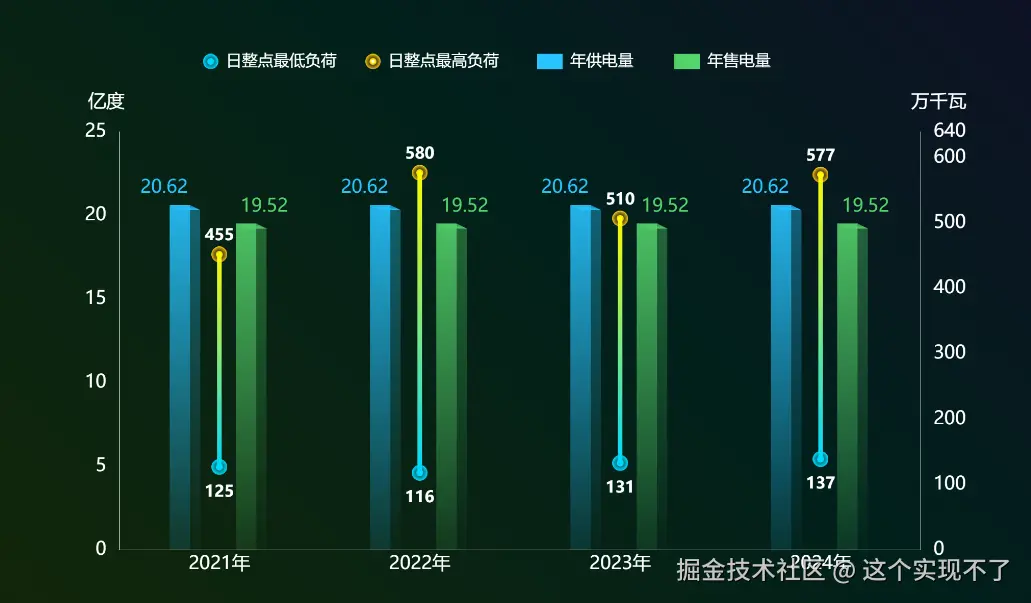
['年份', '日整点最低负荷', '日整点最高负荷', '年供电量', '年售电量'],
[2021, 125, 455, 20.62, 19.52],
[2022, 116, 580, 20.62, 19.52],
[2023, 131, 510, 20.62, 19.52],
[2024, 137, 577, 20.62, 19.52],
]
let props = {
propData: {
type: Array,
default: () => propData,
},
labelPosition: {
type: Array,
default: () => [-30, 10],
},
chartExtraOption: {
type: Object,
default() {
return {}
},
},
areaColorArray: {
type: Array,
default: () => ['#FFFB00', '#00D8FF', '#28C3FF', '#54D26A'],
},
imageVeArray: {
type: Array,
default: () =>
['黄色圆圈icon', '蓝色圆圈icon'].map((name) => {
return {
imageUrl: `scn/file/xxx/assets/图例icon/${name}.png`,
}
}),
},
}
export default defineComponent({
props,
setup(props) {
const chartRef = ref(null)
let chart
const drawChart = () => {
const data = props.propData
// 下面几行 需要调用初始化绘画图形的方法 类似:
// const dom = this.$refs.chart
// if (!this.chart) {
// this.chart = echarts.init(dom, null, {
// renderer: 'canvas',
// })
// }
// this.chart.setOption(option, true)
}
watchVeProps(props, drawChart)
watchPostEffect(() => {
if (!chartRef.value) return
drawChart()
})
onBeforeUnmount(() => {
if (chart?.dispose) chart.dispose()
})
return { chartRef }
},
})
function getBarChartOption(data, props) {
const textStyle = {
fontSize: FONT_SIZE,
color: '#fff',
// formatter: ({ value }) => value.toFixed(2),
}
const lineStyle = {
color: '#fff',
width: 1,
}
// const data.slice(1) = data.slice(1)
const { areaColorArray, imageVeArray, labelPosition } = props
const legends = (data[0] || []).slice(1)
const option = _.merge(
{},
{
grid: {
left: '3%',
right: '5%',
bottom: '3%',
top: '15%',
containLabel: true,
},
tooltip: {
show: true,
trigger: 'axis',
axisPointer: {
type: 'none',
},
appendToBody: true,
symbolSize: 100,
formatter: (params) => {
if (!(params || params[0])) return
let result = '<div class="chart-tooltip">' + params[0].axisValue + '<br>'
params.forEach((item, index) => {
let icon = `<span class="icon" style = "background:${areaColorArray[index]}" > </span>`
if (item.componentSubType === 'pictorialBar') {
icon = `<img class="icon" src="${imageVeArray[index].imageUrl}"/>`
}
result += `
<div class="${item.componentSubType}">
${icon}
<span class="name">${item.seriesName}:</span>
<span class="value" style="color:${areaColorArray[index]}">${item.value}
<span class="unit" style="color:#fff; font-size: 36px;">${item.componentSubType === 'custom' ? '亿度' : '万千瓦'}</sapn>
</span>
</div>`
})
result += '</div >'
return result
},
textStyle: {
fontSize: 50,
color: '#fff',
},
backgroundColor: '#0C3E5F',
borderColor: '#0CB6FF',
borderWidth: 4,
},
legend: [
{
...getCommonLegend([legends[0]], areaColorArray[0]),
icon: getImagePath(imageVeArray[1].imageUrl, '', true),
left: '15%',
},
{
...getCommonLegend([legends[1]], areaColorArray[1]),
icon: getImagePath(imageVeArray[0].imageUrl, '', true),
left: '32%',
},
{
...getCommonLegend(legends.slice(2, 4), areaColorArray.slice(2, 4)),
right: '25%',
itemWidth: 50,
itemHeight: 30,
itemGap: 80,
icon: 'rect',
itemStyle: {
borderWidth: 0,
borderColor: 'transparent',
},
},
],
xAxis: [
{
data: data.slice(1).map(([month]) => +month + '年'),
axisLabel: {
fontSize: FONT_SIZE,
color: '#fff',
margin: 10,
},
axisLine: {
show: true,
lineStyle,
},
axisTick: {
show: false,
},
splitLine: {
show: false,
},
},
{
data: data.slice(1).map(([month]) => +month + '年'),
axisLabel: {
show: false,
},
axisLine: {
show: true,
lineStyle,
},
axisTick: {
show: false,
},
splitLine: {
show: false,
},
},
],
yAxis: [
{
type: 'value',
name: '亿度',
nameGap: 0,
nameLocation: 'end',
position: 'left',
nameTextStyle: {
...textStyle,
padding: [0, 50, 40, 0], // 上、右、下、左
},
axisLine: {
show: true,
lineStyle,
},
axisLabel: {
...textStyle,
margin: 25,
},
axisTick: {
show: false,
},
splitLine: {
show: false,
},
},
{
type: 'value',
name: '万千瓦',
nameGap: 0,
nameLocation: 'end',
position: 'right',
max: (value) => getMax(value.max, 1.1),
min: 0,
nameTextStyle: {
...textStyle,
padding: [0, 0, 40, 70], // 上、右、下、左
},
axisLine: {
show: true,
lineStyle,
},
axisLabel: {
...textStyle,
margin: 25,
},
axisTick: {
show: false,
},
splitLine: {
show: false,
},
},
],
series: [
getSeriesOptionTop(
legends[1],
data.slice(1).map(([, , max]) => {
return (+max).toFixed(0)
}),
areaColorArray,
imageVeArray,
),
getSeriesOptionTop(
legends[0],
data.slice(1).map(([, min]) => {
return (+min).toFixed(0)
}),
areaColorArray,
imageVeArray,
),
getSeriesOption(
legends[0],
data.slice(1).map(([, min]) => {
return (+min).toFixed(0)
}),
areaColorArray,
),
getSeriesOption(
legends[1],
data.slice(1).map(([, min, max]) => {
return (max - min).toFixed(0)
}),
areaColorArray,
),
// // 虚线折线图
// getSeriesDottedLine(
// legends[2],
// data.slice(1).map((item) => {
// return item[3]
// }),
// areaColorArray,
// ),
getSeries3DBar(
legends[2],
data.slice(1).map((item) => {
return item[3]
}),
areaColorArray[2],
-50,
),
getSeries3DBar(
legends[3],
data.slice(1).map((item) => {
return item[4]
}),
areaColorArray[3],
80,
),
getSeries3DBarLabel(
data.slice(1).map((item) => {
return item[3]
}),
areaColorArray[2],
labelPosition[0],
),
getSeries3DBarLabel(
data.slice(1).map((item) => {
return item[4]
}),
areaColorArray[3],
labelPosition[1],
),
],
},
)
return option
}
function getSeriesOption(name, data, areaColorArray) {
return {
name,
type: 'bar',
stack: '负荷',
yAxisIndex: 1,
tooltip: { show: false },
color: name.includes('最高')
? new echarts.graphic.LinearGradient(0, 0, 0, 1, [
{ offset: 0, color: areaColorArray[0] },
{
offset: 1,
color: areaColorArray[1],
},
])
: 'transparent',
label: {
show: false,
},
symbol: 'circle',
symbolSize: FONT_SIZE / 5,
itemStyle: {
borderRadius: 10,
},
barWidth: FONT_SIZE / 4,
data,
}
}
function getCommonLegend(legends, color) {
return {
show: true,
top: '0%',
itemWidth: 30,
itemHeight: 30,
itemGap: 25,
textStyle: {
color: '#fff',
fontSize: FONT_SIZE - 5,
padding: 10,
},
data: legends.map((item, index) => ({
name: item,
itemStyle: {
color: Array.isArray(color) ? color[index] : color || '#FFFFFF', // 设置图例图标颜色
},
})),
}
}
function getSeriesOptionTop(name, data, areaColorArray, imageColorArray) {
return {
name,
type: 'pictorialBar',
yAxisIndex: 1,
color: name.includes('最高') ? areaColorArray[0] : areaColorArray[1],
symbol: getImagePath(name.includes('最高') ? imageColorArray[0].imageUrl : imageColorArray[1].imageUrl, '', true),
label: {
show: true,
color: '#fff',
fontSize: FONT_SIZE - 5,
fontWeight: 'bold',
position: 'top',
offset: name.includes('最高') ? [0, 0] : [0, FONT_SIZE + 50],
},
symbolSize: FONT_SIZE - 5,
symbolPosition: 'end',
symbolOffset: name.includes('最高') ? [0, -FONT_SIZE / 3] : [0, -FONT_SIZE / 2],
data,
}
}
function getSeriesDottedLine(name, data, areaColorArray) {
return {
name,
type: 'line',
yAxisIndex: 1,
color: areaColorArray[2] || '#FFF',
label: {
show: false,
},
// symbol: 'circle',
symbolSize: 25,
itemStyle: {},
lineStyle: {
width: 3, // 增加线条粗细
type: 'dashed', // 设置为虚线
},
data,
}
}
function getSeries3DBar(name, data, color, gap = 0) {
const barWidth = 15 // 定义柱形宽度
return {
name,
type: 'custom',
yAxisIndex: 0,
renderItem: (params, api) => {
const location = api.coord([api.value(0), api.value(1)])
const xlocation = api.coord([api.value(0), 0])
// 根据gap参数调整位置
const xOffset = gap // 使用传入的gap值
const barCenterX = location[0] + xOffset
const barLeftX = barCenterX - barWidth / 2
return {
type: 'group',
children: [
{
type: 'CubeLeft',
shape: {
api,
xValue: api.value(0),
yValue: api.value(1),
x: barLeftX, // 使用计算后的位置
y: location[1],
xAxisPoint: xlocation,
width: barWidth, // 添加宽度控制
offset: xOffset, // 传递偏移量
},
style: {
fill: new echarts.graphic.LinearGradient(0, 0, 0, 1, [
{
offset: 0,
color: echarts.color.modifyAlpha(color, 0.9),
},
{
offset: 1,
color: echarts.color.modifyAlpha(color, 0.12),
},
]),
},
},
{
type: 'CubeRight',
shape: {
api,
xValue: api.value(0),
yValue: api.value(1),
x: barLeftX, // 使用计算后的位置
y: location[1],
xAxisPoint: xlocation,
width: barWidth, // 添加宽度控制
offset: xOffset, // 传递偏移量
},
style: {
fill: new echarts.graphic.LinearGradient(0, 0, 0, 1, [
{
offset: 0,
color: echarts.color.modifyAlpha(color, 0.4),
},
{
offset: 1,
color: echarts.color.modifyAlpha(color, 0.01),
},
]),
},
},
{
type: 'CubeTop',
shape: {
api,
xValue: api.value(0),
yValue: api.value(1),
x: barLeftX, // 使用计算后的位置
y: location[1],
xAxisPoint: xlocation,
width: barWidth, // 添加宽度控制
offset: xOffset, // 传递偏移量
},
style: {
fill: new echarts.graphic.LinearGradient(0, 0, 0, 1, [
{
offset: 0,
color: echarts.color.modifyAlpha(color, 0.2),
},
{
offset: 1,
color,
},
]),
},
},
],
}
},
color,
data,
}
}
function getSeries3DBarLabel(data, color, offsetX) {
return {
type: 'bar',
color,
tooltip: { show: false },
yAxisIndex: 0,
xAxisIndex: 1,
data,
label: {
show: true,
position: 'top',
fontSize: FONT_SIZE,
color,
offset: [offsetX, -10],
},
itemStyle: {
color: 'transparent',
},
}
}