记录下工作中使用echarts做出的特殊组件
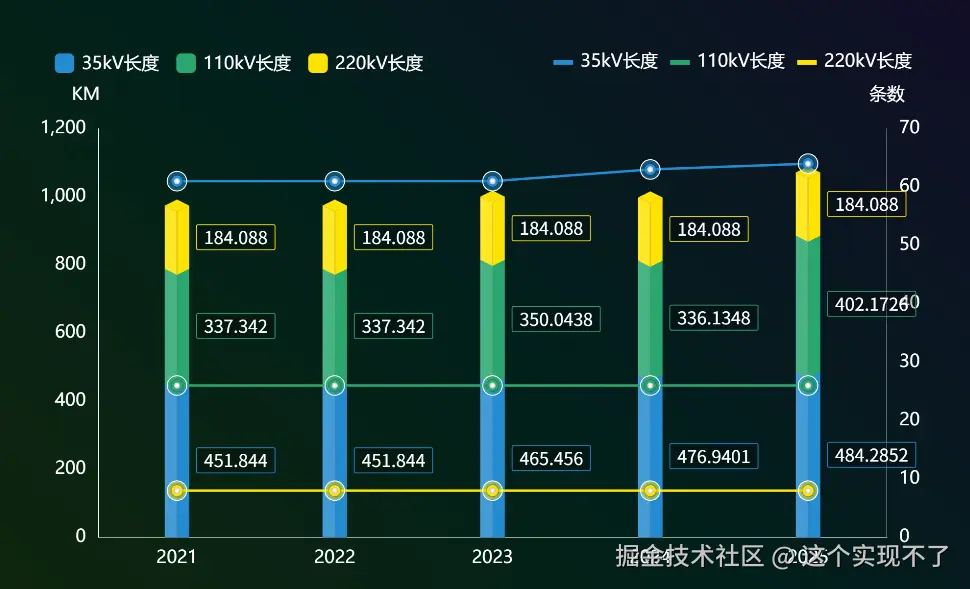
注意点:柱子颜色不能有透明不然在三角形堆叠的地方会透出来,效果就不好。我这里用了echarts.color.lift给了一个相近的亮色。可以改成自定义的两个颜色做左侧和右侧的立体效果更好。
import
import { COLOR_GREEN, FONT_SIZE } from './createChart'

let props = {
  // labelDistance: {
  //   type: Array,
  //   default: () => [FONT_SIZE / 2, 0],
  // },
  areaColorArray: {
    type: Array,
    default: () => ['#248BD2', COLOR_GREEN, '#FFE300', '#248BD2', COLOR_GREEN, '#FFE300'],
  },
  barWidth: {
    type: Number,
    default: 50,
  },
  lineWidth: {
    type: Number,
    default: 5,
  },
  propData: {
    type: Array,
    default: () => [
      { name: '2021', value1: 451.844, value2: 337.342, value3: 184.088, value4: 61, value5: 26, value6: 8 },
      { name: '2022', value1: 451.844, value2: 337.342, value3: 184.088, value4: 61, value5: 26, value6: 8 },
      { name: '2023', value1: 465.456, value2: 350.0438, value3: 184.088, value4: 61, value5: 26, value6: 8 },
      { name: '2024', value1: 476.9401, value2: 336.1348, value3: 184.088, value4: 63, value5: 26, value6: 8 },
      { name: '2025', value1: 484.2852, value2: 402.1726, value3: 184.088, value4: 64, value5: 26, value6: 8 },
    ],
  },
  legendData: {
    type: Array,
    default: () => [
      { name: '35kV长度', type: 'bar', unit: 'KM', key: 'value1' },
      { name: '110kV长度', type: 'bar', unit: 'KM', key: 'value2' },
      { name: '220kV长度', type: 'bar', unit: 'KM', key: 'value3' },
      { name: '35kV条数', type: 'line', unit: '条', key: 'value4' },
      { name: '110kV条数', type: 'line', unit: '条', key: 'value5' },
      { name: '220kV条数', type: 'line', unit: '条', key: 'value6' },
    ],
  },

}


export default defineComponent({
  props,
  data() {
    return {}
  },
  created() {},
  mounted() {
    this.init()
    this.$watch(
      () => this.$props, // 监听整个 props 对象
      () => {
        this.init()
      },
      { deep: true, immediate: false },
    )
  },
  beforeDestroy() {
    this.chart?.dispose?.()
  },
  methods: {
    init() {
      const textStyle = {
        fontSize: FONT_SIZE,
        color: '#fff',
        // formatter: ({ value }) => value.toFixed(2),
      }
      const lineStyle = {
        color: '#fff',
        width: 1,
      }
      const legendData = this.legendData

      const option = {
        legend: [
          {
            // 第一个图例 - 用于柱状图
            show: true,
            top: '0%',

            left: '3%',
            itemWidth: 40,
            itemHeight: 40,
            itemGap: 25,
            data: legendData
              .filter((item) => item.type === 'bar')
              .map((item, index) => ({
                name: item.name,
                itemStyle: {
                  color: this.areaColorArray[index] || '#FFFFFF', // 设置图例图标颜色
                },
              })),
            formatter: (name) => {
              return `{text|${name}}`
            },
            textStyle: {
              ...textStyle,
              padding: [0, 10],
              lineHeight: 1, // 增加行高
              rich: {
                text: {
                  fontSize: 36,
                  color: '#fff',
                  padding: [5, 0, 0, 0], // 只移动文字
                },
              },
            },
          },
          {
            // 第二个图例 - 用于折线图
            show: true,
            top: '0%',
            right: '3%',
            itemWidth: 40,
            itemHeight: 10,
            icon: 'rect',
            itemGap: 25,
            data: legendData
              .filter((item) => item.type === 'bar')
              .map((item, index) => ({
                name: item.name,
                itemStyle: {
                  color: this.areaColorArray[index + 3] || '#FFFFFF', // 设置图例图标颜色
                },
              })), // 过滤出折线图系列的图例
            textStyle: {
              ...textStyle,
              padding: [0, 10],
            },
            itemStyle: {
              borderWidth: 0,
              borderColor: 'transparent',
            },
          },
        ],
        tooltip: {
          show: true,
          trigger: 'axis',
          axisPointer: {
            type: 'none',
          },
          appendToBody: true,
          symbolSize: 100,
          formatter: (params) => {
            if (!(params || params[0])) return
            let result = '<div class="chart-tooltip">' + params[0].axisValue + '<br>'
            params.forEach((item, index) => {
              result += `
              <div class="${item.componentSubType}">
              <span class="icon" style="background:${this.areaColorArray[index]}"></span>
              <span class="name">${item.seriesName}:</span>
              <span class="value" style="color:${this.areaColorArray[index]}">${item.value}
              <span class="unit" style="color:#fff">${item.componentSubType === 'bar' ? 'kM' : '条'}</sapn>
              </span>
              </div>`
            })
            result += '</div >'
            return result
          },
          textStyle: {
            fontSize: 50,
            color: '#fff',
          },
          backgroundColor: '#0C3E5F',
          borderColor: '#0CB6FF',
          borderWidth: 4,
        },
        grid: {
          left: '8%',
          right: '6%',
          bottom: '6%',
          top: '15%',
          containLabel: false,
        },
        xAxis: [
          {
            type: 'category',
            axisTick: {
              show: false,
              alignWithLabel: true,
              lineStyle,
            },
            axisLabel: {
              show: true,
              ...textStyle,
              margin: 25,
            },

            axisLine: {
              lineStyle,
            },
            splitLine: {
              show: false,
            },
            data: this.propData.map((item) => item.name),
          },
          {
            type: 'category',
            axisTick: {
              show: false,
            },
            axisLabel: {
              show: false,
            },
            axisLine: {
              lineStyle,
            },
            splitLine: {
              show: false,
            },
            data: this.propData.map((item) => item.name),
          },
        ],
        yAxis: [
          {
            type: 'value',
            name: 'KM',
            nameGap: 0,
            nameLocation: 'end',
            position: 'left',
            nameTextStyle: {
              ...textStyle,
              padding: [0, 50, 50, 0], // 上、右、下、左
            },
            axisLine: {
              show: true,
              lineStyle,
            },
            axisLabel: {
              ...textStyle,
              margin: 25,
            },
            axisTick: {
              show: false,
            },
            splitLine: {
              show: false,
            },
          },
          {
            type: 'value',
            name: '条数',
            nameGap: 0,
            nameLocation: 'end',
            position: 'right',
            nameTextStyle: {
              ...textStyle,
              padding: [0, 0, 50, 0], // 上、右、下、左
            },
            axisLine: {
              show: true,
              lineStyle,
            },
            axisLabel: {
              ...textStyle,
              margin: 25,
            },
            axisTick: {
              show: false,
            },
            splitLine: {
              show: false,
            },
          },
        ],
        series: this.getSeries(),
      }
      this.draw(option)
    },
    draw(option) {
      const dom = this.$refs.chart
      if (!this.chart) {
        this.chart = echarts.init(dom, null, {
          renderer: 'canvas',
        })
      }
      this.chart.setOption(option, true)
    },
    getSeries() {
      let series = []
      series = this.legendData.map((item, index) => {
        let seriesItem = {
          name: item.name,
          type: item.type,
          yAxisIndex: item.type === 'bar' ? 0 : 1,
          data: this.propData.map((dataItem) => dataItem[item.key]),
        }
        if (item.type === 'line') {
          seriesItem = {
            ...seriesItem,
            symbol: 'circle',
            symbolSize: 18,
            color: this.areaColorArray[index],
            lineStyle: {
              color: this.areaColorArray[index], // 单独控制线条颜色
              width: this.lineWidth,
            },
            z: 60,
            itemStyle: {
              color: '#fff', // 单独控制线条颜色
              borderColor: this.areaColorArray[index], // 边框颜色
              borderWidth: 5, // 边框宽度
              shadowColor: 'rgba(0, 0, 0, 0.5)', // 阴影颜色(黑色半透明)
              shadowBlur: 5, // 阴影模糊大小
              shadowOffsetX: 0, // 水平偏移
              shadowOffsetY: 0,
            },
          }
        }

        if (item.type === 'bar') {
          seriesItem = {
            ...seriesItem,
            stack: 'total',
            barWidth: this.barWidth,
            color: this.areaColorArray[index],
            itemStyle: {
              color: {
                x: 0,
                y: 0,
                x2: 1,
                y2: 0,
                type: 'linear',
                global: false,
                colorStops: this.getColorStops(this.areaColorArray[index]),
              },
            },
            label: {
              show: true,
              fontSize: 36,
              color: '#fff',
              fontFamily: 'TRENDS',
              position: 'right',
              distance: 15,
              borderWidth: 1, // 边框宽度
              borderRadius: 3, // 圆角边框
              padding: [15, 15, 0, 15], // 内边距
              backgroundColor: 'rgba(0, 0, 0, 0.24)', // 背景色
              borderColor: this.areaColorArray[index], // 边框颜色
            },
          }
        }
        return seriesItem
      })
      series = [...this.getSeriesLine(series), ...series, ...this.getSeriesPictorialBar(series)]

      return series
    },
    getSeriesLine(series) {
      const seriesLine = []
      series.forEach((item) => {
        if (item.type === 'line') {
          seriesLine.push({
            ...item,
            symbol: 'circle',
            tooltip: { show: false },
            symbolSize: 40,
            lineStyle: {
              color: 'transparent', // 单独控制线条颜色
              width: 0,
            },
            itemStyle: {
              color: echarts.color.modifyAlpha(item.color, 0.5), // 单独控制线条颜色
              borderColor: '#fff', // 边框颜色
              borderWidth: 2, // 边框宽度
            },
          })
        }
      })
      return seriesLine
    },
    // 为了3D效果加的立体面
    getSeriesPictorialBar(series) {
      const pictorialBarSeries = []
      const bar_series = series.filter((item) => {
        return item.type === 'bar'
      })
      const maxData = this.propData.map((item) => {
        return item.value1 + item.value2 + item.value3
      })
      const common_config = {
        name: 'top',
        type: 'pictorialBar',
        symbol: 'diamond',
        symbolPosition: 'end',
        tooltip: { show: false },
        symbolSize: [this.barWidth, this.barWidth / 2],
        symbolOffset: [-0, -this.barWidth / 2 + 11],
        z: 40,
        label: {},
        data: maxData,
        itemStyle: {
          borderColor: echarts.color.modifyAlpha('#666666', 0.9),
          borderWidth: 3, // 边框宽度
          borderType: 'solid', // 边框样式,可选:solid, dashed, dotted
        },
      }

      const colors = _.map(bar_series, 'color')
      bar_series.forEach((item, index) => {
        if (index === bar_series.length - 1) {
          pictorialBarSeries.push({
            ...common_config,
            name: 'top',
            color: item.color,
          })
        } else {
          const data = this.getPictorialBarData(bar_series, index)

          const color = colors.reverse()[index] || '#fff'
          pictorialBarSeries.push({
            ...common_config,
            symbolOffset: [-0, -this.barWidth / 2 + 13],
            z: 20,
            color,
            itemStyle: {
              color: {
                x: 0,
                y: 0,
                x2: 1,
                y2: 0,
                type: 'linear',
                global: false,
                colorStops: this.getColorStops(color),
              },
            },
            data,
          })
        }
      })
      // 中间一根竖线
      pictorialBarSeries.push({
        data: maxData,
        type: 'bar',
        barWidth: 3,
        barGap: '-50%',
        tooltip: { show: false },
        itemStyle: {
          color: echarts.color.modifyAlpha('#666666', 0.2),
        },
        z: 30,
        xAxisIndex: 1,
      })
      return pictorialBarSeries
    },

    getPictorialBarData(seriesData, index) {
      return this.getCumulativeData(_.map(seriesData, 'data').reverse(), index)
    },
    getCumulativeData(data, index) {
      // 获取从 index+1 开始的所有数组
      const remainingArrays = data.slice(index + 1)

      if (remainingArrays.length === 0) {
        return []
      }
      const result2 = remainingArrays[0].map((_, index) => remainingArrays.reduce((sum, row) => sum + row[index], 0))
      return result2
    },
    getColorStops(color) {
      return [
        {
          offset: 0,
          color: echarts.color.lift(color, 0.15),
        },
        {
          offset: 0.5,
          color: echarts.color.lift(color, 0.15),
        },
        {
          offset: 0.5,
          color: echarts.color.modifyAlpha(color, 1),
        },
        {
          offset: 1,
          color: echarts.color.modifyAlpha(color, 1),
        },
      ]
    },
  },
})