背景
云原生与分布式架构下,NetStat 网络指标是监控服务器端口状态、保障服务高可用的重要依据。本次实践基于观测云 SaaS + DataKit 技术栈,以 Linux 环境为基础,通过保姆级分步实操,完成从 DataKit 安装、8080 端口 NetStat 采集配置,到可视化仪表板搭建、异常告警规则配置,再到端口异常模拟与告警验证的全流程落地,快速实现指定业务端口的精细化网络监控,形成可复用、易落地的 NetStat 可观测实践方案。
安装 DataKit
登陆观测云控制台,点击左侧「集成」选择顶部「DataKit」,即可看到各种方式的安装命令。
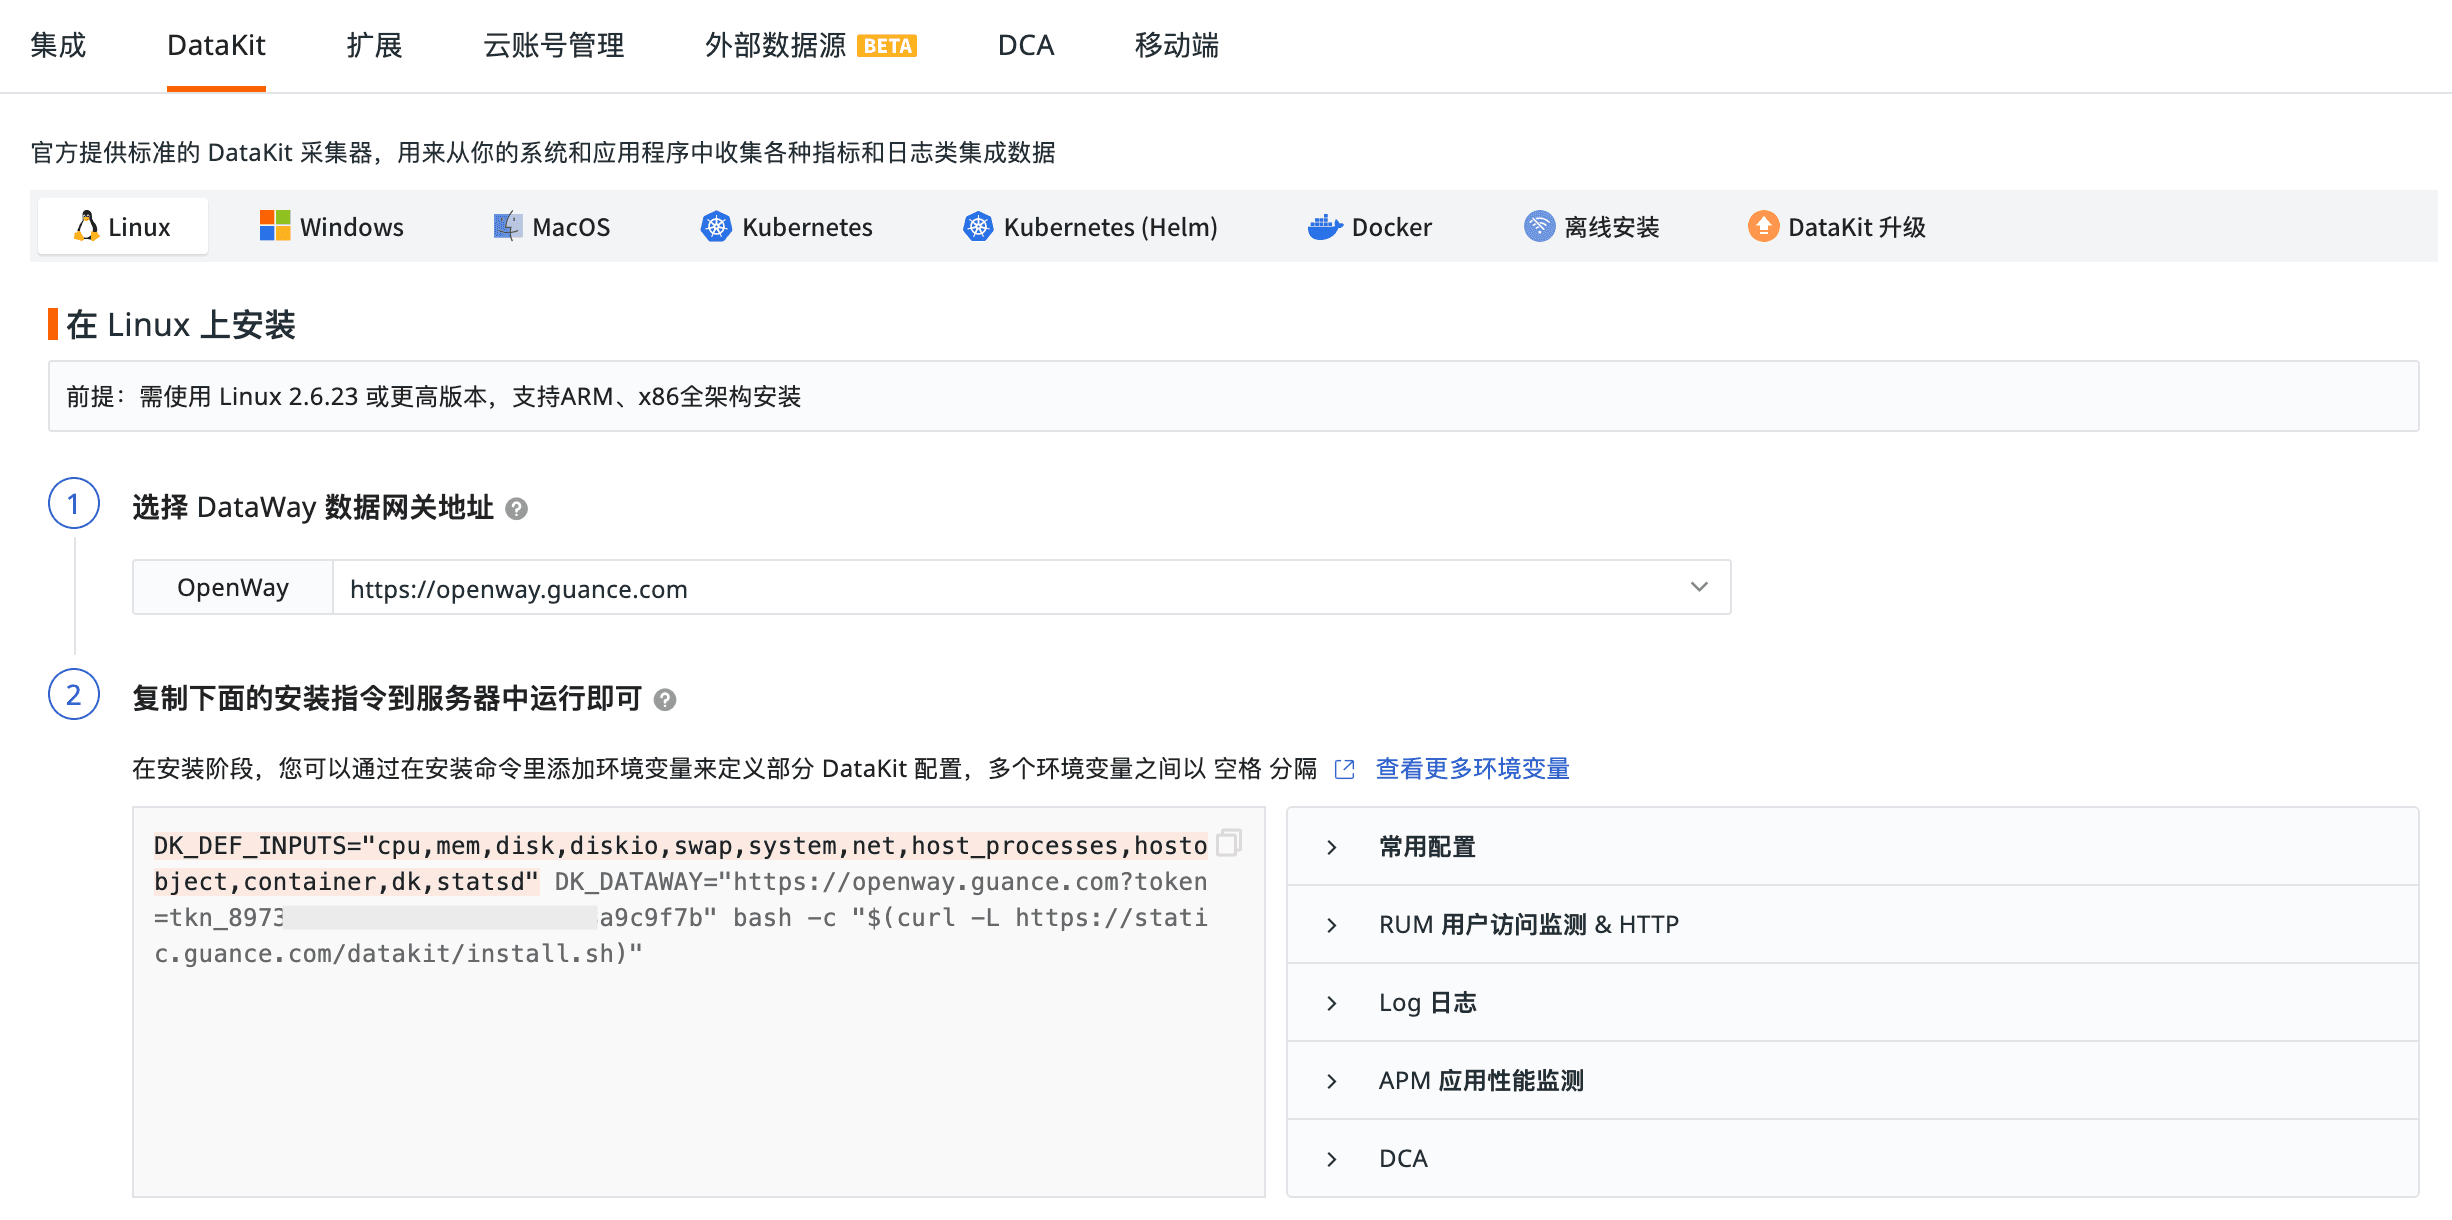
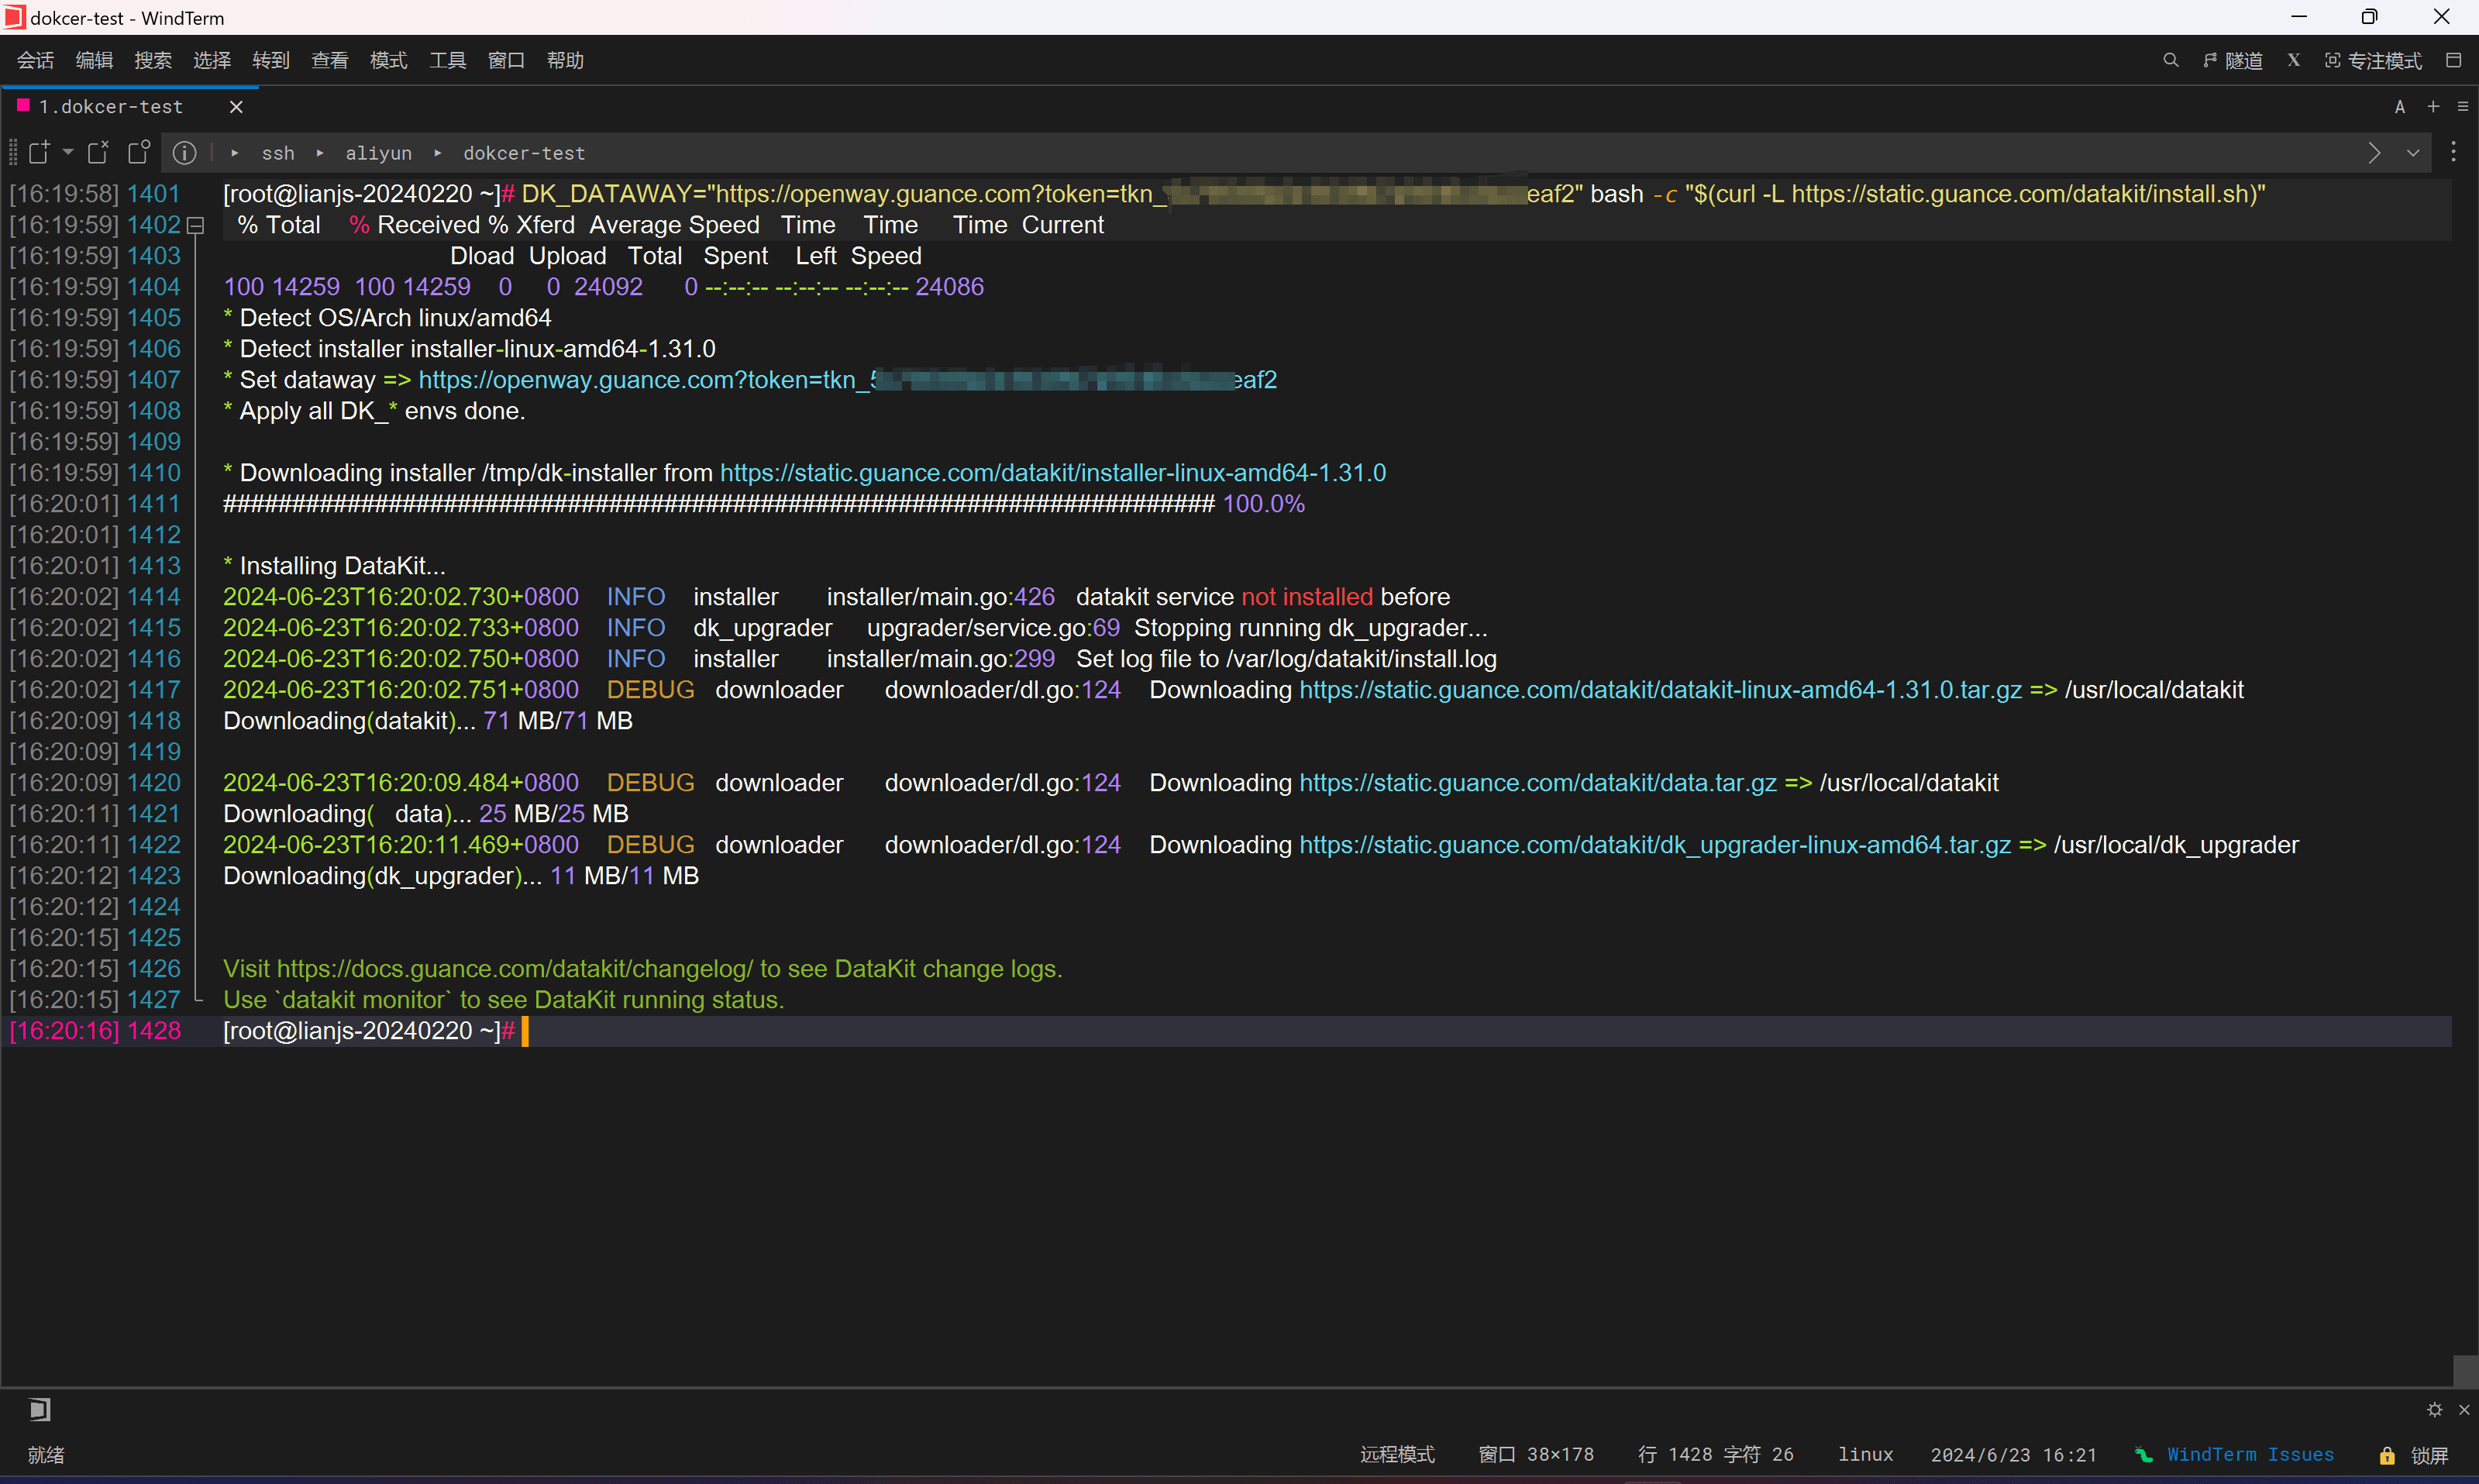
本文选择 Liunx 方式安装,执行安装命令即可。
NetStat 采集接入
-
进入 DataKit 安装目录下的
conf.d/samples目录,将配置文件netstat.conf.sample复制并重命名为netstat.conf。 -
编辑
netstat.conf文件,保留核心配置并添加 8080 端口专属监控配置,完整配置示例如下:[[inputs.netstat]]
##(Optional) Collect interval, default is 10 seconds
interval = '10s'The ports you want display
Can add tags too
[[inputs.netstat.addr_ports]]
# ports = ["80","443"]Groups of ports and add different tags to facilitate statistics
[[inputs.netstat.addr_ports]]
# ports = ["80","443"][inputs.netstat.addr_ports.tags]
# service = "http"[[inputs.netstat.addr_ports]]
# ports = ["9529"][inputs.netstat.addr_ports.tags]
# service = "datakit"
# foo = "bar"
Server may have multiple network cards
Display only some network cards
Can add tags too
[[inputs.netstat.addr_ports]]
# ports = ["1.1.1.1:80","2.2.2.2:80"]
# ports_match is preferred if both ports and ports_match configured
# ports_match = ["*:80","*:443"]
[inputs.netstat.tags]
# some_tag = "some_value"
# more_tag = "some_other_value"监控 8080 端口, 本实践服务的端口
[[inputs.netstat.addr_ports]]
ports = ["8080"]
[inputs.netstat.addr_ports.tags]
service = "myservice-agent"
env = "prod" -
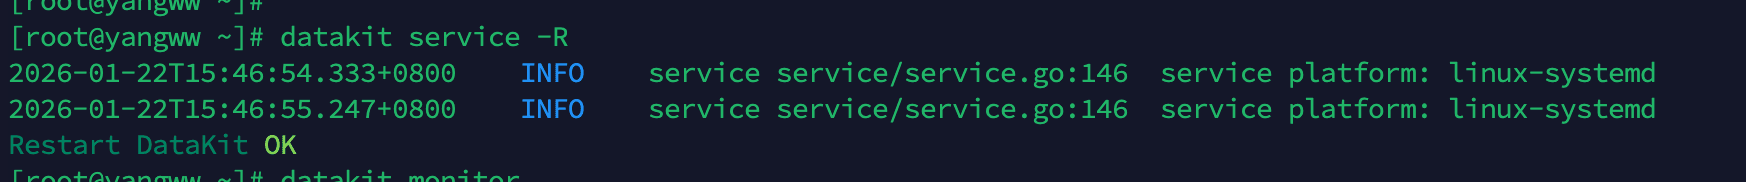
执行以下命令重启 DataKit 服务,使配置生效
datakit service -R
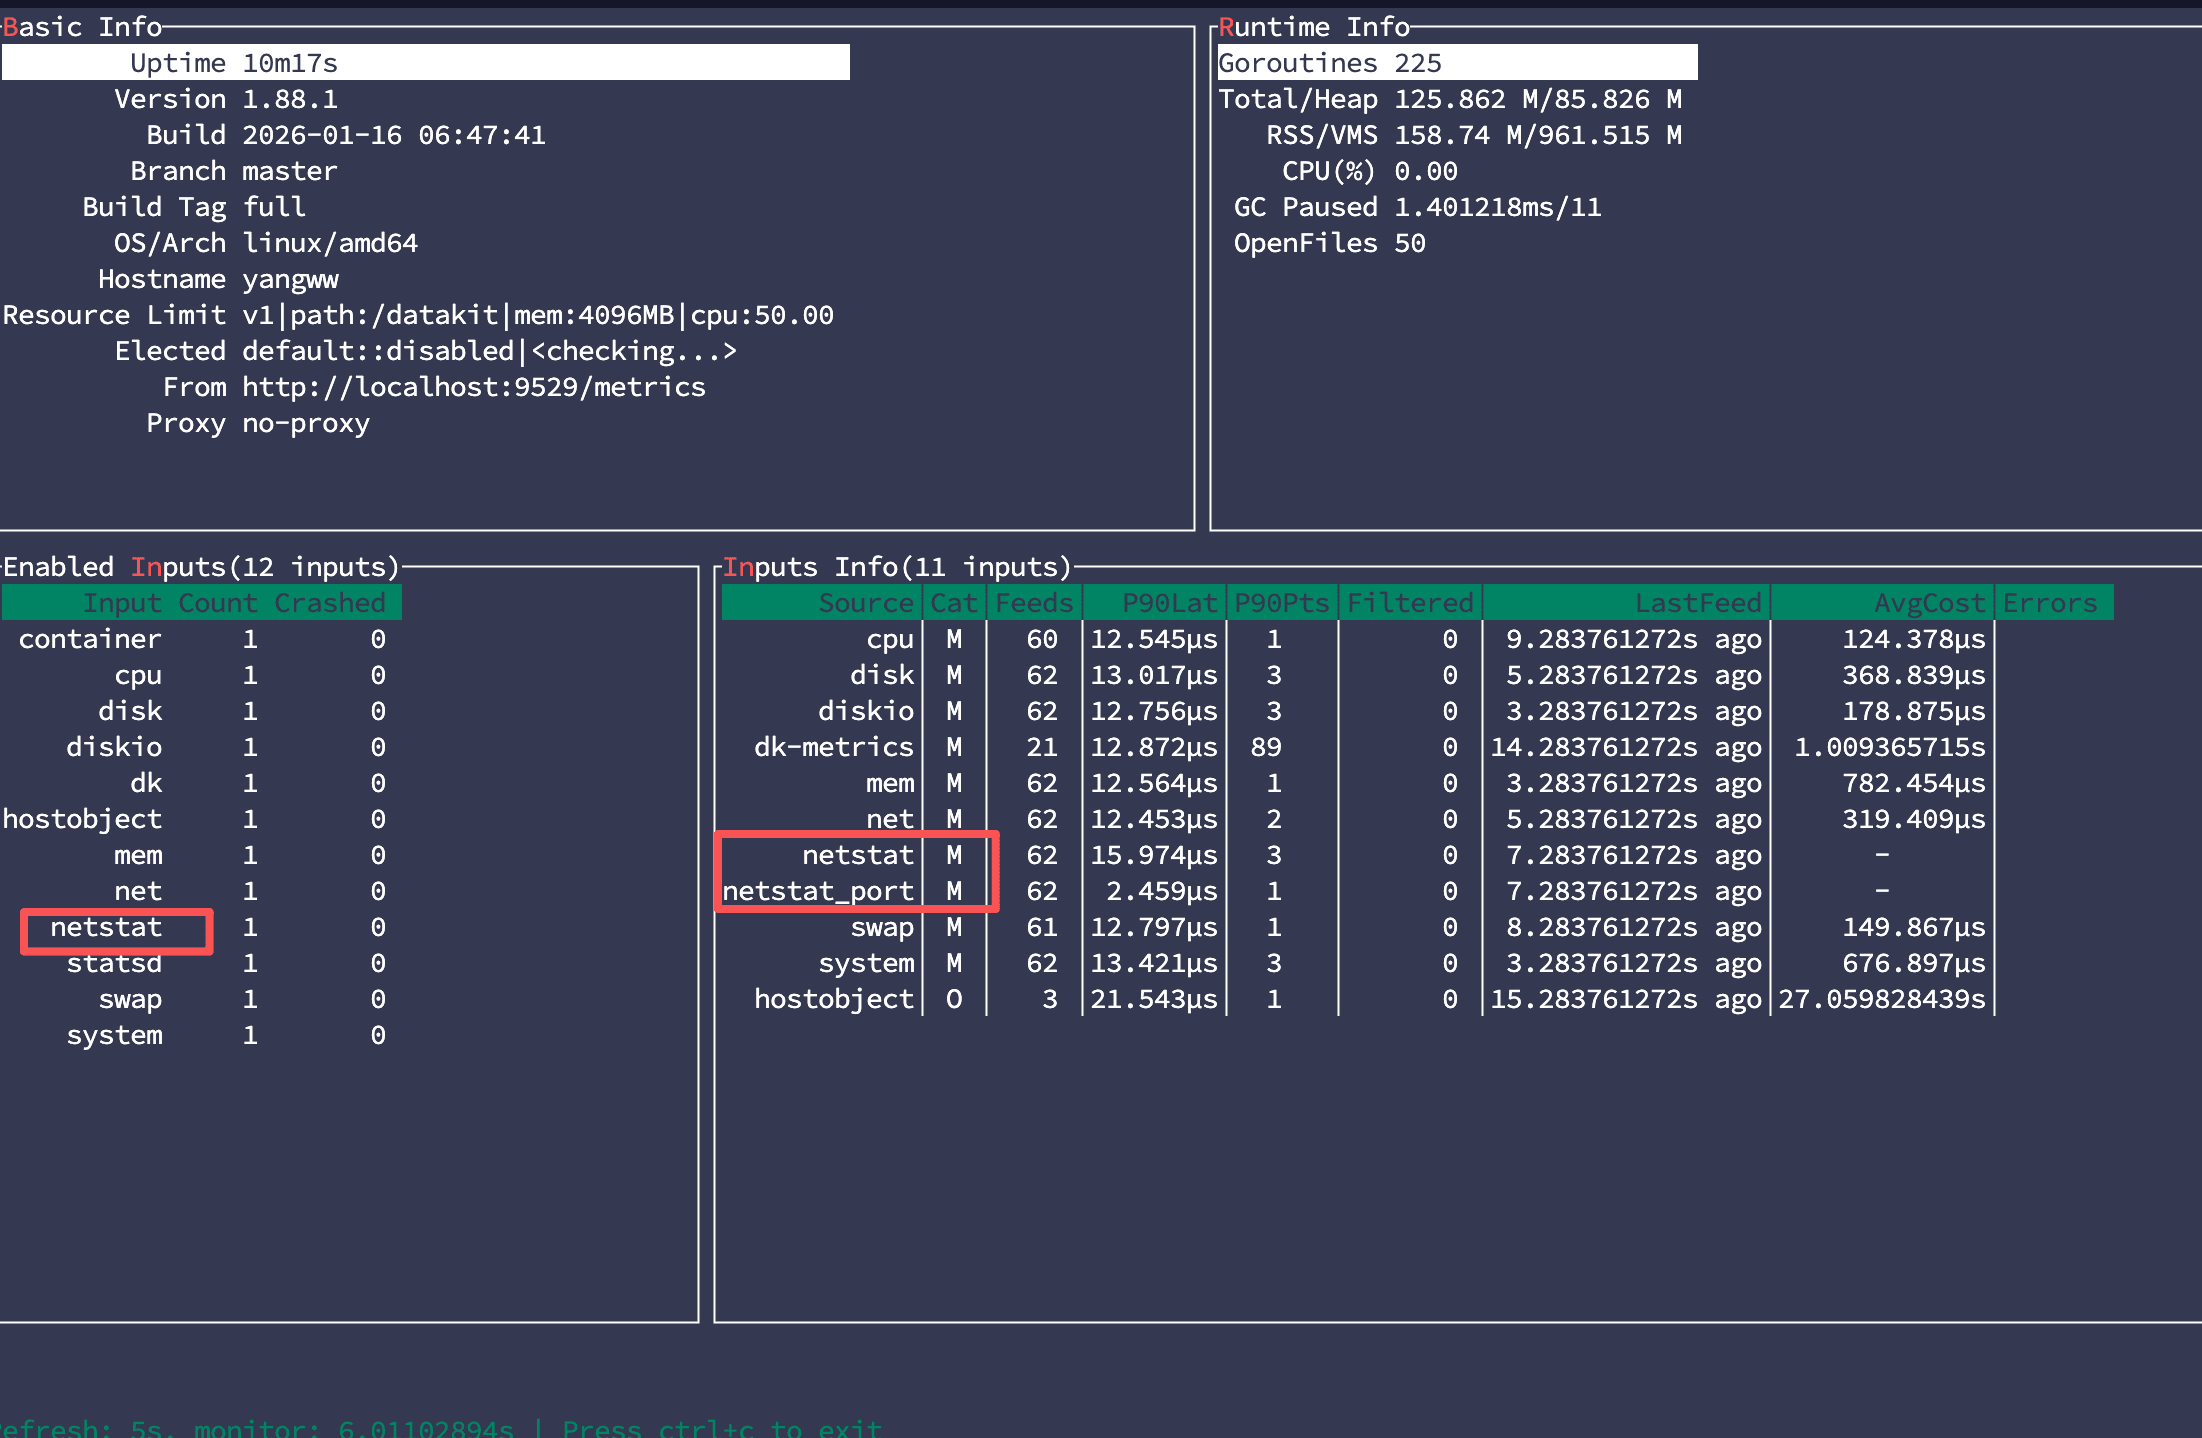
- 数据接入检查
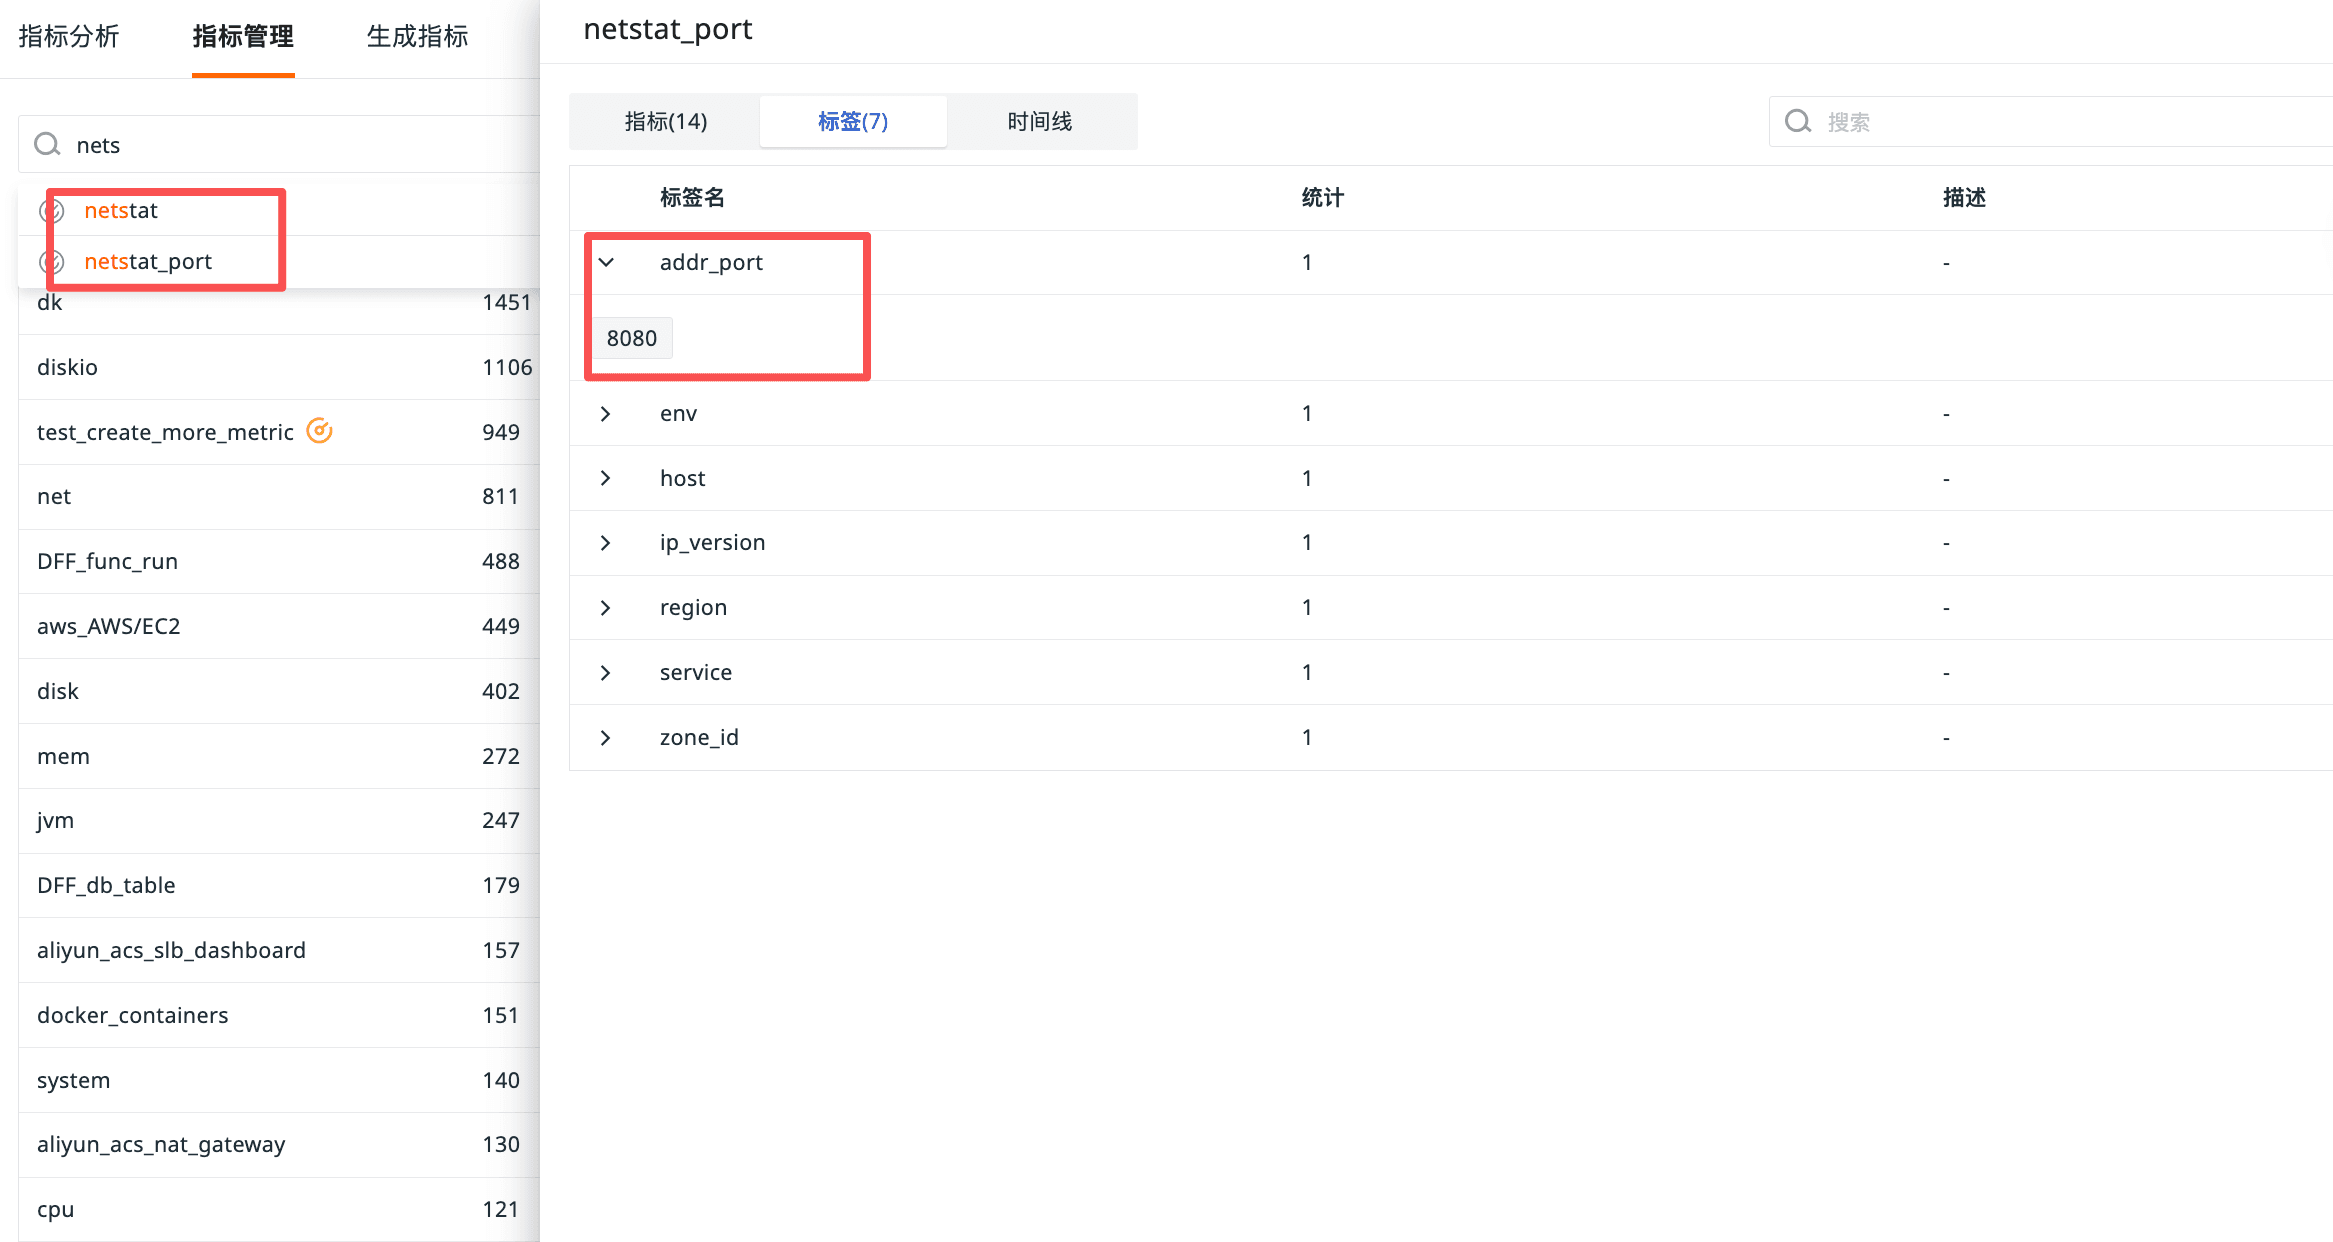
NetStat 指标详情
| Tags & Fields | Description |
|---|---|
| addr_port (tag) | Addr and port. Optional. |
| host (tag) | Host name |
| ip_version (tag) | IP version, 4 for IPV4, 6 for IPV6, unknown for others |
| pid | PID. Optional. Type: int | (gauge) Unit: count |
| tcp_close | CLOSE : The number of TCP state be waiting for a connection termination request acknowledgement from remote TCP host. Type: int | (gauge) Unit: count |
| tcp_close_wait | CLOSE_WAIT : The number of TCP state be waiting for a connection termination request from local user. Type: int | (gauge) Unit: count |
| tcp_closing | CLOSING : The number of TCP state be waiting for a connection termination request acknowledgement from remote TCP host. Type: int | (gauge) Unit: count |
| tcp_established | ESTABLISHED : The number of TCP state be open connection, data received to be delivered to the user. Type: int | (gauge) Unit: count |
| tcp_fin_wait1 | FIN_WAIT1 : The number of TCP state be waiting for a connection termination request from remote TCP host or acknowledgment of connection termination request sent previously. Type: int | (gauge) Unit: count |
| tcp_fin_wait2 | FIN_WAIT2 : The number of TCP state be waiting for connection termination request from remote TCP host. Type: int | (gauge) Unit: count |
| tcp_last_ack | LAST_ACK : The number of TCP state be waiting for connection termination request acknowledgement previously sent to remote TCP host including its acknowledgement of connection termination request. Type: int | (gauge) Unit: count |
| tcp_listen | LISTEN : The number of TCP state be waiting for a connection request from any remote TCP host. Type: int | (gauge) Unit: count |
| tcp_none | NONE Type: int | (gauge) Unit: count |
| tcp_syn_recv | SYN_RECV : The number of TCP state be waiting for confirmation of connection acknowledgement after both sender and receiver has sent / received connection request. Type: int | (gauge) Unit: count |
| tcp_syn_sent | SYN_SENT : The number of TCP state be waiting for a machine connection request after sending a connecting request. Type: int | (gauge) Unit: count |
| tcp_time_wait | TIME_WAIT : The number of TCP state be waiting sufficient time to pass to ensure remote TCP host received acknowledgement of its request for connection termination. Type: int | (gauge) Unit: count |
| udp_socket | UDP : The number of UDP connection. Type: int | (gauge) Unit: count |
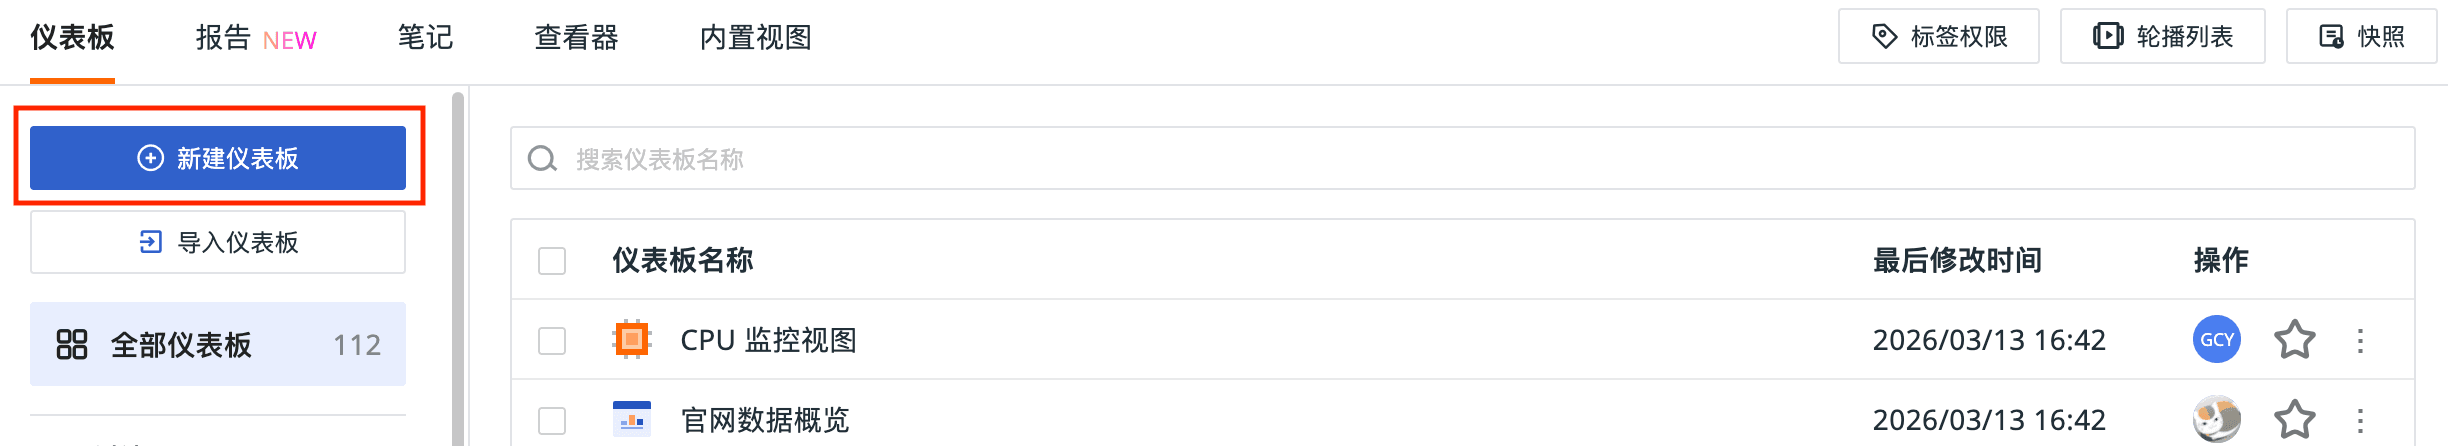
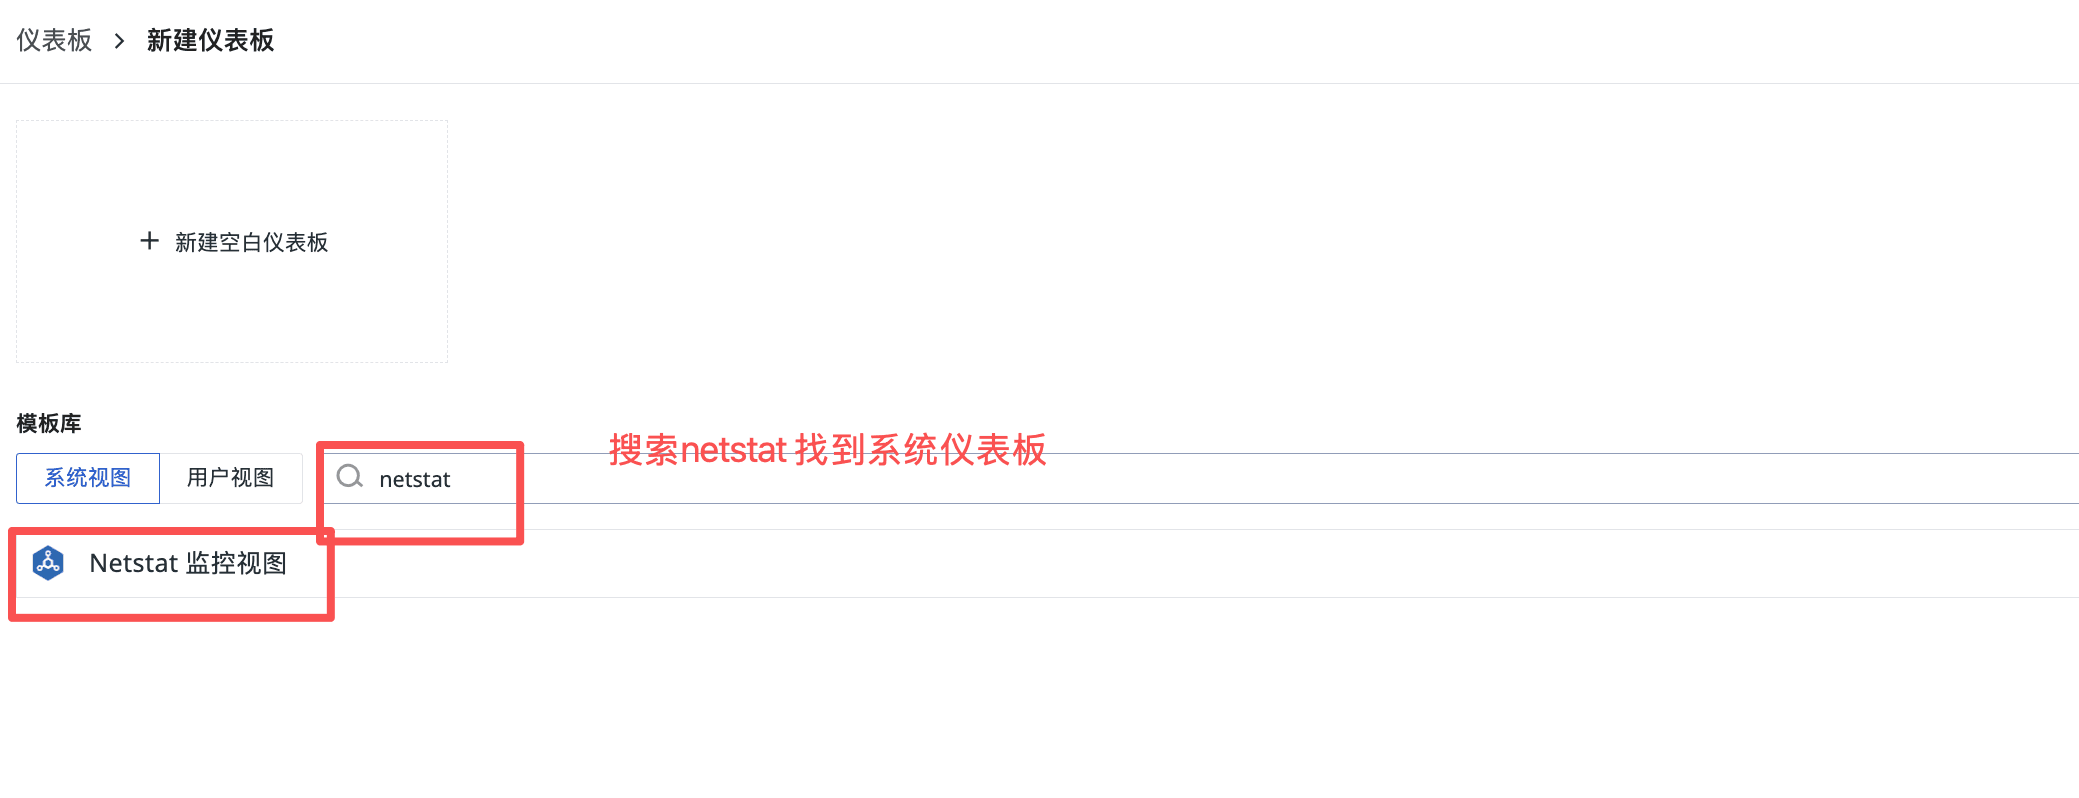
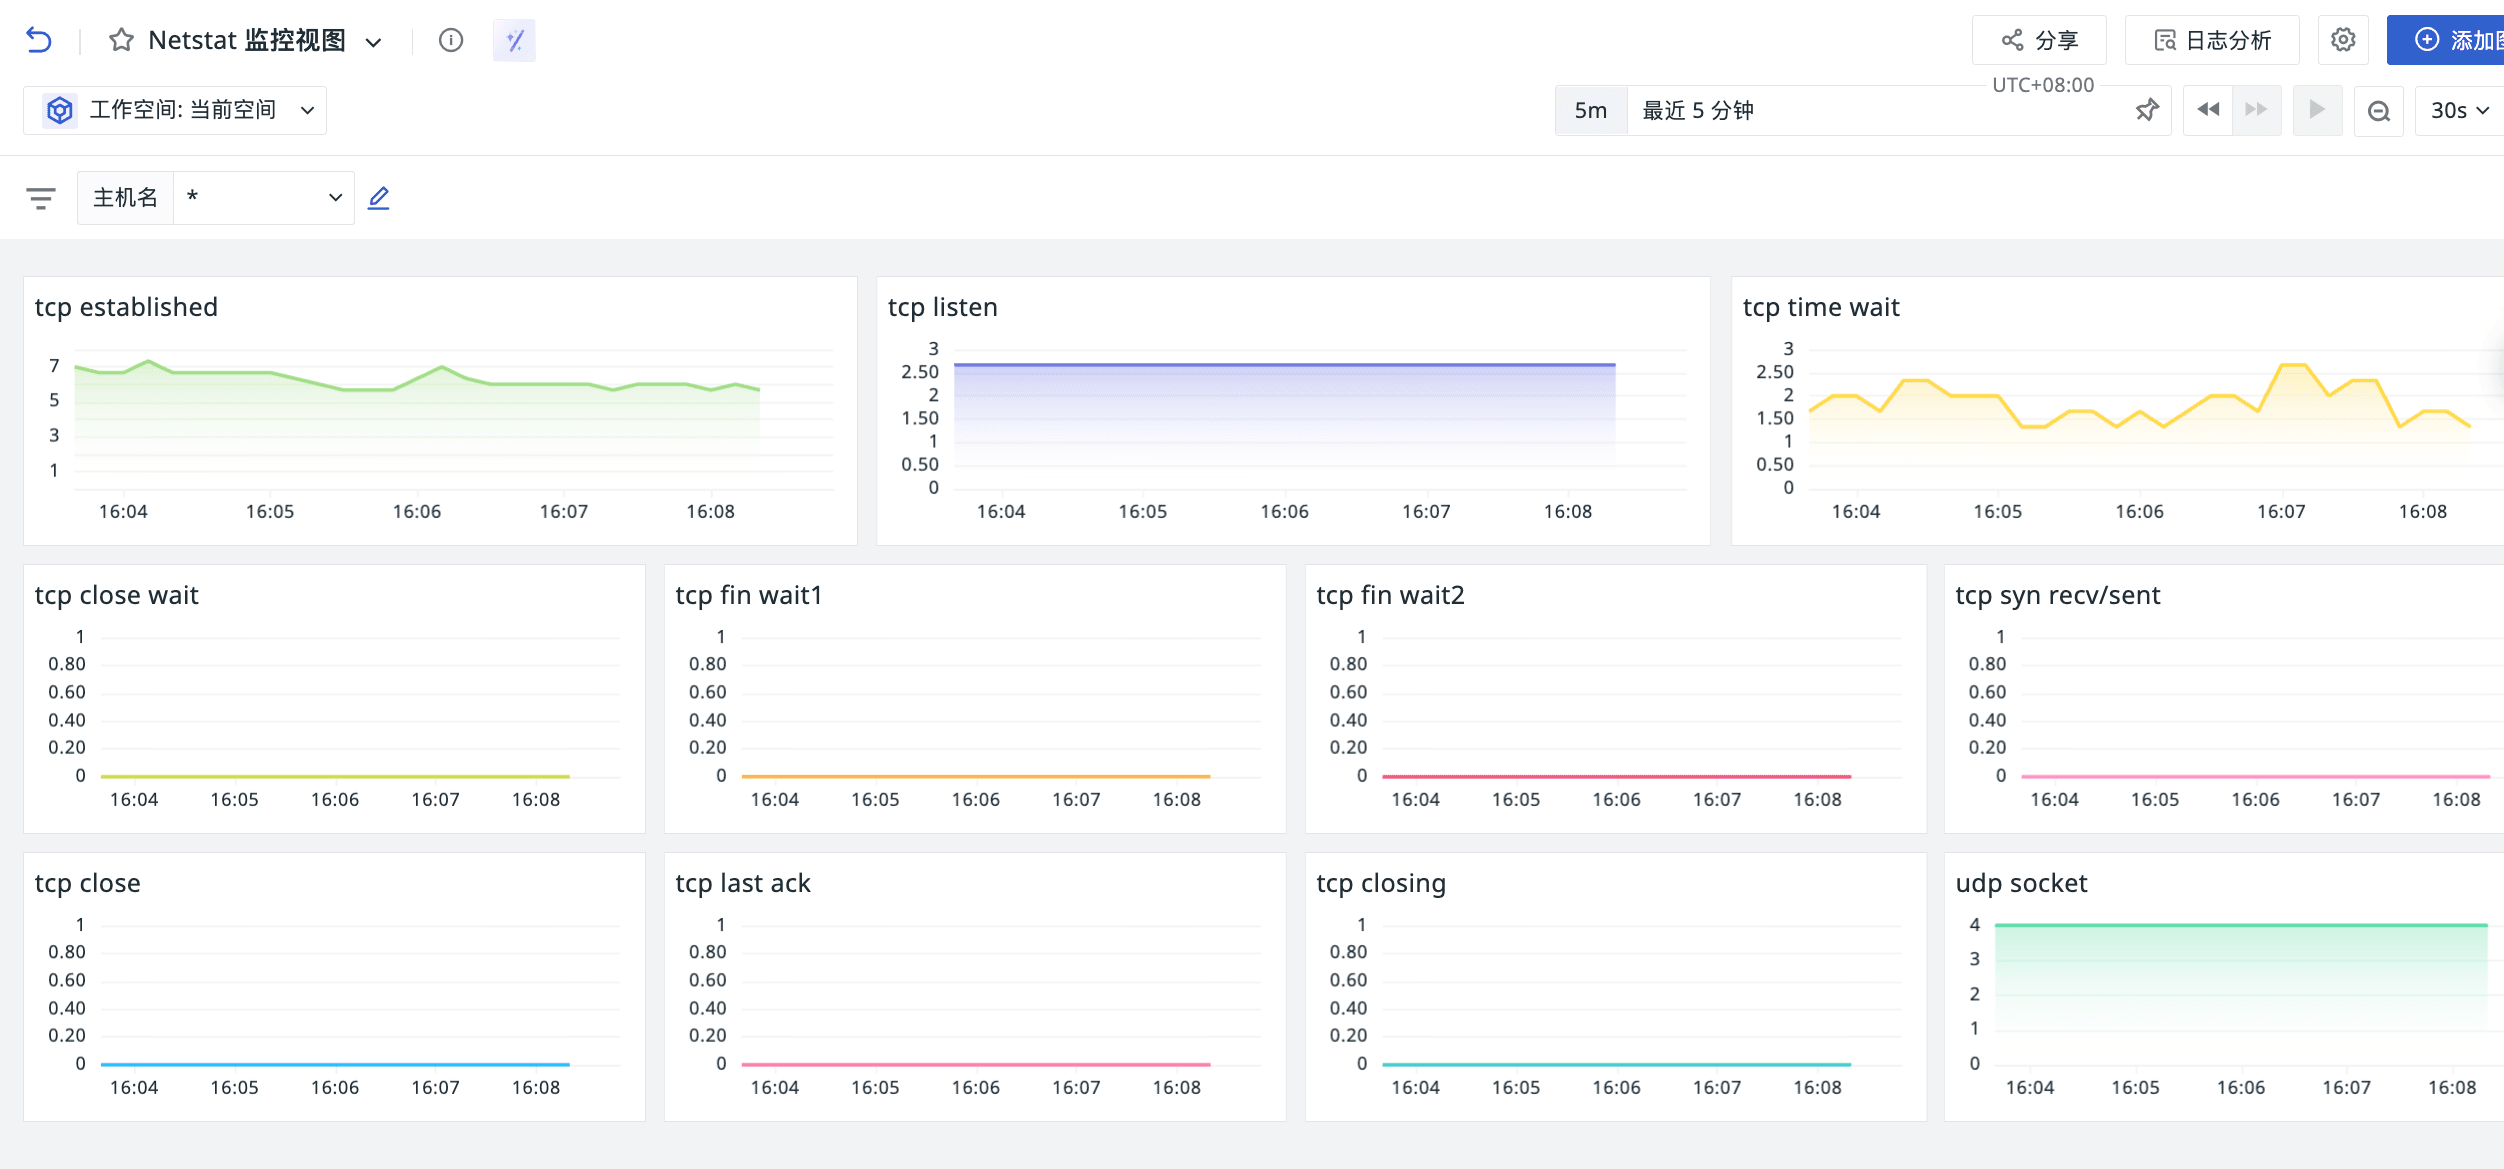
配置仪表板展示数据
进入观测云控制台,依次点击「场景」→「新建仪表板」,根据业务需求配置 NetStat 指标可视化图表,实现端口监控数据的直观展示。
配置监控器进行告警
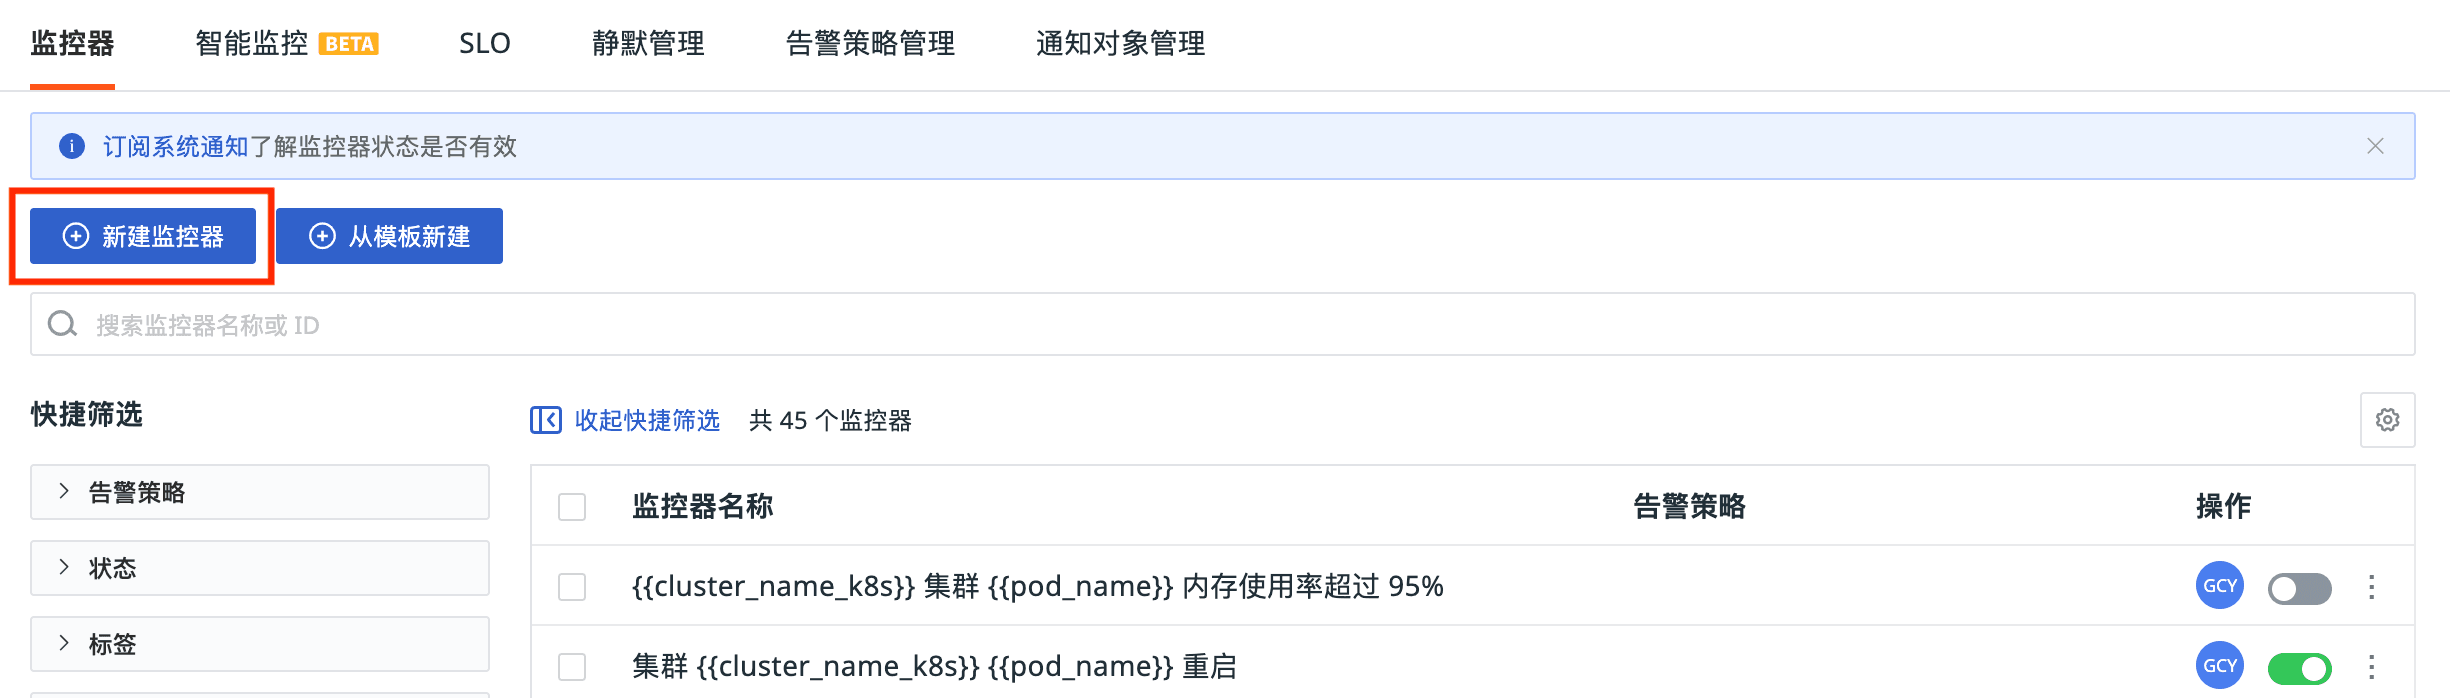
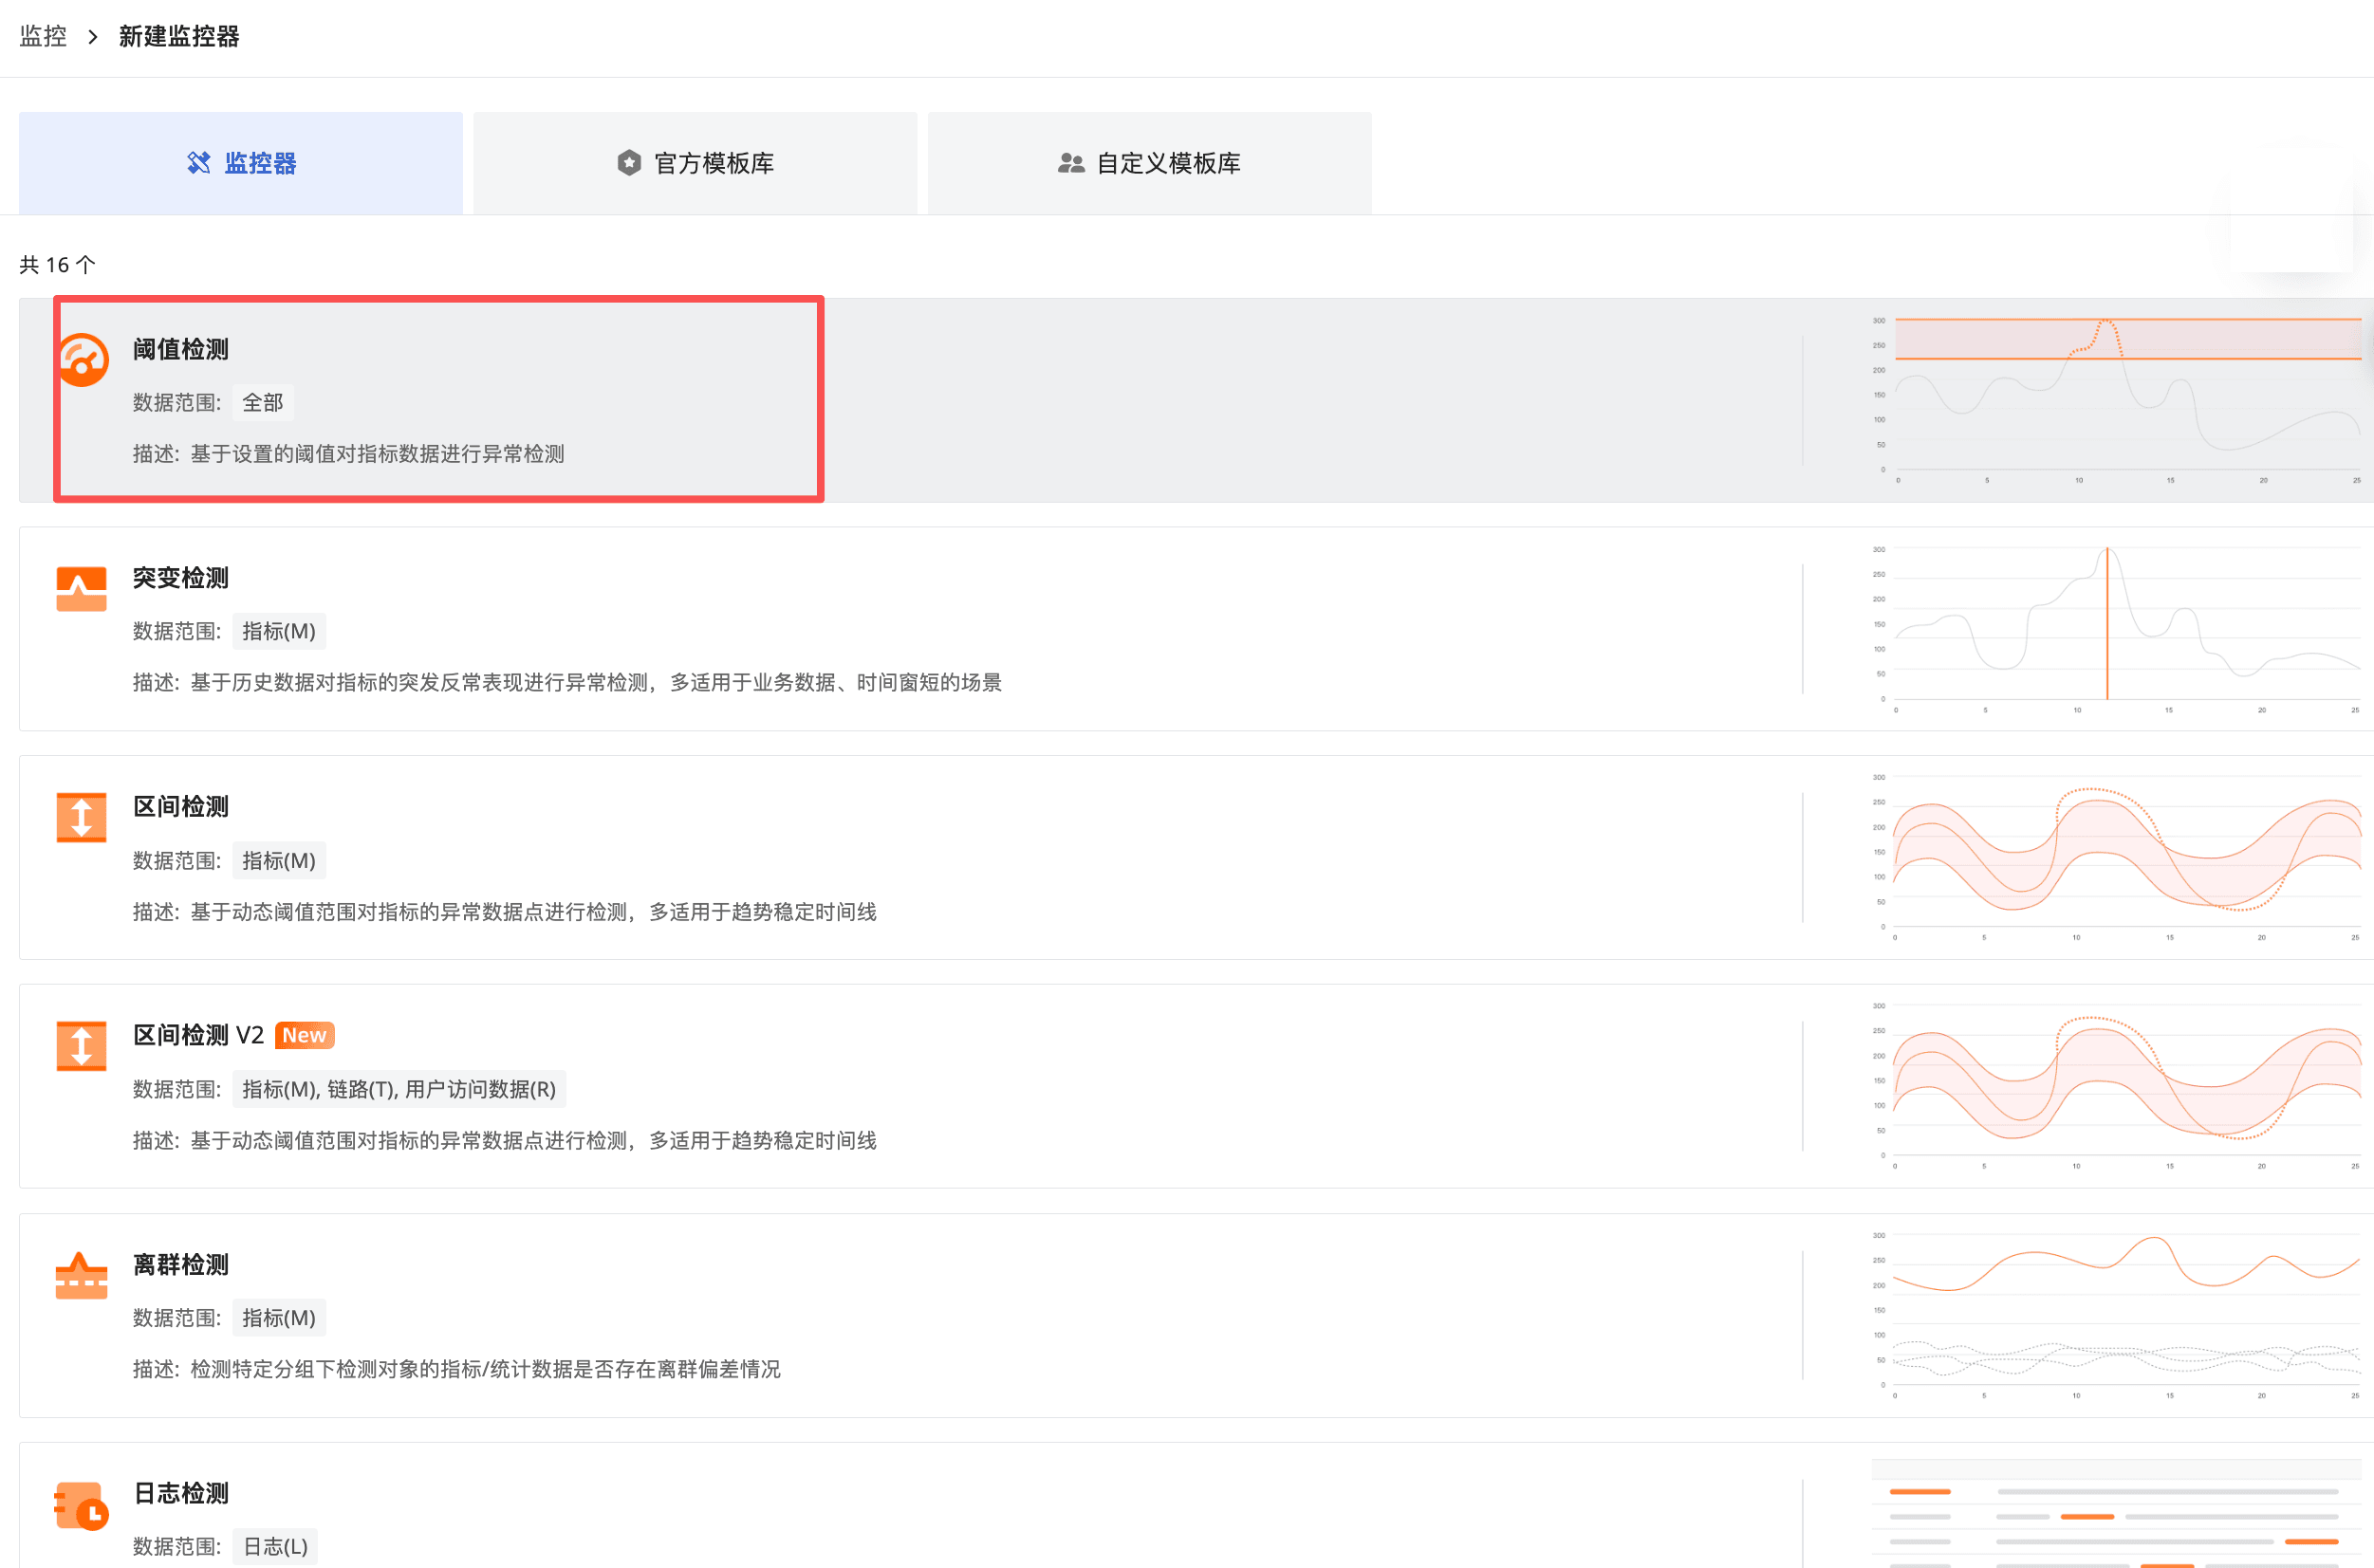
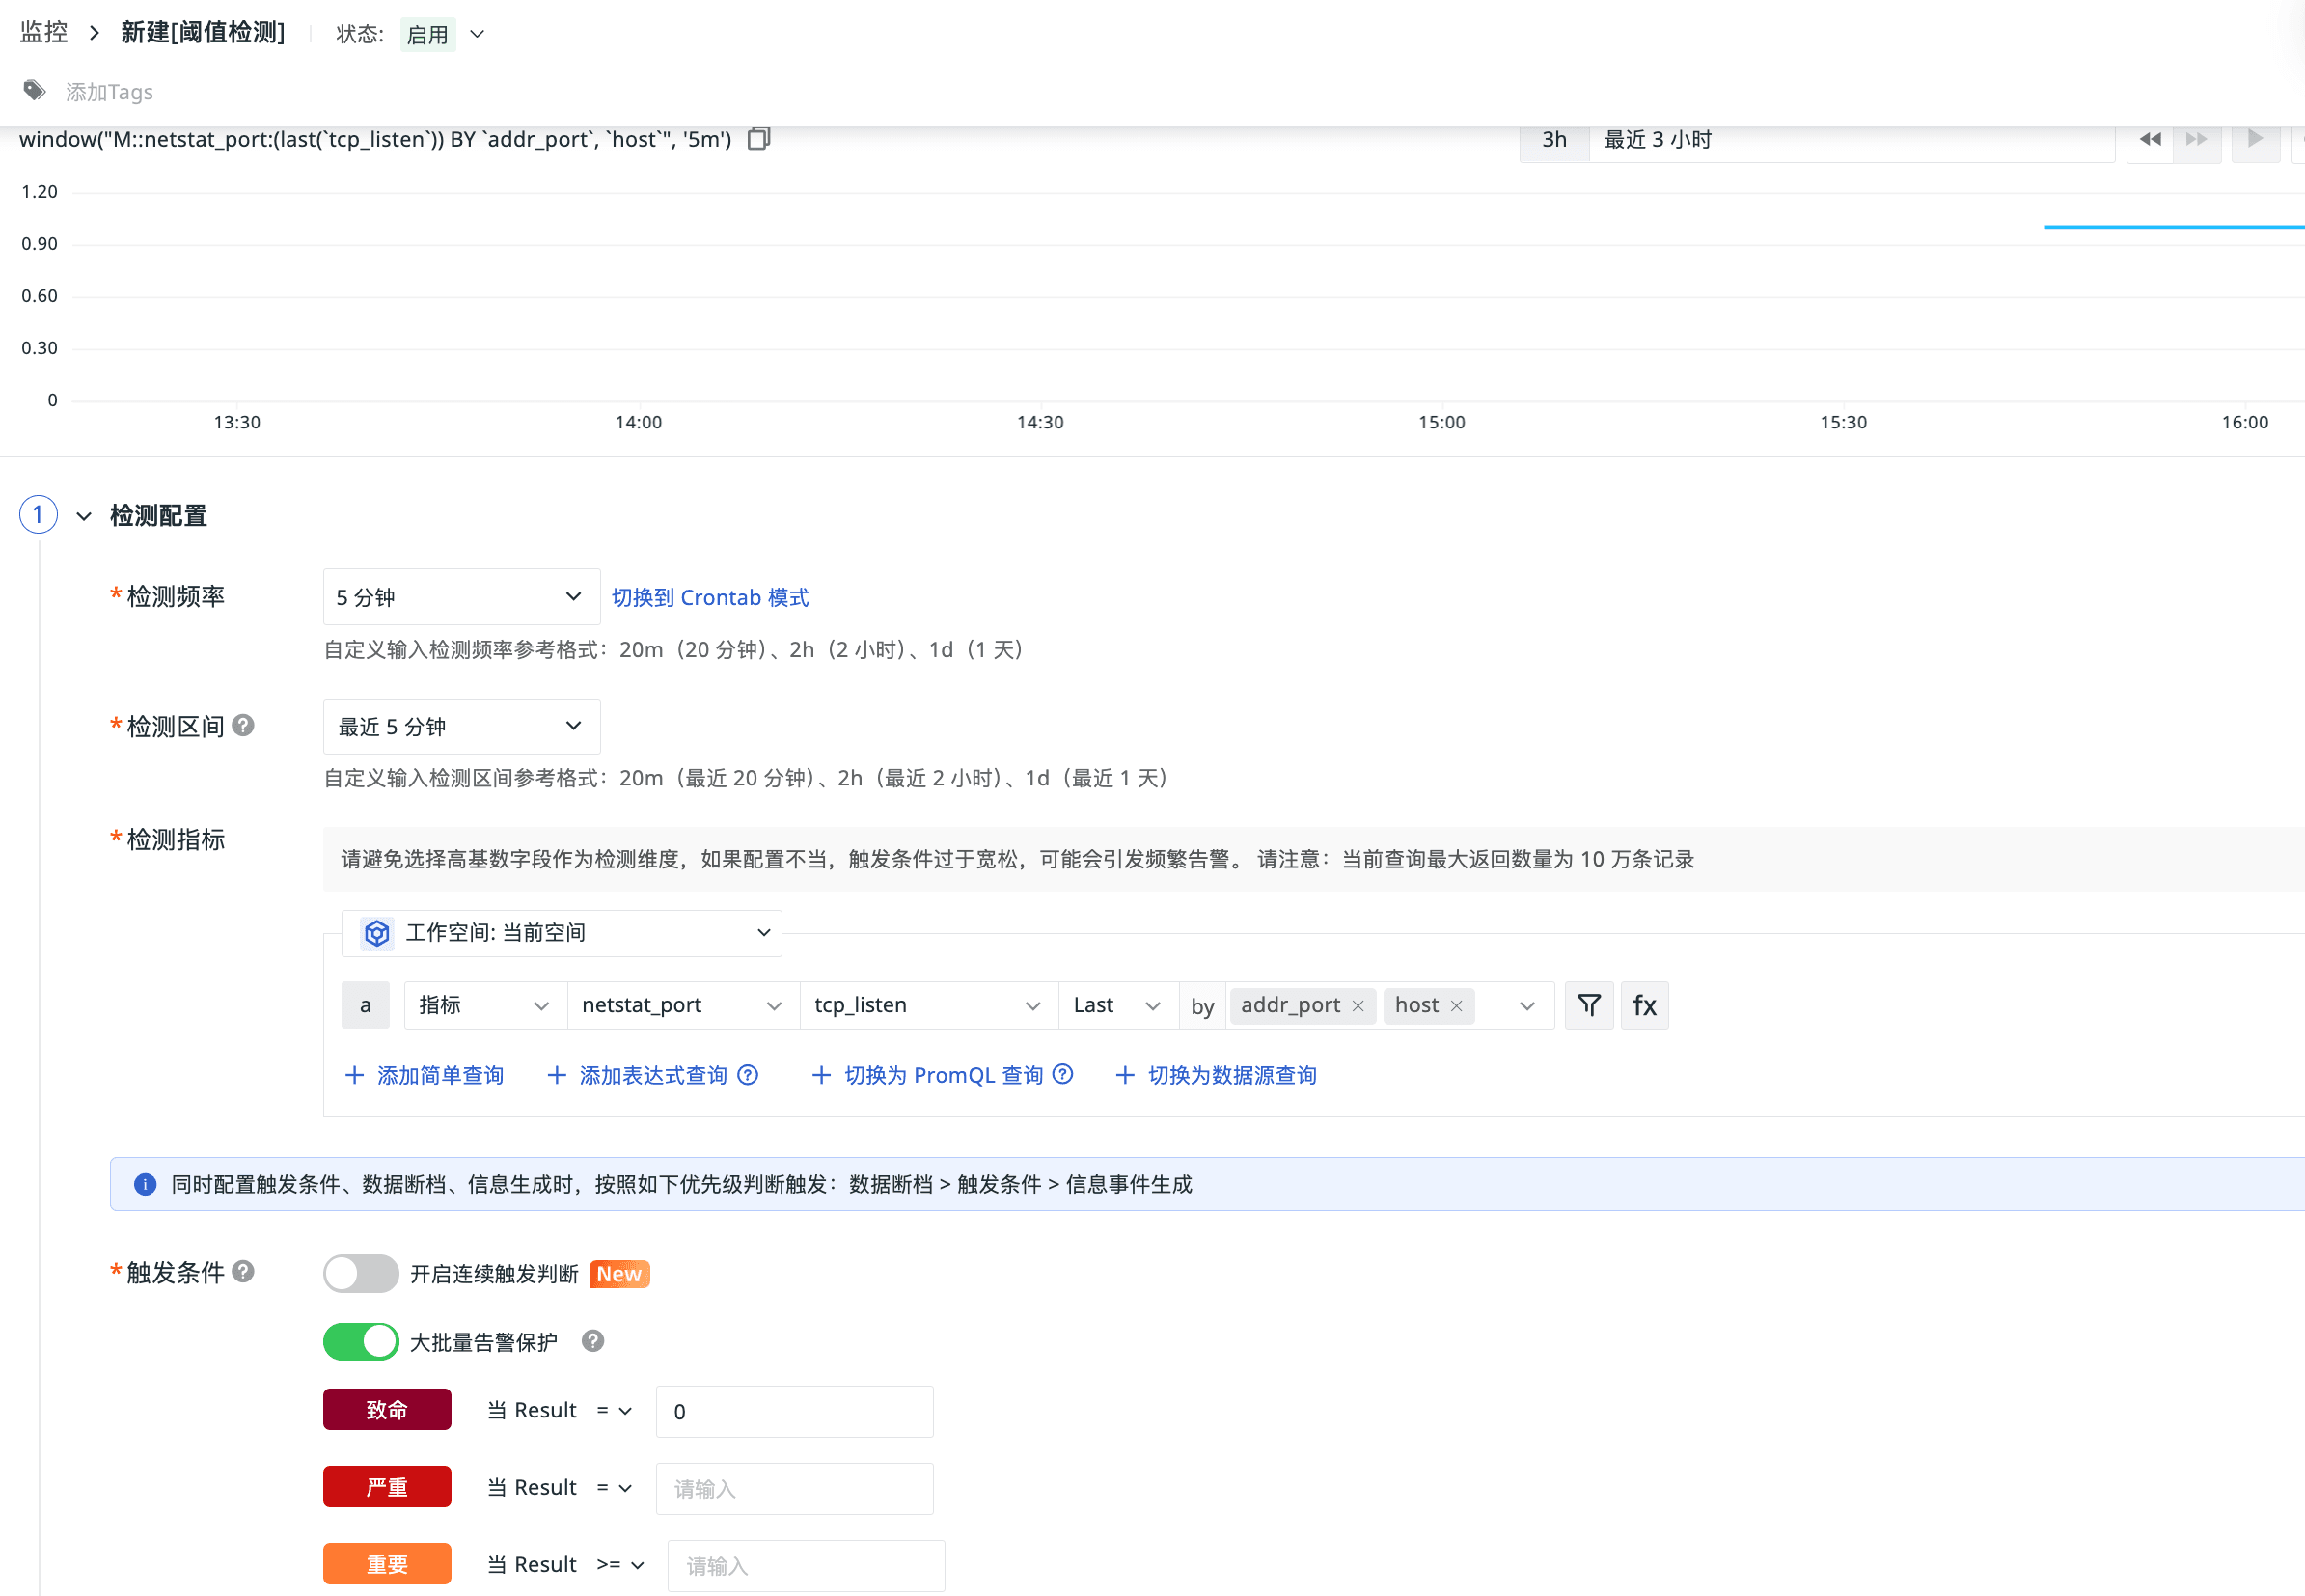
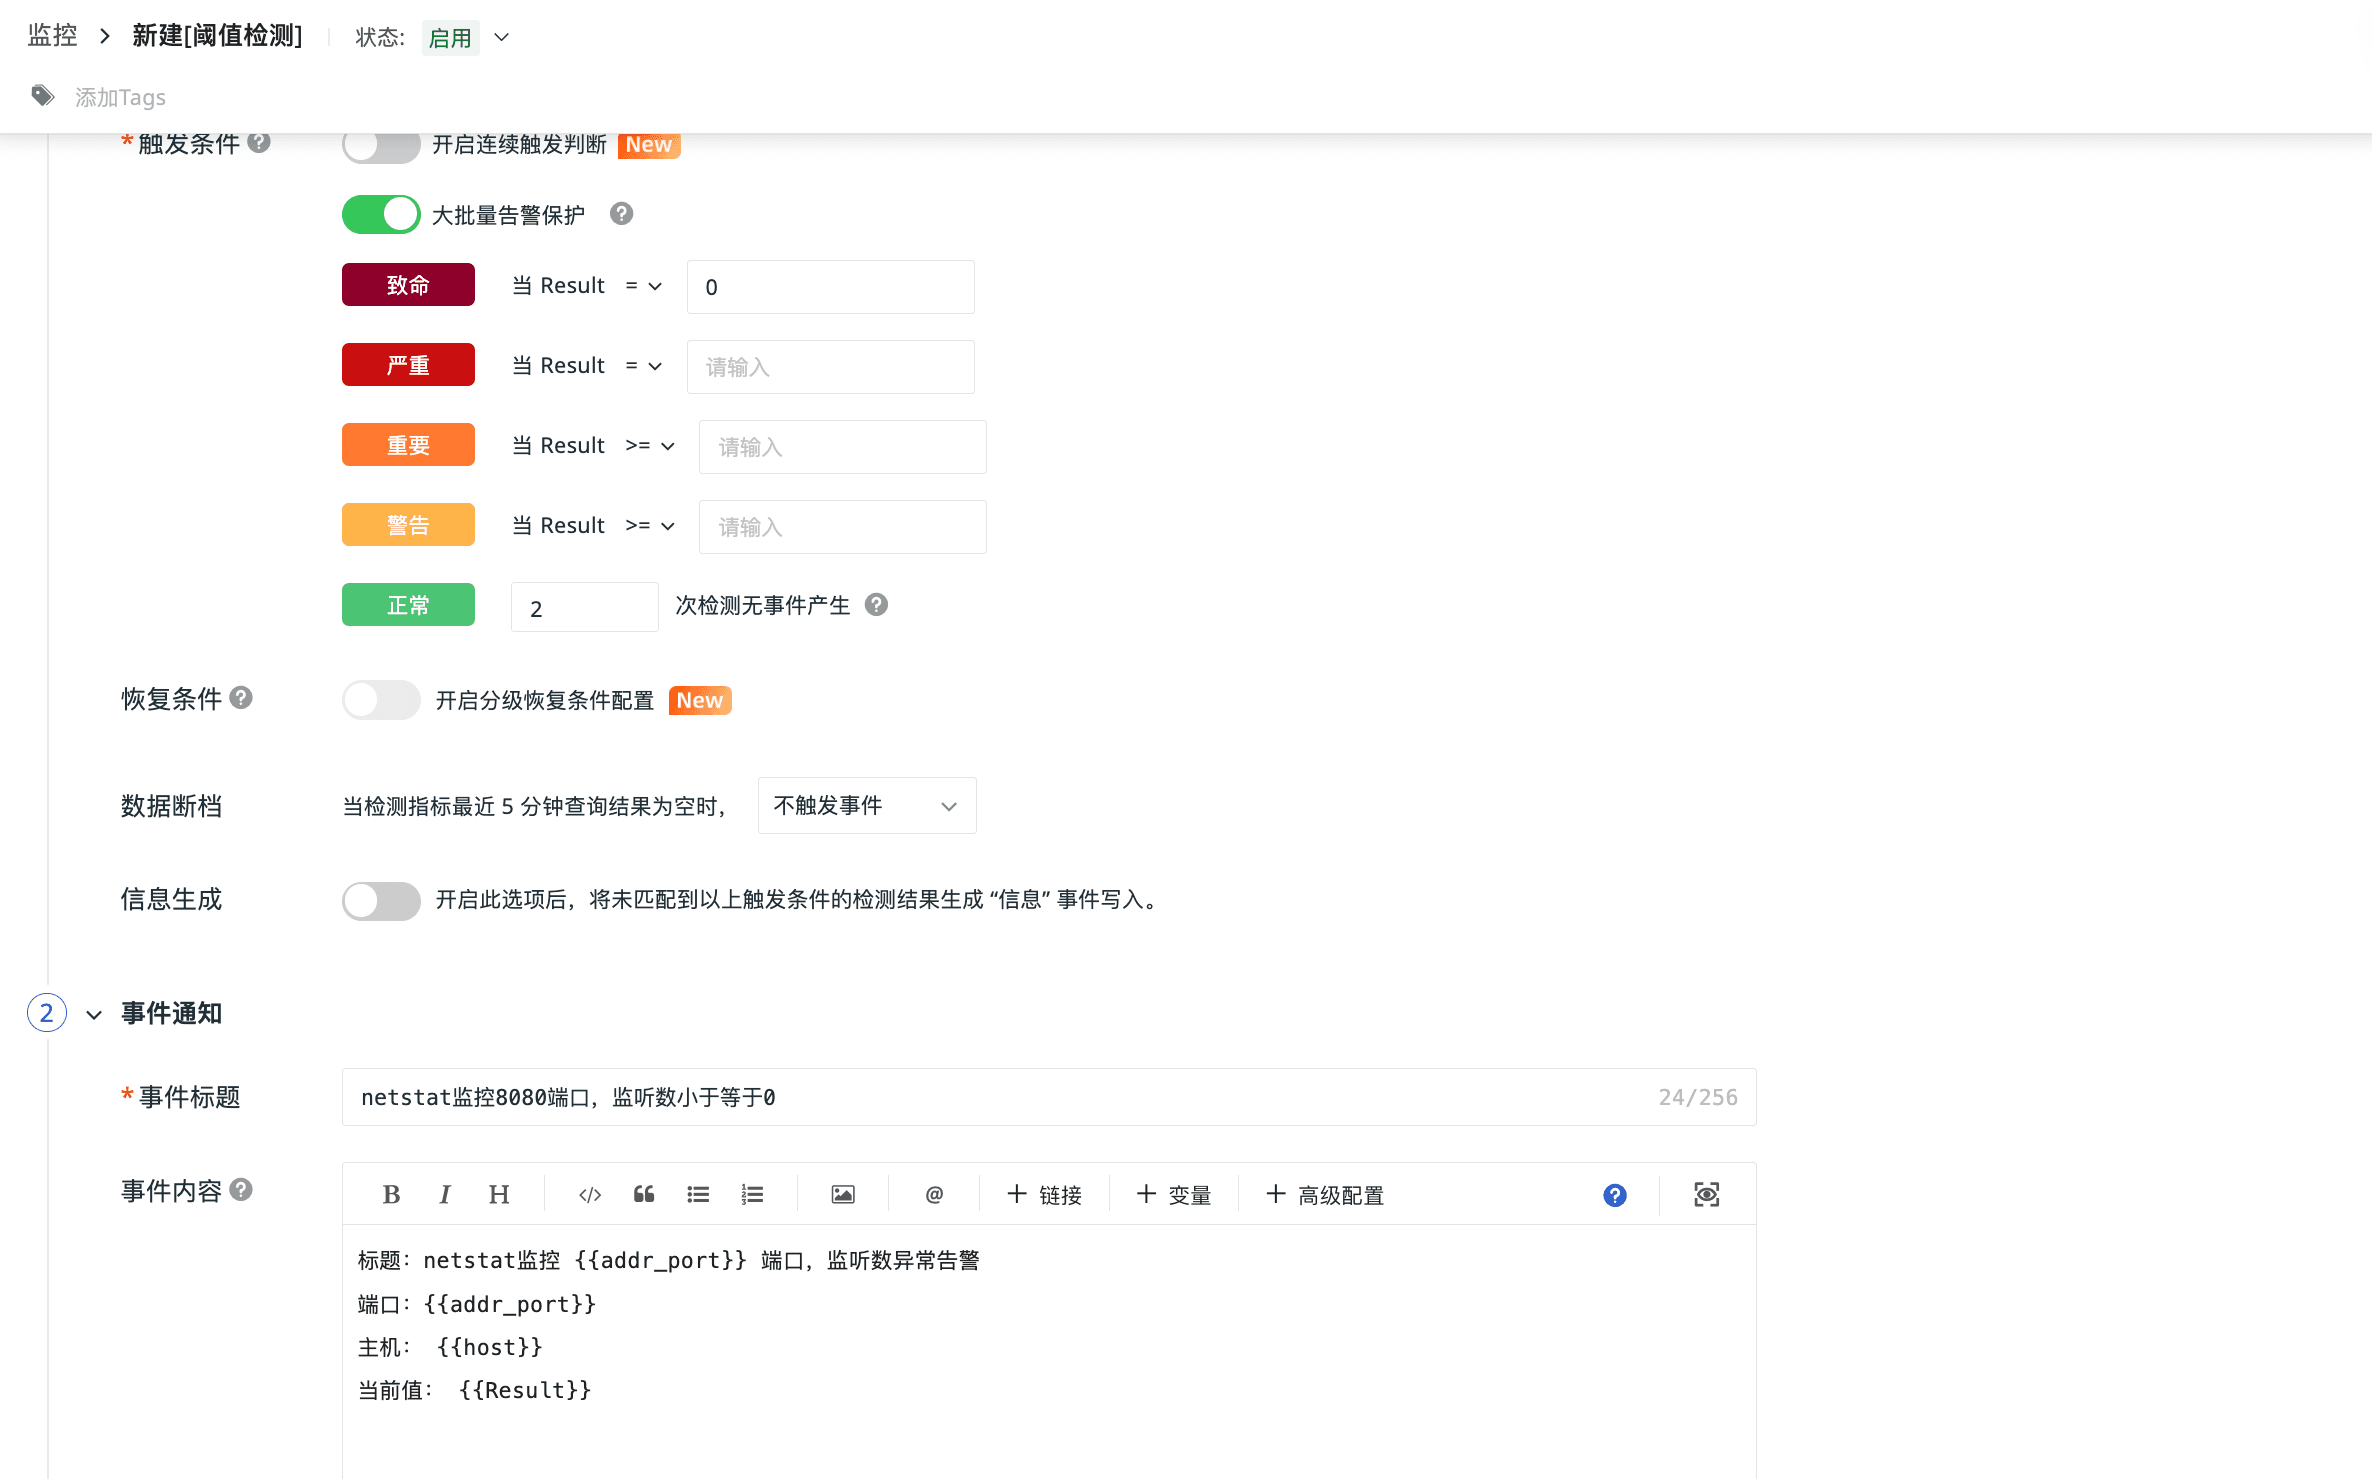
进入观测云控制台,依次点击「监控」→「监控器」→「新建监控器」,配置 8080 端口相关的异常告警规则,设置告警触发条件与推送渠道。
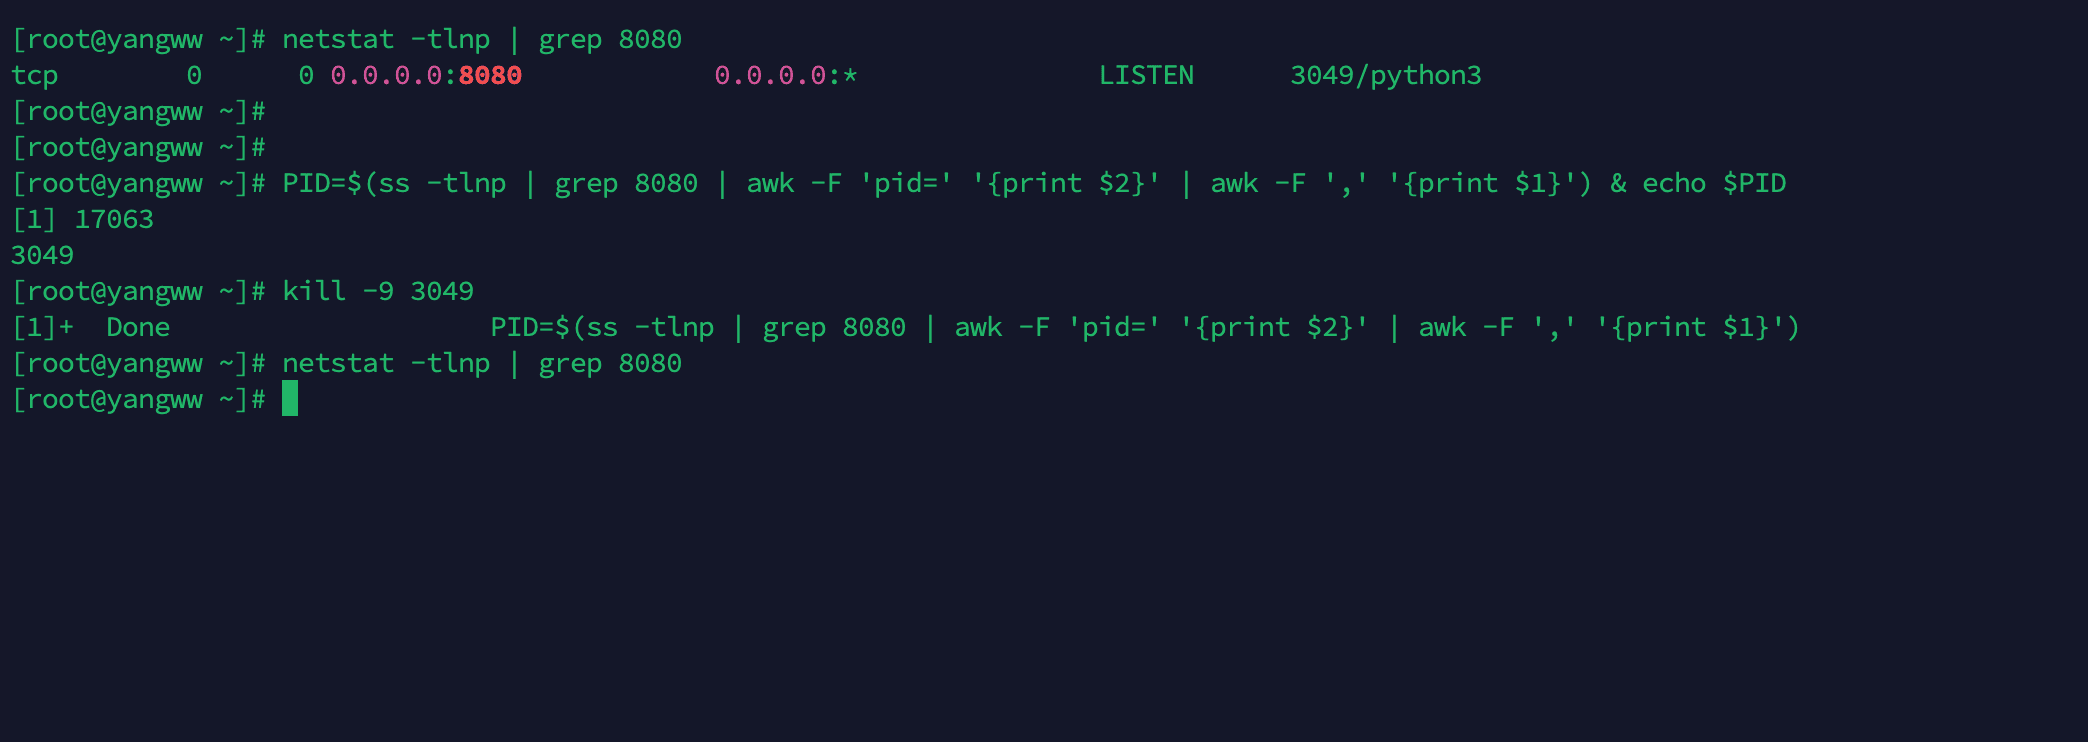
模拟服务端口异常
查找服务器上 8080 服务端口对应的运行进程,手动模拟进程关闭,触发端口异常场景。
异常触发后,企业微信端成功接收告警通知。
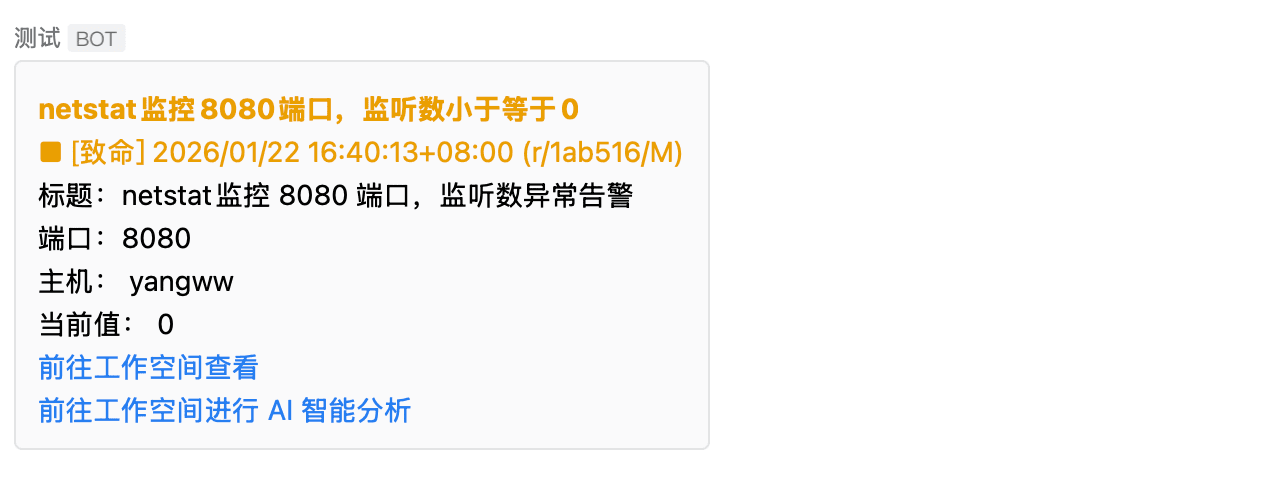
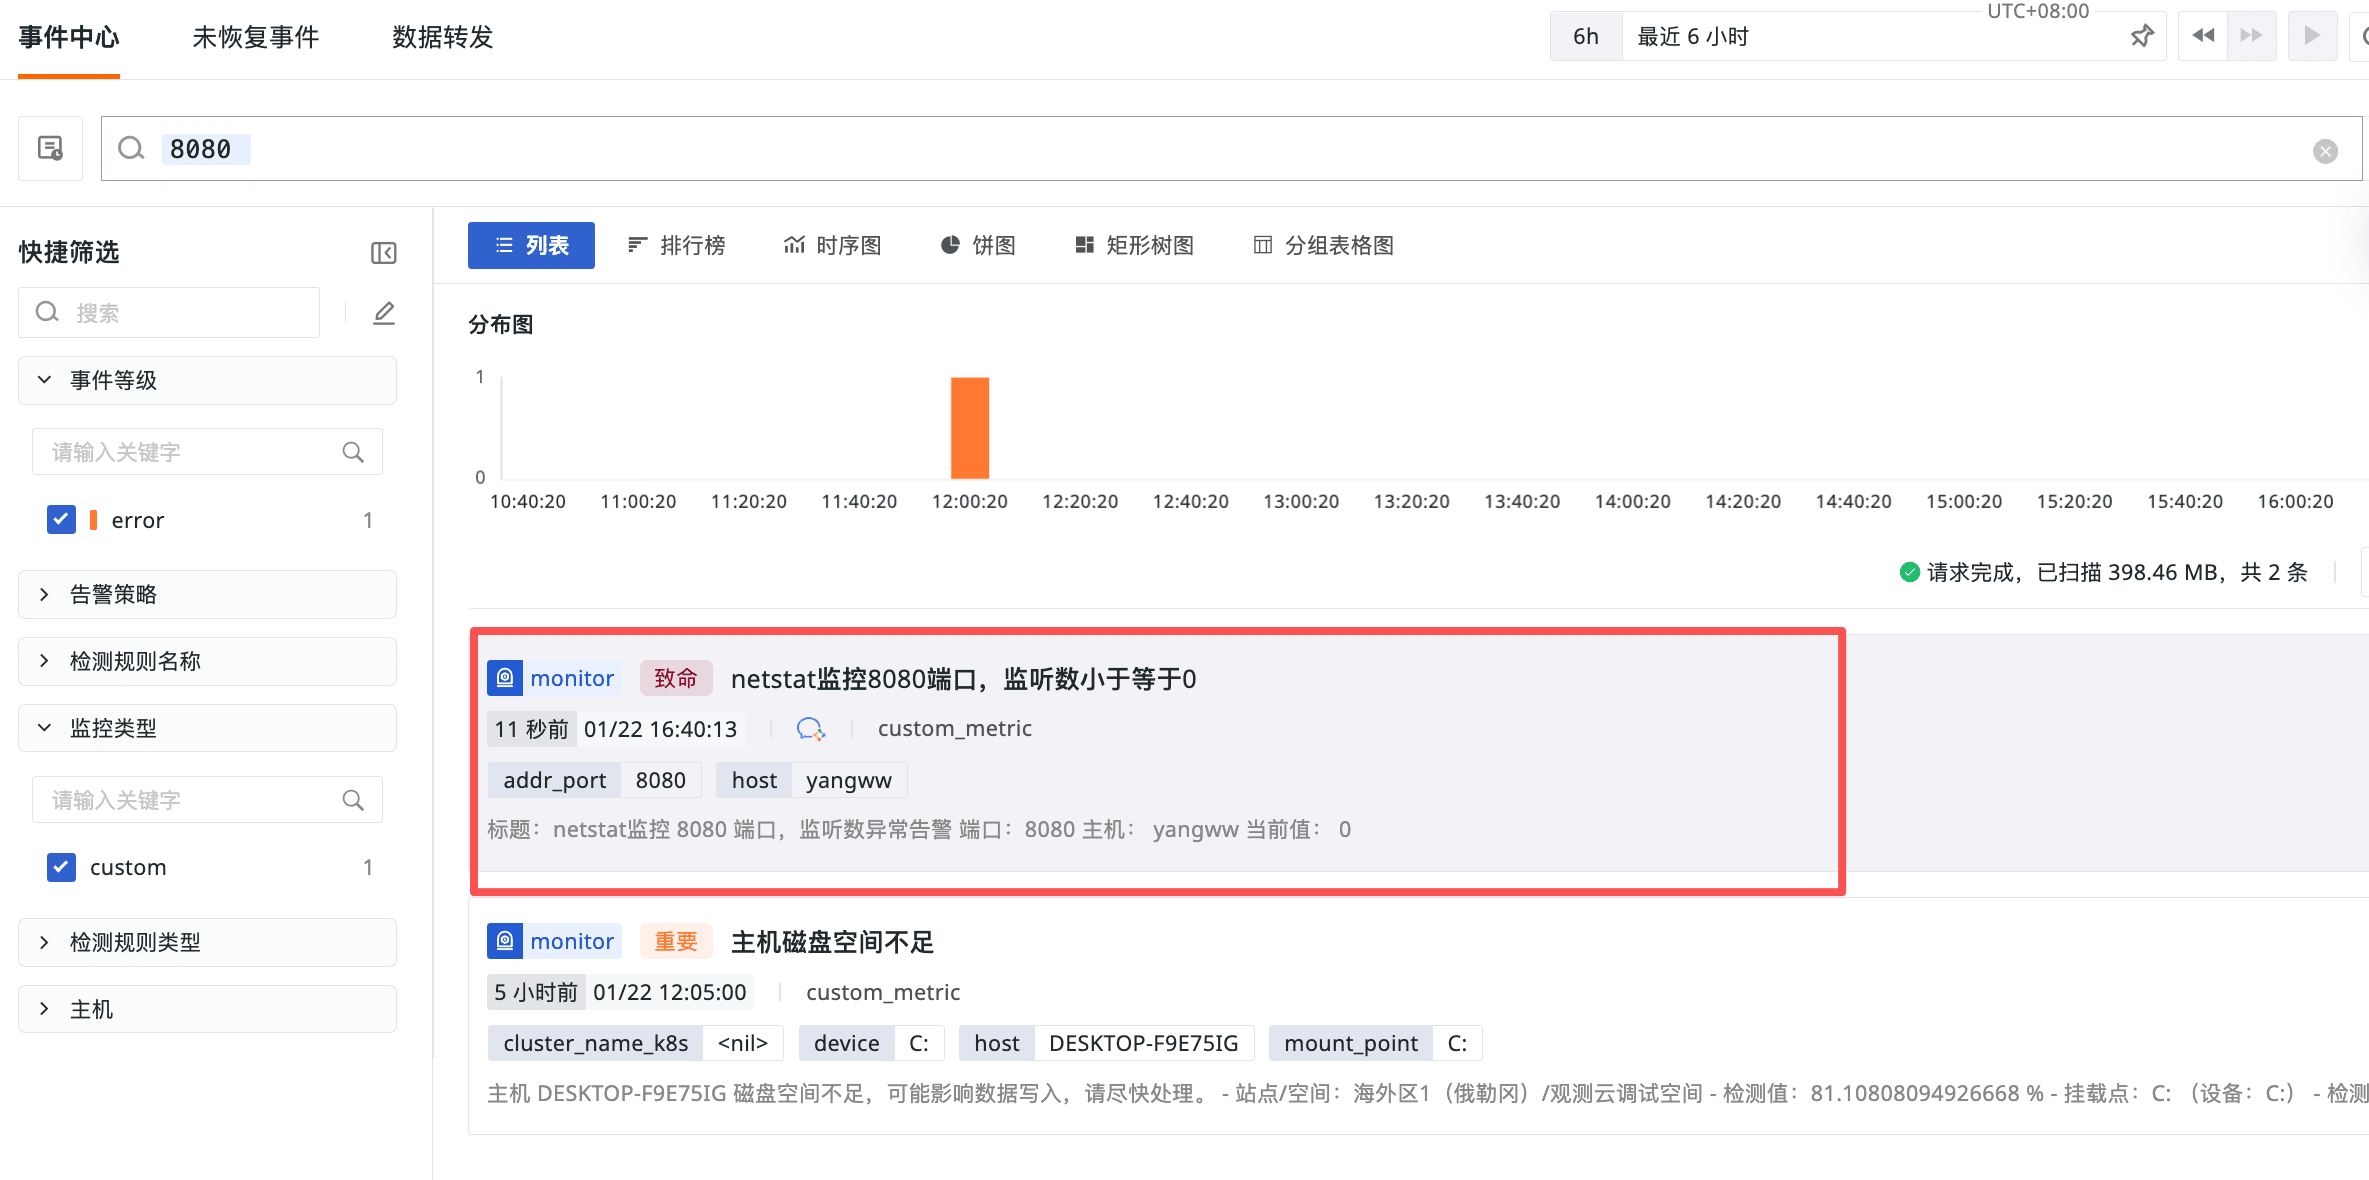
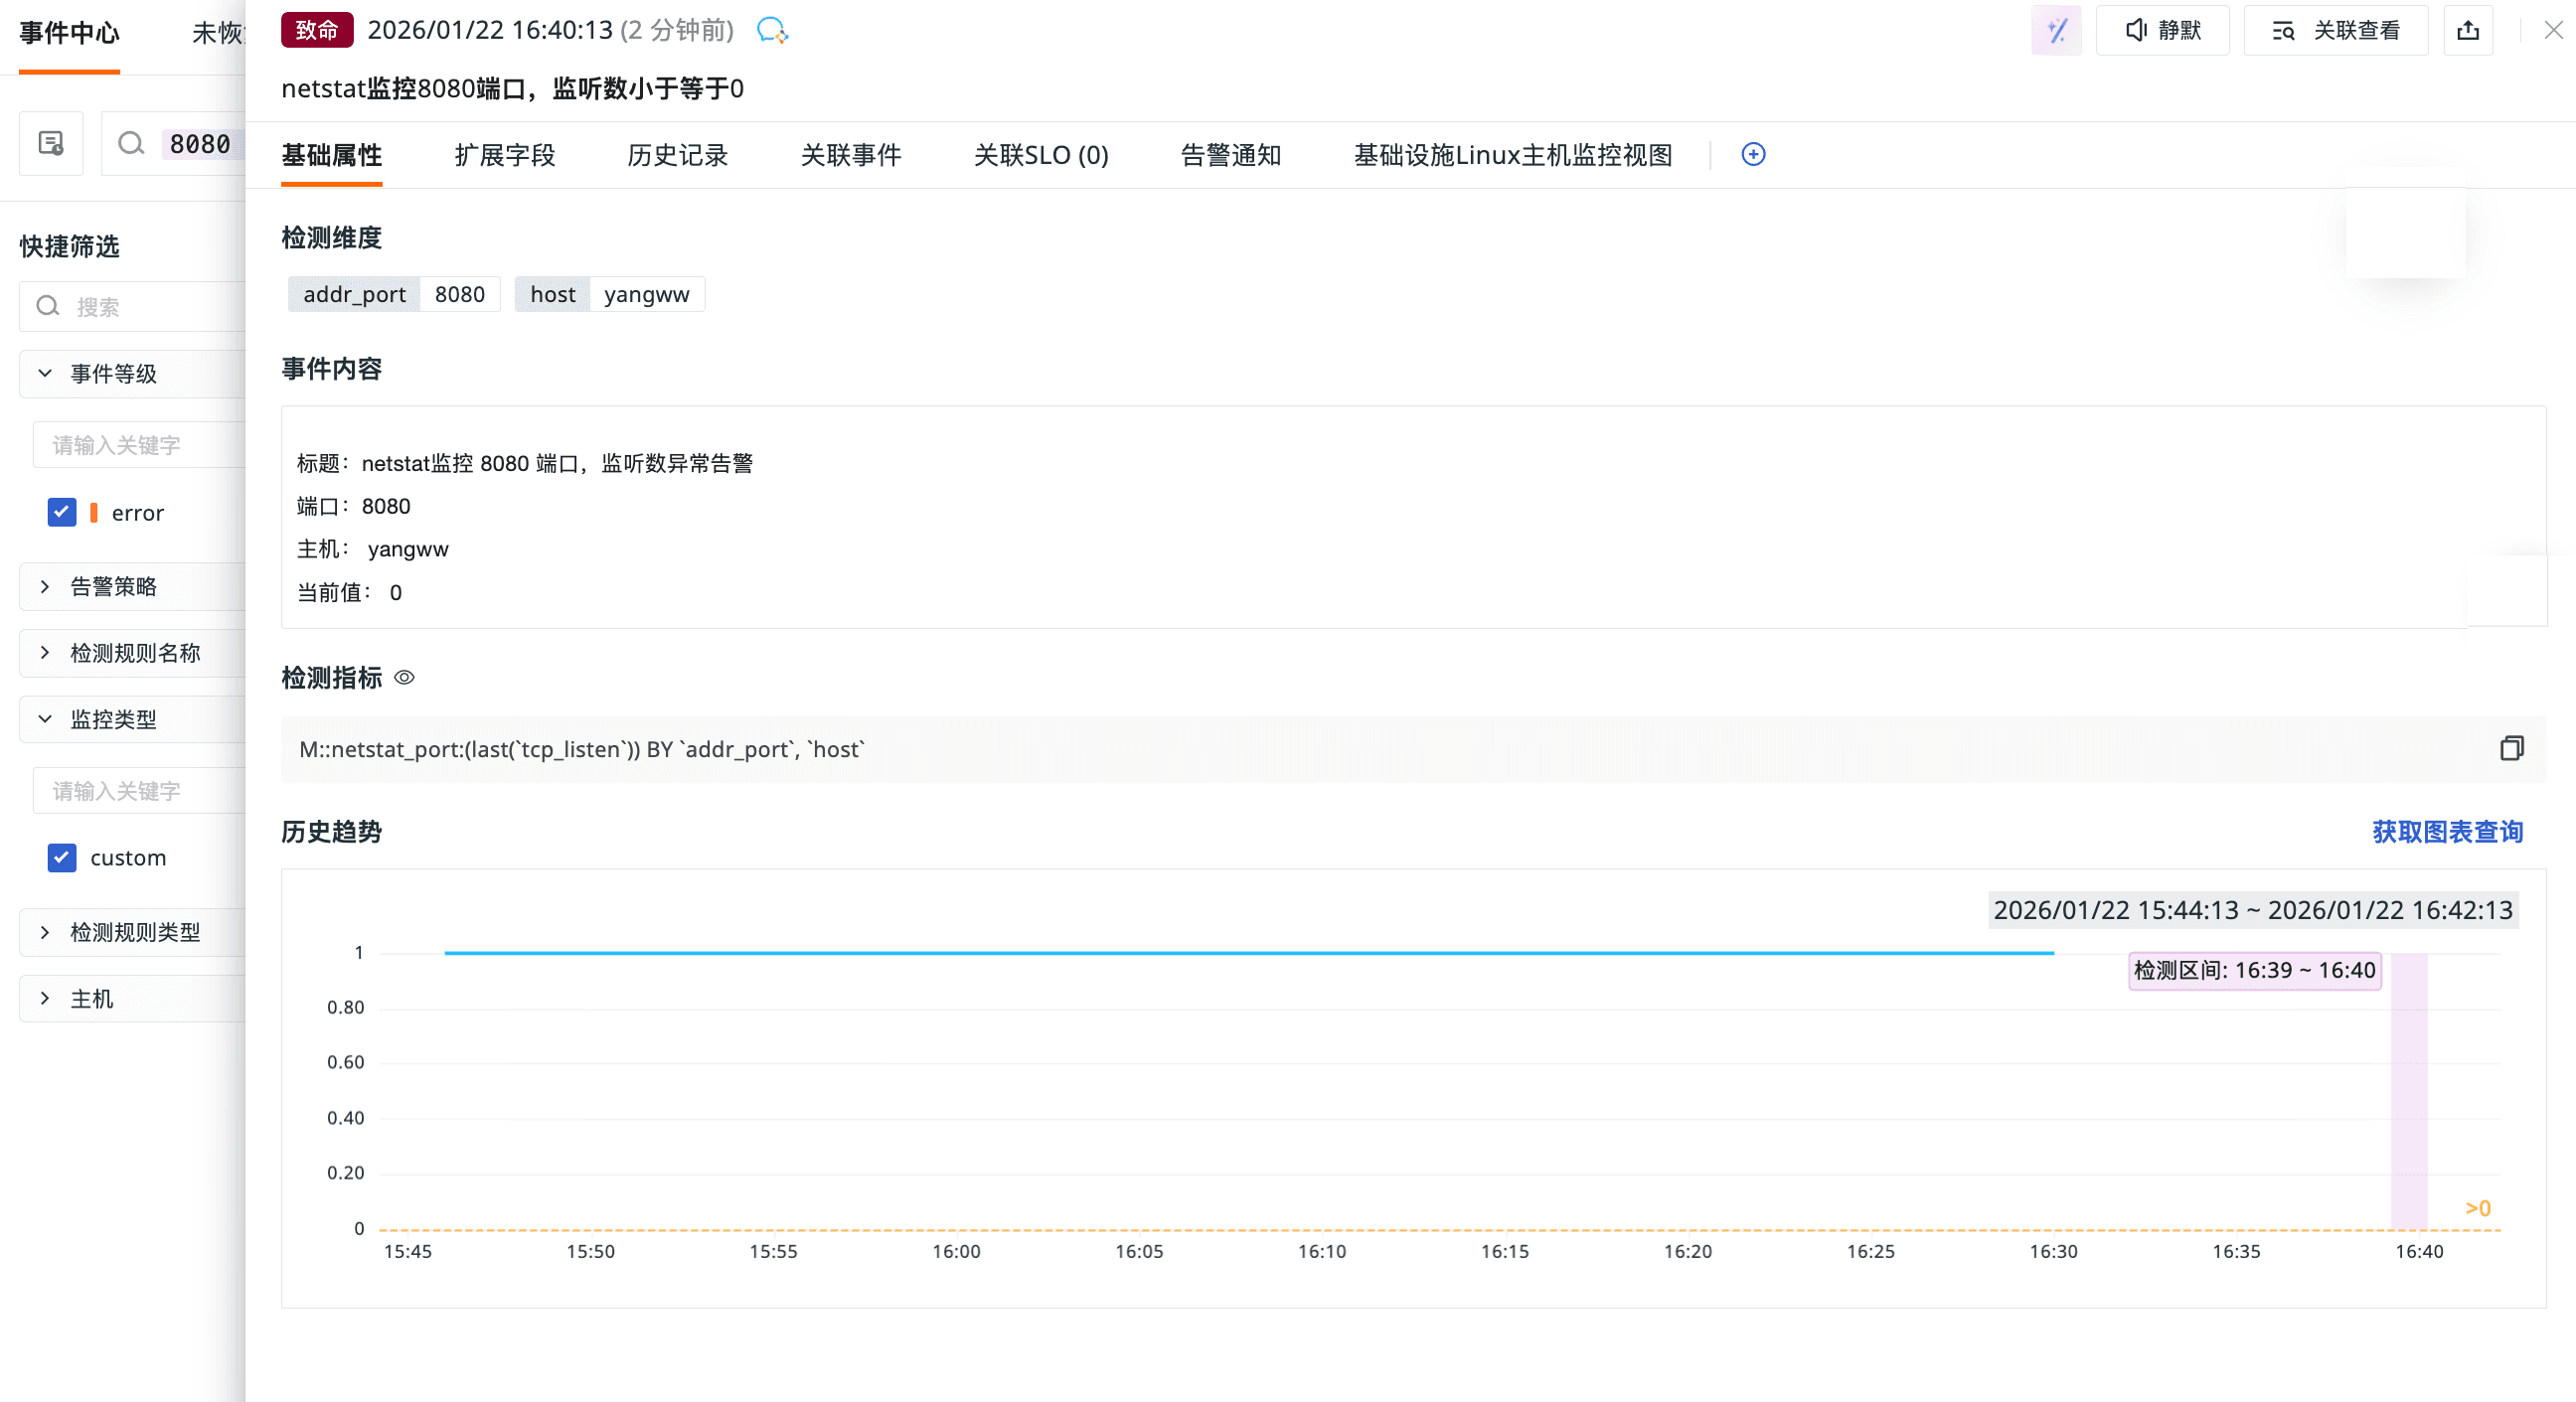
点击告警通知中的「前往工作空间查看」,可跳转到观测云控制台,查看详细的告警事件与指标异常详情。
总结
本次实践以观测云 + DataKit 为核心技术栈,完成了 Linux 环境下高可靠 NetStat 可观测体系的全流程落地。从基础的 DataKit 安装、NetStat 专属采集配置,到指标可视化仪表板搭建、精细化异常监控告警规则配置,再到端口异常模拟与告警接收全流程验证,通过保姆级的分步实操,成功实现对 8080 业务端口的精准网络指标监控,搭建起「采集 - 展示 - 告警 - 溯源」的端到端网络可观测闭环。