【Grafana】Grafana大版本升级后的Visualizations迁移说明

最近,由于现场使用的 Grafana-v8.4.10 版本被扫描出安全漏洞,于是将Grafana版本升级到官方发布的 Grafana-v10.4.19+security-01 安全版本。

版本升级前,需要将相关的 Dashboard 都导出来到本地备份,升级后再将导出的 Dashboard 再导入进去。

导入后发现,部分使用了 AngularJS 的老旧的 Visualizations 出现弃用(deprecated)的提示(如下图所示)。

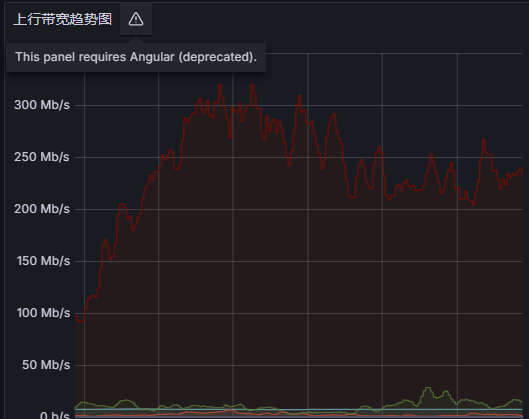
虽然Grafana 10.x版本目前还可以支持,但是Grafana 11以后的版本会取消支持。因此需要迁移到新的可视化界面。

查询了Grafana官网,发现官方已经给出了迁移建议。

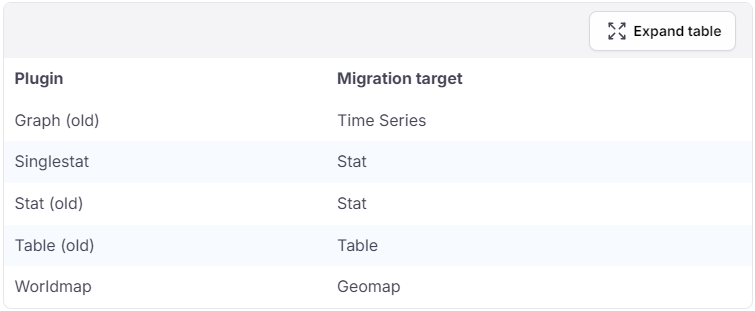
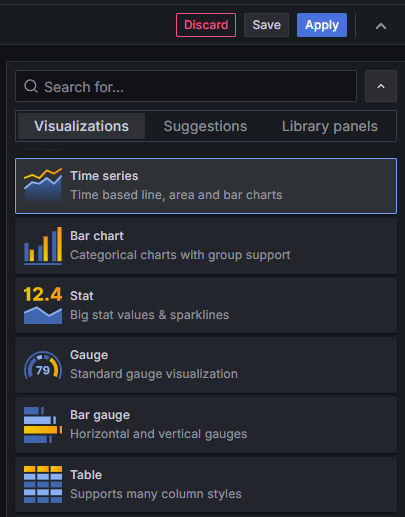
我这边主要涉及到Graph (old)以及Table (old)这两类,Graph (old) 需要迁移到 Time Series,Table (old) 需要迁移到 Table。

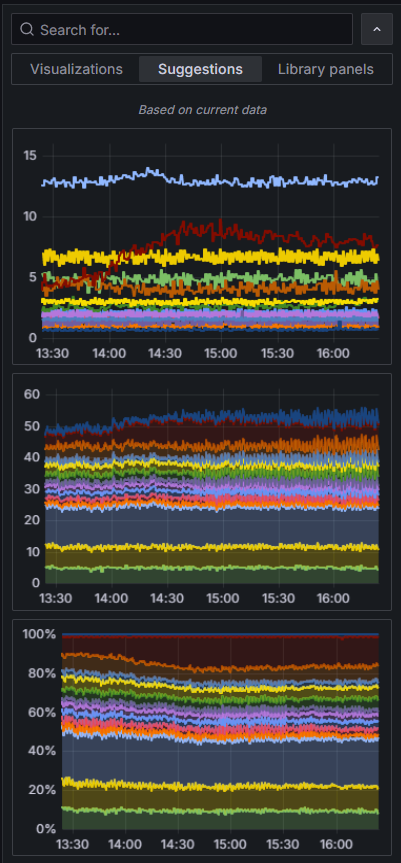
另外,新版本的 Grafana 也给出了推荐的Chart,平台自带,直接应用,还是很方便的。

参考:

https://grafana.com/docs/grafana/v10.4/developers/angular_deprecation/angular-plugins/

https://grafana.com/docs/grafana/v11.1/developers/angular_deprecation/angular-plugins/

https://grafana.com/docs/grafana/v12.1/developers/angular_deprecation/angular-plugins/

相关推荐
Elastic 中国社区官方博客9 小时前
使用 Observability Migration Platform 将 Datadog 和 Grafana 的仪表板与告警迁移到 Kibana
大数据·elasticsearch·搜索引擎·信息可视化·全文检索·grafana·datalog
sitellla9 小时前
Grafana Loki 入门:高效日志聚合系统
其他·grafana
日取其半万世不竭14 小时前
用 Netdata 实时监控服务器,比 Prometheus + Grafana 轻量得多
linux·服务器·网络·系统架构·负载均衡·zabbix·grafana
梵得儿SHI3 天前
(第二篇)Spring AI 架构设计与优化:可观察性体系,打造全链路可视化的 AI 运维方案
人工智能·微服务·grafana·prometheus·监控·可观察性·spring ai
何中应4 天前
Grafana如何给列表设置别名
运维·grafana·监控
xmlhcxr7 天前
基于 HAProxy+Keepalived 构建高可用 ZrLog 博客系统及监控平台实现(Prometheus + Grafana)
架构·grafana·prometheus
川石课堂软件测试7 天前
软件测试:典型面试题库
数据库·python·功能测试·mysql·单元测试·grafana·prometheus
杜子不疼.9 天前
无需公网 IP!Grafana+内网穿透轻松实现数据看板远程访问
网络协议·tcp/ip·grafana
川石课堂软件测试13 天前
requests接口自动化测试
数据库·python·功能测试·测试工具·单元测试·grafana·prometheus
自不量力的A同学13 天前
Grafana 13.0.1 发布
grafana