实现效果: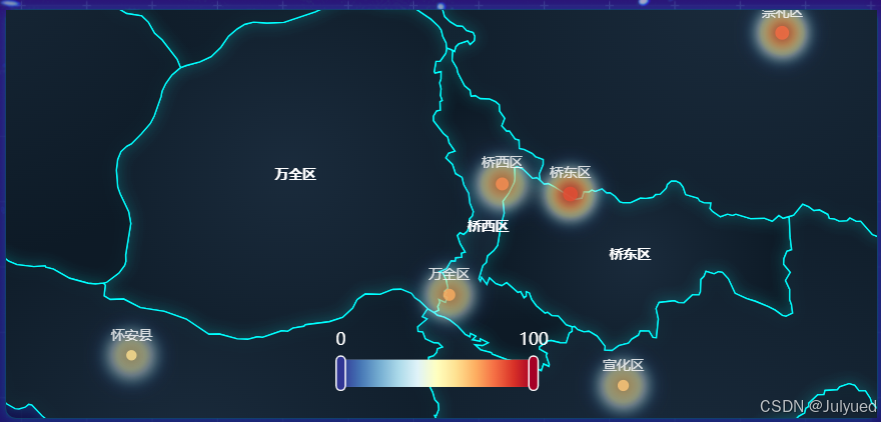
1.新建一个vue文件作为热力图组件
2.开发(可直接复制)
<template>
  <div class="heatmap-component">
    <div ref="heatmapRef" class="heatmap-container"></div>
  </div>
</template>

<script setup>
import { ref, onMounted, onUnmounted, watch } from 'vue'
import * as echarts from 'echarts'

const props = defineProps({
  title: {
    type: String,
    // default: '问卷调研热力图',
  },
  data: {
    type: Array,
    default: () => [],
  },
})

const heatmapRef = ref(null)
let chart = null

// 初始化热力图
const initChart = () => {
  if (!heatmapRef.value) return

  chart = echarts.init(heatmapRef.value)

  // 张家口各区县数据
  const zhangjiakouData = [
    { name: '桥东区', value: [114.97, 40.82, 85] },
    { name: '桥西区', value: [114.88, 40.83, 75] },
    { name: '宣化区', value: [115.04, 40.63, 65] },
    { name: '下花园区', value: [115.21, 40.46, 55] },
    { name: '万全区', value: [114.81, 40.72, 70] },
    { name: '崇礼区', value: [115.25, 40.98, 80] },
    { name: '张北县', value: [114.7, 41.15, 60] },
    { name: '康保县', value: [114.6, 41.87, 50] },
    { name: '沽源县', value: [115.68, 41.68, 55] },
    { name: '尚义县', value: [113.95, 41.0, 45] },
    { name: '蔚县', value: [114.53, 39.83, 75] },
    { name: '阳原县', value: [114.15, 40.12, 65] },
    { name: '怀安县', value: [114.39, 40.66, 60] },
    { name: '怀来县', value: [115.54, 40.35, 80] },
    { name: '涿鹿县', value: [115.2, 40.37, 70] },
    { name: '赤城县', value: [115.82, 40.92, 65] },
  ]

  // 中国地图热力图配置
  const option = {
    title: {
      text: props.title,
      left: 'center',
      textStyle: {
        color: '#fff',
        fontSize: 16,
        fontWeight: 'bold',
      },
    },
    visualMap: {
      min: 0,
      max: 100,
      calculable: true,
      orient: 'horizontal',
      left: 'center',
      bottom: '5%',
      textStyle: {
        color: '#fff',
      },
      inRange: {
        color: [
          '#313695',
          '#4575b4',
          '#74add1',
          '#abd9e9',
          '#e0f3f8',
          '#ffffbf',
          '#fee090',
          '#fdae61',
          '#f46d43',
          '#d73027',
          '#a50026',
        ],
      },
    },
    series: [
      {
        name: '问卷调研热度',
        type: 'scatter',
        coordinateSystem: 'geo',
        data: props.data.length > 0 ? props.data : zhangjiakouData,
        symbolSize: function (val) {
          return val[2] / 8
        },
        label: {
          show: true,
          position: 'top',
          formatter: '{b}',
          color: '#fff',
          fontSize: 10,
        },
        itemStyle: {
          color: function (params) {
            // 根据值的大小返回不同颜色
            const value = params.value[2]
            if (value > 80) return '#ff4500'
            if (value > 70) return '#ff8c00'
            if (value > 60) return '#ffd700'
            if (value > 50) return '#32cd32'
            return '#4682b4'
          },
          opacity: 0.8,
          shadowBlur: 10,
          shadowColor: 'rgba(0, 0, 0, 0.5)',
        },
        emphasis: {
          itemStyle: {
            shadowBlur: 20,
            shadowColor: 'rgba(0, 0, 0, 0.8)',
          },
        },
      },
      {
        name: '热度区域',
        type: 'heatmap',
        coordinateSystem: 'geo',
        data:
          props.data.length > 0
            ? props.data
            : zhangjiakouData.map((item) => [
                item.value[0],
                item.value[1],
                item.value[2],
              ]),
        pointSize: 20,
        blurSize: 15,
        label: {
          show: false,
        },
        emphasis: {
          itemStyle: {
            shadowBlur: 10,
            shadowColor: 'rgba(0, 0, 0, 0.5)',
          },
        },
      },
    ],
  }

  // 加载张家口市地图数据(包含区县边界)
  fetch('https://geo.datav.aliyun.com/areas_v3/bound/130700_full.json')
    .then((response) => response.json())
    .then((geoJson) => {
      echarts.registerMap('zhangjiakou', geoJson)
      option.geo = {
        map: 'zhangjiakou',
        roam: true,
        zoom: 8,
        center: [114.8, 40.8], // 张家口市中心坐标
        label: {
          show: true,
          color: '#fff',
          fontSize: 10,
          fontWeight: 'bold',
        },
        itemStyle: {
          normal: {
            areaColor: {
              type: 'radial',
              x: 0.5,
              y: 0.5,
              r: 0.8,
              colorStops: [
                {
                  offset: 0,
                  color: '#1a2b3c', // 中心颜色
                },
                {
                  offset: 1,
                  color: '#0d1a26', // 边缘颜色
                },
              ],
            },
            borderColor: '#00ffff',
            borderWidth: 1,
            shadowBlur: 10,
            shadowColor: 'rgba(0, 255, 255, 0.2)',
          },
          emphasis: {
            areaColor: {
              type: 'radial',
              x: 0.5,
              y: 0.5,
              r: 0.8,
              colorStops: [
                {
                  offset: 0,
                  color: '#2a3b4c', // 中心颜色
                },
                {
                  offset: 1,
                  color: '#1d2a36', // 边缘颜色
                },
              ],
            },
            borderColor: '#00ffff',
            borderWidth: 2,
            shadowBlur: 15,
            shadowColor: 'rgba(0, 255, 255, 0.3)',
          },
        },
      }
      chart.setOption(option)
    })
    .catch((error) => {
      console.error('Failed to load map data:', error)
      // 如果地图数据加载失败,显示备用样式
      chart.setOption(option)
    })
}

// 处理窗口 resize
const handleResize = () => {
  if (chart) {
    chart.resize()
  }
}

// 监听数据变化
watch(
  () => props.data,
  () => {
    if (chart) {
      chart.setOption({
        series: [
          {
            data: props.data,
          },
        ],
      })
    }
  },
  { deep: true },
)

onMounted(() => {
  initChart()
  window.addEventListener('resize', handleResize)
})

onUnmounted(() => {
  if (chart) {
    chart.dispose()
  }
  window.removeEventListener('resize', handleResize)
})
</script>

<style lang="scss" scoped>
.heatmap-component {
  width: 100%;
  height: 100%;
  display: flex;
  flex-direction: column;
}

.heatmap-container {
  flex: 1;
  width: 100%;
  height: 100%;
  border: 1px solid rgba(0, 255, 255, 0.2);
  border-radius: 8px;
  box-shadow: 0 0 10px rgba(0, 255, 255, 0.2);
  background: rgba(10, 10, 40, 0.5);
}
</style>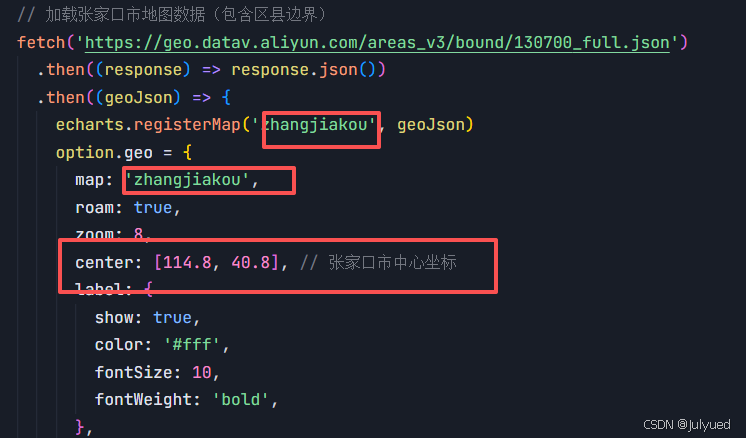
目前是张家口区域,想实现别的区域,将红框中的修改即可。(如china)
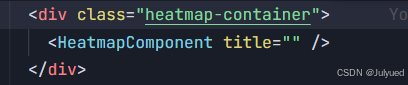
3.页面中引入