这两个配置是 极坐标系 / 饼图类图表(雷达图、极坐标柱状图、环形图、南丁格尔玫瑰图) 的核心配置,专门用来控制极坐标的「半径方向」和「角度方向」。
- radiusAxis(半径轴) :从圆心向外辐射的轴(上下 / 内外方向)
- angleAxis(角度轴) :绕圆心旋转的轴(一圈 360° 方向)
- 极坐标系 = 半径轴 + 角度轴
话不多说,上代码
javascript
option = {
backgroundColor: '#1E1F2B',
polar: {
show: true,
center: ['50%', '50%']
},
tooltip: {
},
angleAxis: {
type: 'value',
splitNumber: 12,
min: -180,
max: 180,
splitLine: {
show: true,
lineStyle: {
color: '#96D4FF',
type: 'dashed'
}
},
axisLine: {
show: true,
lineStyle: {
color: '#96D4FF'
}
},
axisTick: { show: true },
minorTick: { show: true },
axisLabel: {
show: true,
textStyle: {
color: '#96D4FF'
}
}
},
radiusAxis: {
min: 0,
max: 90,
type: 'value',
inverse: true,
splitLine: {
show: true,
lineStyle: {
color: '#96D4FF'
}
},
axisLine: { show: false },
axisTick: { show: false },
axisLabel: { show: false }
},
series: [
{
id: '11',
type: 'scatter',
coordinateSystem: 'polar',
symbol: 'circle', // 先用简单图形测试
symbolSize: 10,
itemStyle: {
color: '#409eff',
opacity: 1 // 先固定,调试成功再恢复逻辑
},
cursor: 'pointer',
data: [[120, 10],[70, 10],[0, 150],[50, -10]], // <-- 修复格式
},
{
type: 'line',
coordinateSystem: 'polar',
smooth: true, // 曲线
symbol: 'none',
lineStyle: {
color: '#96D4FF',
width: 2
},
data: [
[45, 10],
[90, 30],
[135, 60],
[180, 40],
[225, 20]
]
}
]
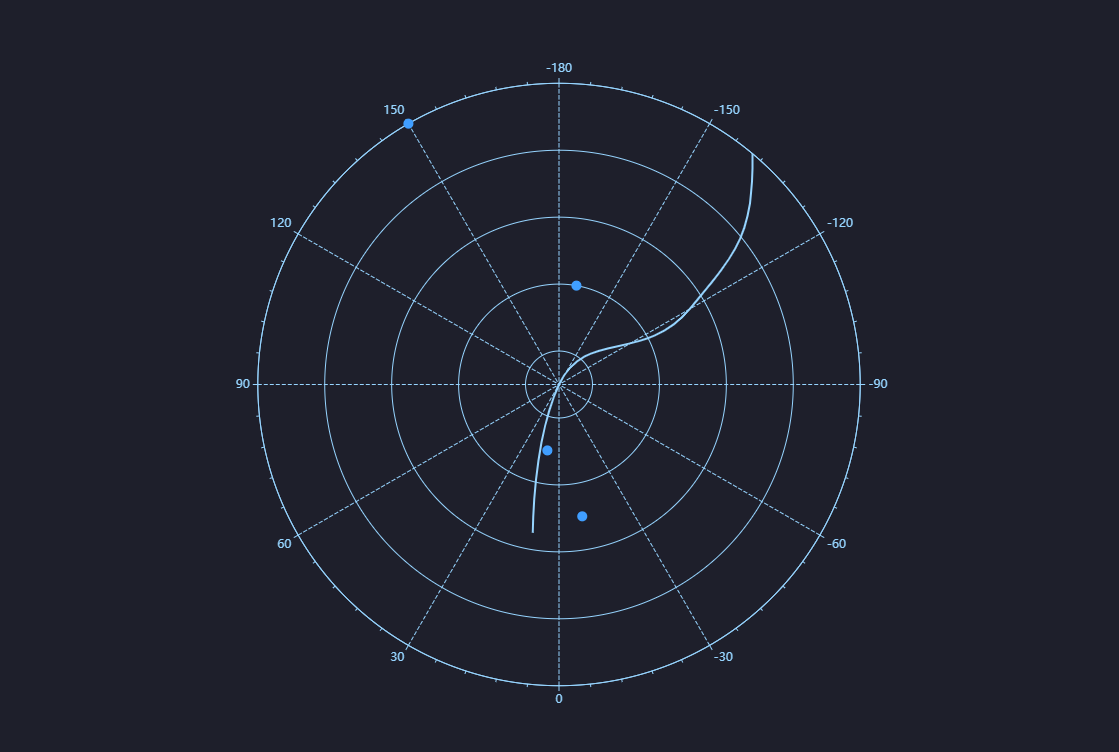
}如图: