echarts 横向渐变格子柱状图 三层

效果图

配置

javascript 复制代码
{
      
        grid: {
            left: '8%',      // 默认通常是 '5%' 或更多,改小它
            top: '20%',
            bottom: '10%',      // 如果有标题,这里需要留空间;没标题可以设为 '3%'
            containLabel: true // 【关键】设为 false,允许标签超出网格区域(需配合手动 margin)
        },
        
      xAxis: {
          type: 'value',
          min: -1,
          max:350,
          axisLine: {
              show: false ,
              lineStyle: { // 改变轴线的颜色
                  color: '#02396E',
                  width: 1,
                  type: 'solid'
              }
          },
         
          splitLine: {
              show: false, // 确保显示网格线
              lineStyle: {
                  color: '#02396E ', // 【核心】设置所有网格线的颜色
                  width: 1,         // 可选:设置线宽
                  type: 'solid'     // 可选:'solid', 'dashed', 'dotted'
              }
          },
          axisLabel: {
              color: '#FFFFFF',
              formatter: function (value) {
           
              return ''; // 其他刻度不显示文字
              }
          }
      },
      yAxis: {
          type: 'category',
          
          axisLine: {
              lineStyle: { // 改变轴线的颜色
                  color: '#FFFFFF',
                  width: 1,
                  type: 'solid'
              }
          },
          
          axisLabel: {
               
              color: '#FFFFFF',
             
          },
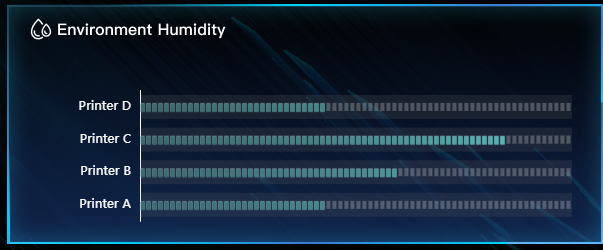
          data: ['Printer A', 'Printer B', 'Printer C',  'Printer D'],
      },
     
      series: [
          
          {
            data: [150, 212,300,150],
            type: 'custom',
            renderItem: function (params, api) {
                // api.value(0) 数值
                // api.value(1) 类别
                
                // 当前数值的坐标
                const valueCoord = api.coord([api.value(0), api.value(1)]);
                // 数值为0时的坐标
                const initialCoord = api.coord([0, api.value(1)]);
                // 柱状图的长度 = 当前数值的x坐标 - 数值为0时的x坐标
                const barLength = valueCoord[0] - initialCoord[0];
                const gap = 2; // 格子间的间距
                const height = 8; // 格子的高度
                const width = 4; // 格子的宽度
                // 格子的长度 = 格子的宽度 + 一个间距
                // 格子的数量 ≈ 柱状图的长度 / 单个格子的长度
                const barNum = Math.round(barLength / (width + gap));

                const itemStyle = api.style();
                //轨道层
                const textLength = 60;
                const maxBarLength = api.getWidth() - initialCoord[0] - textLength;
                const track = {
                    type: 'rect',
                    shape: {
                        x: initialCoord[0],
                        y: valueCoord[1] - (height + 16) / 2, // 垂直居中
                        width: maxBarLength,
                        height: height + 16 // 比条纹高 4px,确保露出边缘
                    },
                    style: {
                        fill: 'rgba(100, 100, 100, 0.2)', // 调深一点颜色和透明度,确保可见
                       
                    }
                };
                const rects = Array.from({ length: barNum }, (_, index) => {
                // 第 index 个格子的x坐标 = 数值为0时的坐标 + 前面所有格子的长度和
                const rectX = initialCoord[0] + (width + gap) * index;
                
    
                // 2. 计算位置比例 (0 到 1)
                var ratio = rectX / api.getWidth();

                // 3. 使用颜色混合代替 lift
                // 当 ratio=0 时,取 darkColor;当 ratio=1 时,取 lightColor
                // 这样渐变过程完全保留色相,不会出现发白的情况
                var finalColor = getGradientColorWithOpacity('#000000', '#66E1DF', ratio);
                return {
                    type: 'rect',
                    enterFrom: {
                    // scaleX: 0,
                    // scaleY: 1,
                    style: { opacity: 0 },
                    },
                    shape: {
                    // x,y 是格子左上角的坐标
                    y: valueCoord[1] - height / 2.5,
                    x: rectX,
                    width,
                    height,
                    },
                    style: {
                        fill: finalColor,
                        shadowColor: '#66E1DF', 
                        shadowBlur: 1, // 光晕大小
                        shadowOffsetX: 0,
                        shadowOffsetY: 0,
                        stroke: 'rgba(255, 255, 255, 0.1)', 
                        lineWidth: 1,
                        // 稍微降低整体不透明度,制造朦胧感
                        opacity: 0.8,
                    },
                };
                });

                // 预留 60px,在柱状图右边显示数值
                
                const bgbarNum = Math.round(
                (api.getWidth() - initialCoord[0] - textLength) / (width + gap)
                );

                const bgRects = Array.from({ length: bgbarNum }, (_, index) => {
                return {
                    type: 'rect',
                    shape: {
                    y: valueCoord[1] - height / 2,
                    x: initialCoord[0] + (width + gap) * index,
                    width,
                    height,
                    },
                    style: {
                     fill: 'rgba(204, 204, 204,0.3)',
                    },
                };
                });
               
                return {
                    type: 'group',
                    x: 0,
                    y: 0,
                    children: [track,...bgRects, ...rects],
                    };
            },


        }
          
      ]
  }

参考https://juejin.cn/post/7366071543405985828

相关推荐
烛衔溟2 小时前
TypeScript 基础类型(上):string、number、boolean 与类型注解
javascript·typescript·前端开发·类型注解
亿元程序员2 小时前
小伙伴说我的绳子要是有纹理就完美了,我就笑了...
前端
gaolei_eit2 小时前
解锁Vue3构建新维度:Vite生产环境深度优化实战指南
前端
向上的车轮2 小时前
TypeScript 一日速通指南:TypeScript可以做全栈开发吗?
前端·javascript·typescript
心.c2 小时前
从输入 URL 到页面展示的完整过程
前端·javascript·vue.js·js
Mintopia2 小时前
组件契约文档的标准结构(可复制模板)
前端·架构
一次旅行2 小时前
飞书接入龙虾后失联解决方法
前端·人工智能·chrome·飞书
晴天162 小时前
【Electron】从零构建你的第一个桌面应用
前端·javascript·electron
斌味代码2 小时前
Vue3源码解读(一):响应式系统 reactive/ref 核心原理图解(2026最新版)
前端·javascript·vue.js