4台主机
node1主机:k8s集群中的master
node2主机:搭建了harbor仓库,存储所需的docker镜像
test3、4主机:k8s集群中的woker
搭建prometheus
https://github.com/prometheus-operator/kube-prometheus
获取prometheus压缩包的途径
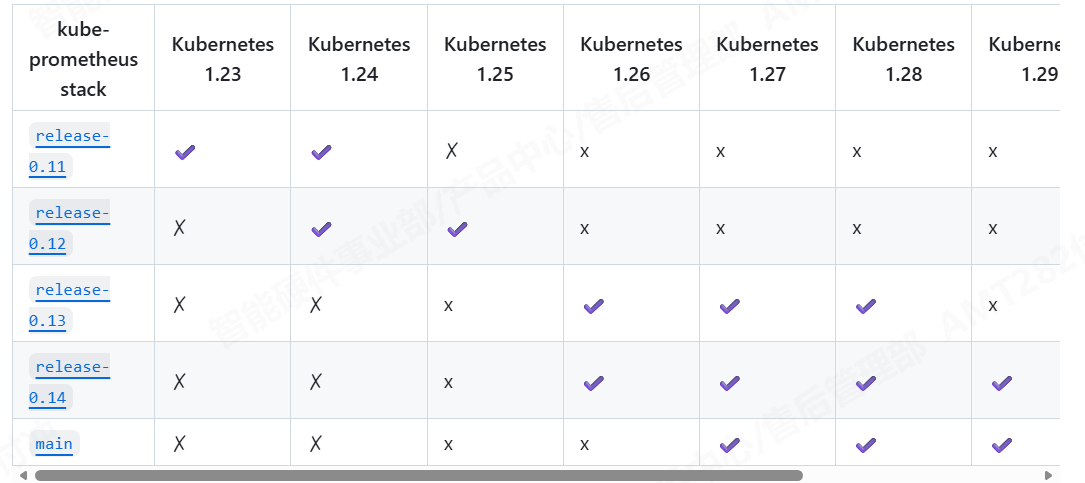
不同k8s的版本对应不同的prometheus版本,我的k8s环境版本是1.30,对应prometheus0.14的版本
bash
[root@node1 ~]# tar zxf kube-prometheus-0.14.0.tar.gz
[root@node1 ~]# mv kube-prometheus-0.14.0 kube-prometheus
[root@node1 ~]# cd kube-prometheus/manifests/
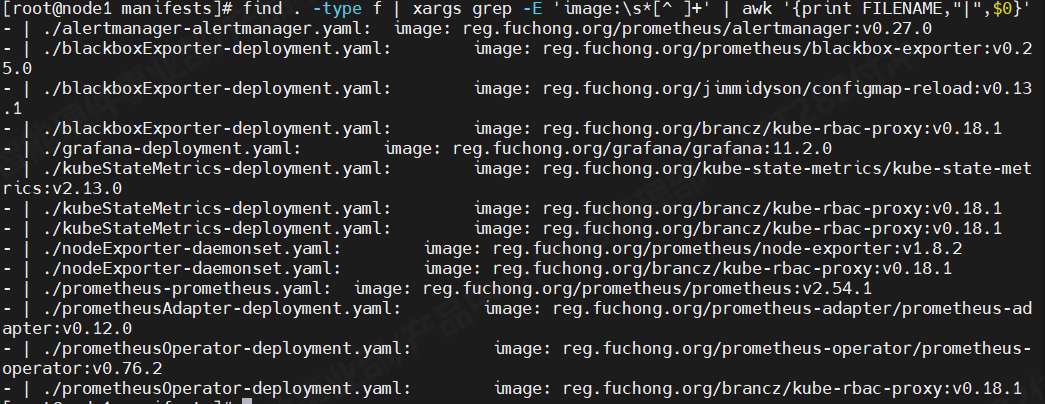
[root@node1 manifests]# kubectl create -f setup/ #创建prometheus所需要的命名空间等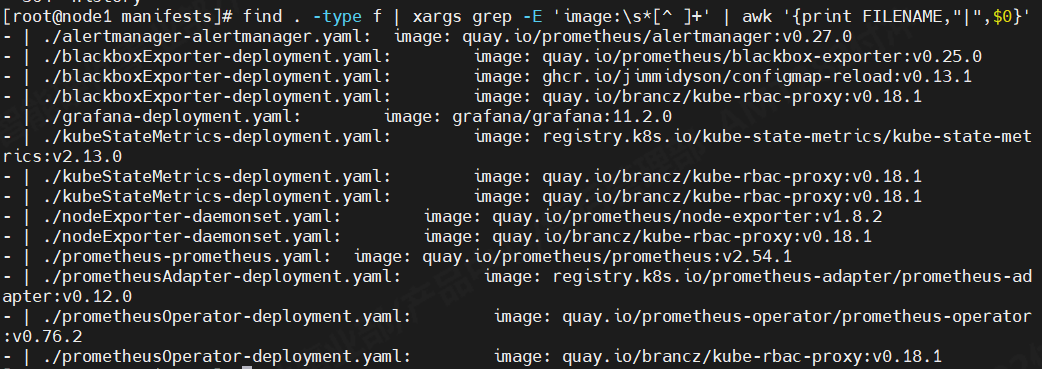 因为更接近生产环境,我把k8s集群的docker镜像源写的是我harbor仓库,所以这些镜像需要到node2主机上使用dockerpull下来,再tag、push到harbor仓库,让node1主机拉取。node1主机中这些文件的镜像地址都修改成harbor仓库的地址。
然后到prometheus-service.yaml、grafana-service.yaml、alertmanager-service.yaml进入其中将网络类型改成nodeport或则LoadBalancer,方便外网访问。我这使用的是LoadBalancer。LoadBalancer网络类型需要依赖第三方软件进行IP分布,我环境中使用的是MetlLB。
示例:prometheus-service.yaml
bash
apiVersion: v1
kind: Service
metadata:
  labels:
    app.kubernetes.io/component: prometheus
    app.kubernetes.io/instance: k8s
    app.kubernetes.io/name: prometheus
    app.kubernetes.io/part-of: kube-prometheus
    app.kubernetes.io/version: 2.54.1
  name: prometheus-k8s
  namespace: monitoring
spec:
  type: LoadBalancer
  ports:
  - name: web
    port: 9090
    targetPort: web
  - name: reloader-web
    port: 8080
    targetPort: reloader-web
  selector:
    app.kubernetes.io/component: prometheus
    app.kubernetes.io/instance: k8s
    app.kubernetes.io/name: prometheus
    app.kubernetes.io/part-of: kube-prometheus
  sessionAffinity: ClientIP
执行apply命令让其生效
bash
[root@node1 manifests]# kubectl apply -f .svc情况
bash
[root@node1 manifests]# kubectl -n monitoring get svc
NAME TYPE CLUSTER-IP EXTERNAL-IP PORT(S) AGE
alertmanager-main LoadBalancer 10.100.86.83 192.168.247.100 9093:31226/TCP,8080:30967/TCP 22h
alertmanager-operated ClusterIP None <none> 9093/TCP,9094/TCP,9094/UDP 22h
blackbox-exporter ClusterIP 10.104.69.13 <none> 9115/TCP,19115/TCP 22h
grafana LoadBalancer 10.96.27.188 192.168.247.101 3000:31805/TCP 22h
kube-state-metrics ClusterIP None <none> 8443/TCP,9443/TCP 22h
node-exporter ClusterIP None <none> 9100/TCP 22h
prometheus-adapter ClusterIP 10.99.151.111 <none> 443/TCP 22h
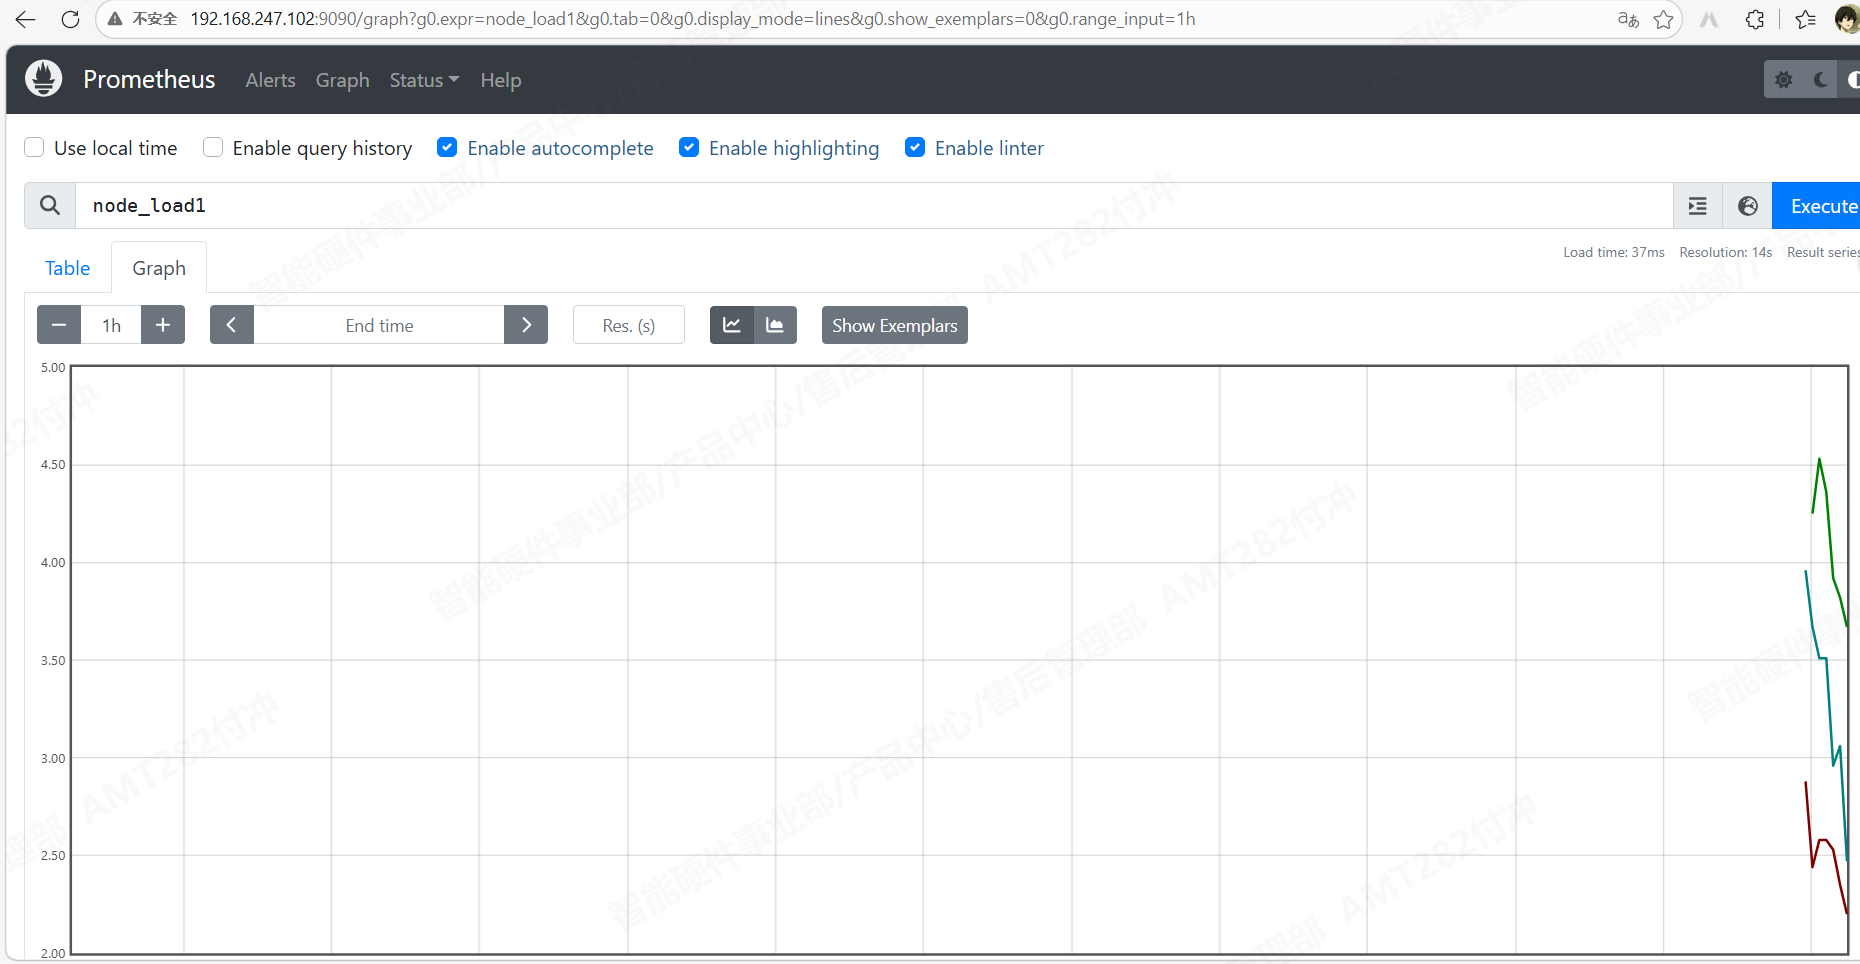
prometheus-k8s LoadBalancer 10.98.57.219 192.168.247.102 9090:32758/TCP,8080:32292/TCP 22h
prometheus-operated ClusterIP None <none> 9090/TCP 22h
prometheus-operator ClusterIP None <none> 8443/TCP 22h现在就能正常访问
grafana界面
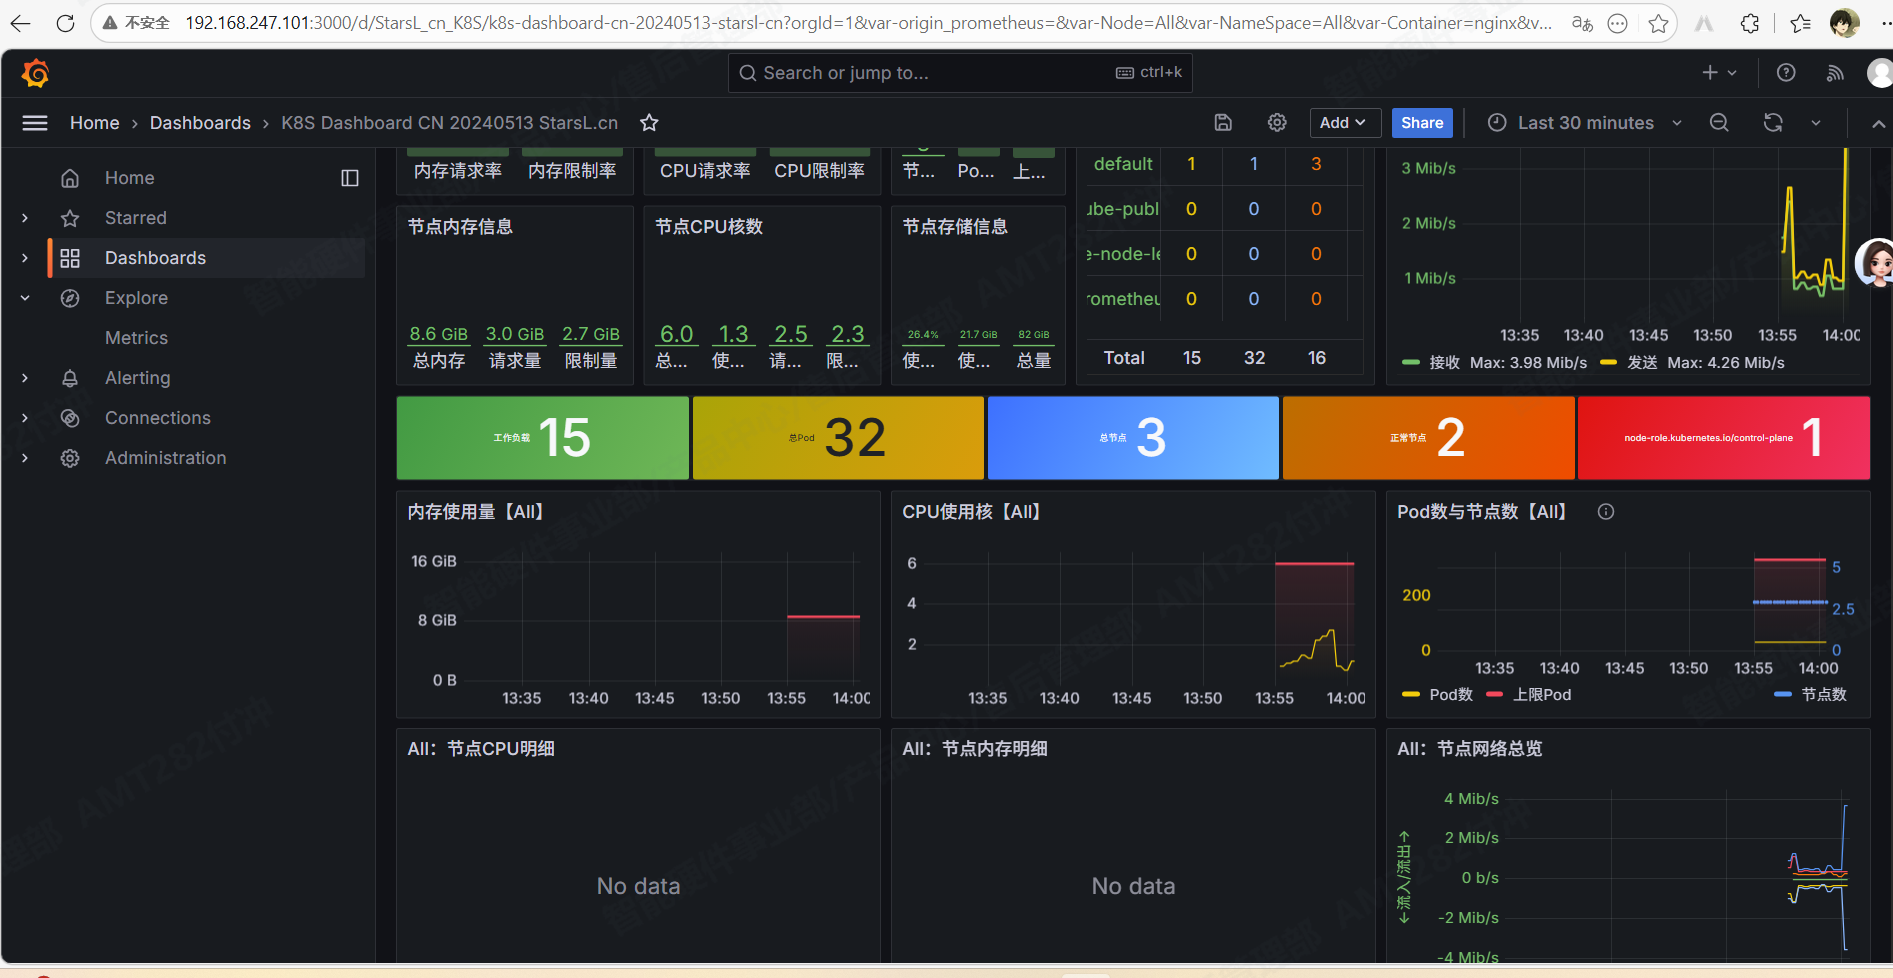 现在prometheus和grafana就搭建完成了
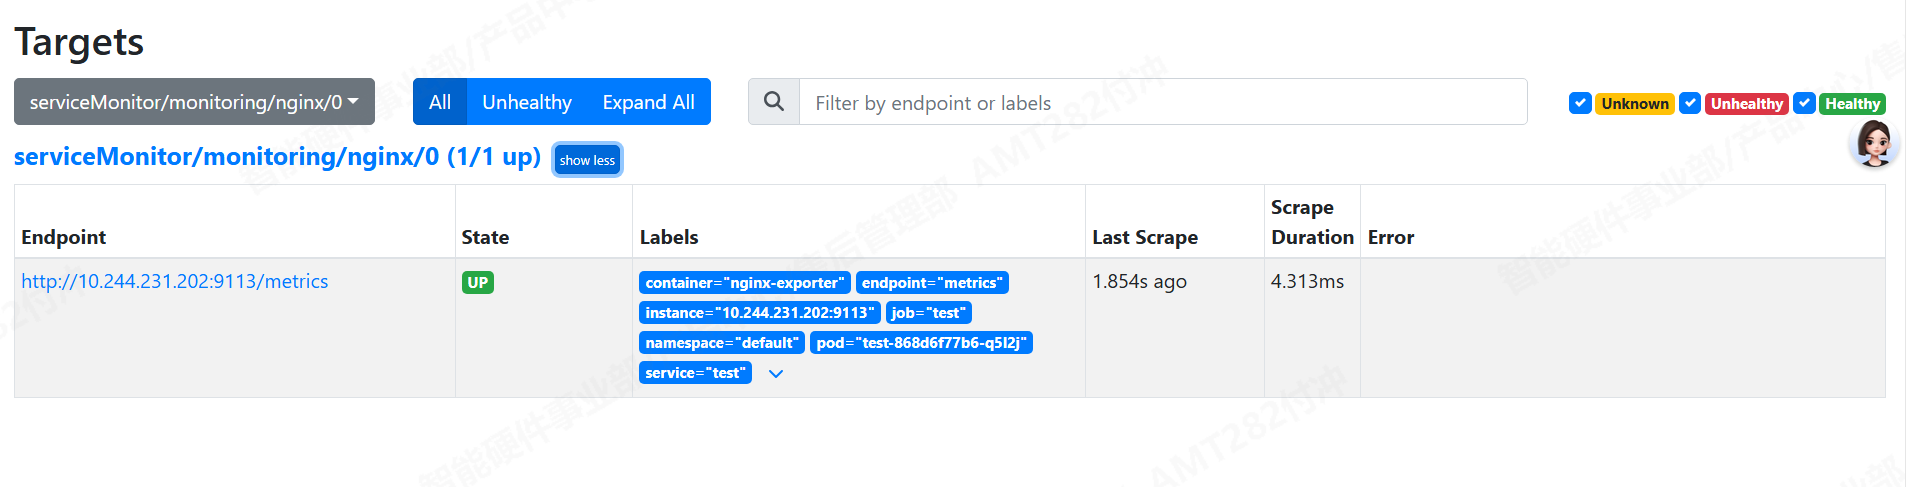
prometheus监控k8s中的nginx pod资源
每个服务都有其对应的exporter,exporter主要是将服务资源转换成metrics,使prometheus能够读懂并显现出来。
创建nginx的pod yaml文件,使用deployment控制器创建nginx pod
bash
apiVersion: apps/v1
kind: Deployment
metadata:
  labels:
    app: test
  name: test
spec:
  replicas: 1
  selector:
    matchLabels:
      app: test
  template:
    metadata:
      labels:
        app: test
    spec:
      containers:
      - image: test/nginx:v1
        name: nginx
        volumeMounts:
        - name: nginx-config
          mountPath: /etc/nginx/conf.d/default.conf
          subPath: default.conf
      - image: nginx/nginx-prometheus-exporter:1.4.2
        name: nginx-exporter
        args:
        - -nginx.scrape-uri=http://127.0.0.1:80/nginx_status
        ports:
        - containerPort: 9113
          name: metrics
      volumes:
      - name: nginx-config
        configMap:
          name: nginx-config

---
apiVersion: v1
kind: ConfigMap
metadata:
  name: nginx-config
data:
  default.conf: |
    server {
        listen 80;
        server_name localhost;

        location / {
            root /usr/share/nginx/html;
            index index.html;
        }

        # Nginx 监控状态页
        location /nginx_status {
            stub_status;
            allow all;    # 生产可限制IP,测试先放开
        }
    }

---
apiVersion: v1
kind: Service
metadata:
  labels:
    app: test
  name: test
spec:
  ports:
  - port: 80
    targetPort: 80
    name: http
  - port: 9113
    targetPort: 9113
    name: metrics
  selector:
    app: test
  type: LoadBalancer
然后再创建nginx-serviceMonitor.yaml配置,让prometheus自动发现pod,并进行监控
bash
apiVersion: monitoring.coreos.com/v1
kind: ServiceMonitor
metadata:
  name: nginx
  namespace: monitoring
  labels:
    release: prometheus    # 必须和你 Prometheus 的 release 标签一致
spec:
  selector:
    matchLabels:
      app: test
  namespaceSelector:
    matchNames:
    - default
  endpoints:
  - port: metrics
    path: /metrics
    interval: 15s
    scheme: http
apply一下,就能正常监测