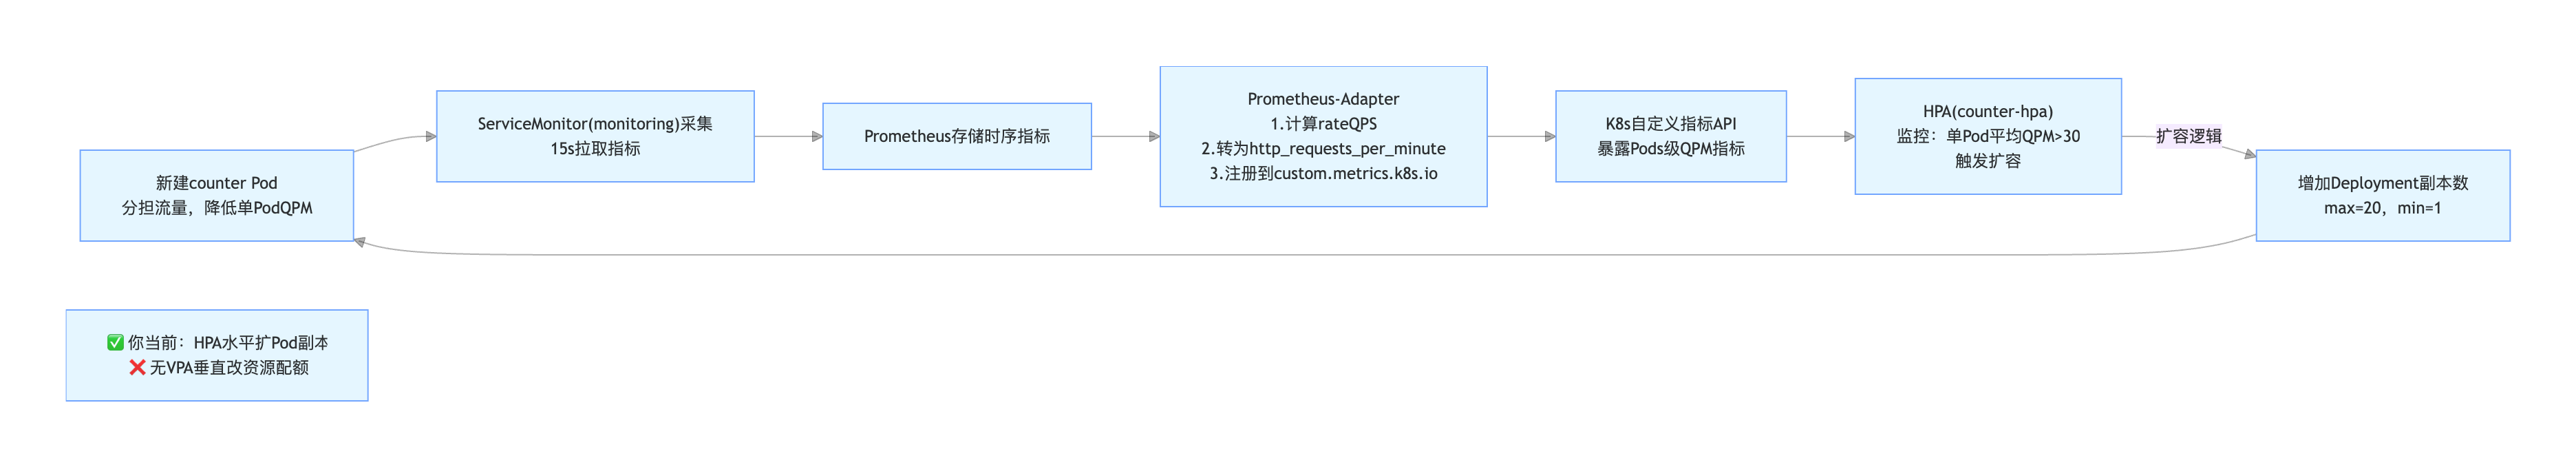
纯 HPA 玩法,水平 Pod 扩容(加副本数,1→5→20 个 Pod),你现在这套:ServiceMonitor采集指标 → adapter转自定义指标 → HPA按QPM扩副本,标准 HPA (Pod 横向扩缩容)
js
1 业务 Pod(counter)
自己埋点暴露 /metrics,产出原生计数器:http_requests_total

2 ServiceMonitor
告诉 Prometheus:去抓 default/app=counter 的 /metrics,15s 抓一次

3 Prometheus
存下所有请求时序数据

4 prometheus-adapter(关键中转)
用 PromQL:
 sum(rate(http_requests_total[2m])) *60
算出 每分钟请求数,注册成 K8s 可识别的自定义 Pod 指标:6 http_requests_per_minute

5 HPA 决策
不停拉自定义指标:
单 Pod 平均 >30 QPM → 按策略扩容(最多 + 5 个 / 分钟,最大 20 副本)
流量低 → 缩容冷静期 5 分钟再减副本

7 闭环:新增 Pod 分担流量 → 单 PodQPM 下降 → HPA 停止扩容
集群版本
满足条件 1
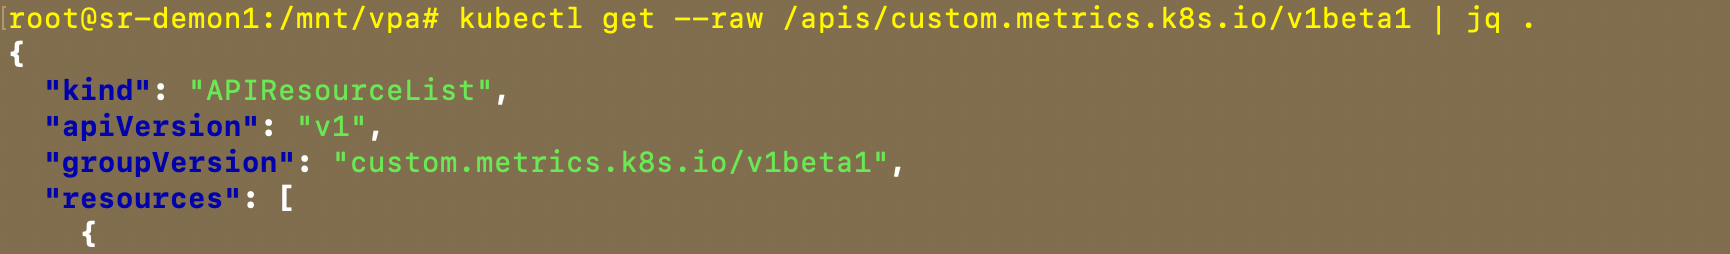
如果没有可以创建
yaml
apiVersion: apiregistration.k8s.io/v1
kind: APIService
metadata:
  name: v1beta1.custom.metrics.k8s.io
spec:
  service:
    name: prometheus-adapter
    namespace: monitoring
  group: custom.metrics.k8s.io
  version: v1beta1
  insecureSkipTLSVerify: true
  groupPriorityMinimum: 100
  versionPriority: 100

创建
# kubectl apply -f xx.yaml
添加一个自定义指标
yaml
    # 自定义业务指标规则(新增)
    rules:
      - seriesQuery: 'http_requests_total{namespace!="",pod!=""}'
        resources:
          overrides:
            namespace: {resource: "namespace"}
            pod: {resource: "pod"}
        name:
          matches: "^(.*)_total$"
          as: "${1}_per_minute"
        metricsQuery: |
          sum(rate(<<.Series>>{<<.LabelMatchers>>}[1m])) by (<<.GroupBy>>) * 60
直接用我做好的镜像
yaml
apiVersion: apps/v1
kind: Deployment
metadata:
  name: counter
  namespace: default
spec:
  replicas: 1
  selector:
    matchLabels:
      app: counter
  template:
    metadata:
      labels:
        app: counter
    spec:
      containers:
      - name: app
        image: jpccr.ccs.tencentyun.com/test02/hpa-test:v01
        imagePullPolicy: IfNotPresent
        ports:
        - containerPort: 8080
        resources:
          requests:
            cpu: 100m
            memory: 128Mi
          limits:
            cpu: 300m
            memory: 256Mi

---
apiVersion: v1
kind: Service
metadata:
  name: counter
  namespace: default
  labels:
    app: counter
spec:
  selector:
    app: counter
  ports:
  - port: 8080
    targetPort: 8080
    name: http
pods 创建好之后再创建 hpa
yaml
apiVersion: monitoring.coreos.com/v1
kind: ServiceMonitor
metadata:
  name: request-counter
  namespace: monitoring
  labels:
    release: kube-prometheus
spec:
  namespaceSelector:
    matchNames:
    - default
  selector:
    matchLabels:
      app: counter
  endpoints:
  - port: http
    path: /metrics
    interval: 15s
    scheme: http
---
apiVersion: autoscaling/v2
kind: HorizontalPodAutoscaler
metadata:
  name: counter-hpa
  namespace: default
spec:
  scaleTargetRef:
    apiVersion: apps/v1
    kind: Deployment
    name: counter
  minReplicas: 1
  maxReplicas: 20
  metrics:
  - type: Pods
    pods:
      metric:
        name: http_requests_per_minute ----对应 自定义指标
      target:
        type: AverageValue
        averageValue: "30"
  behavior:
    scaleUp:
      stabilizationWindowSeconds: 60
      policies:
      - type: Pods
        value: 5
        periodSeconds: 60
      selectPolicy: Max
    scaleDown:
      stabilizationWindowSeconds: 300
查看你的指标
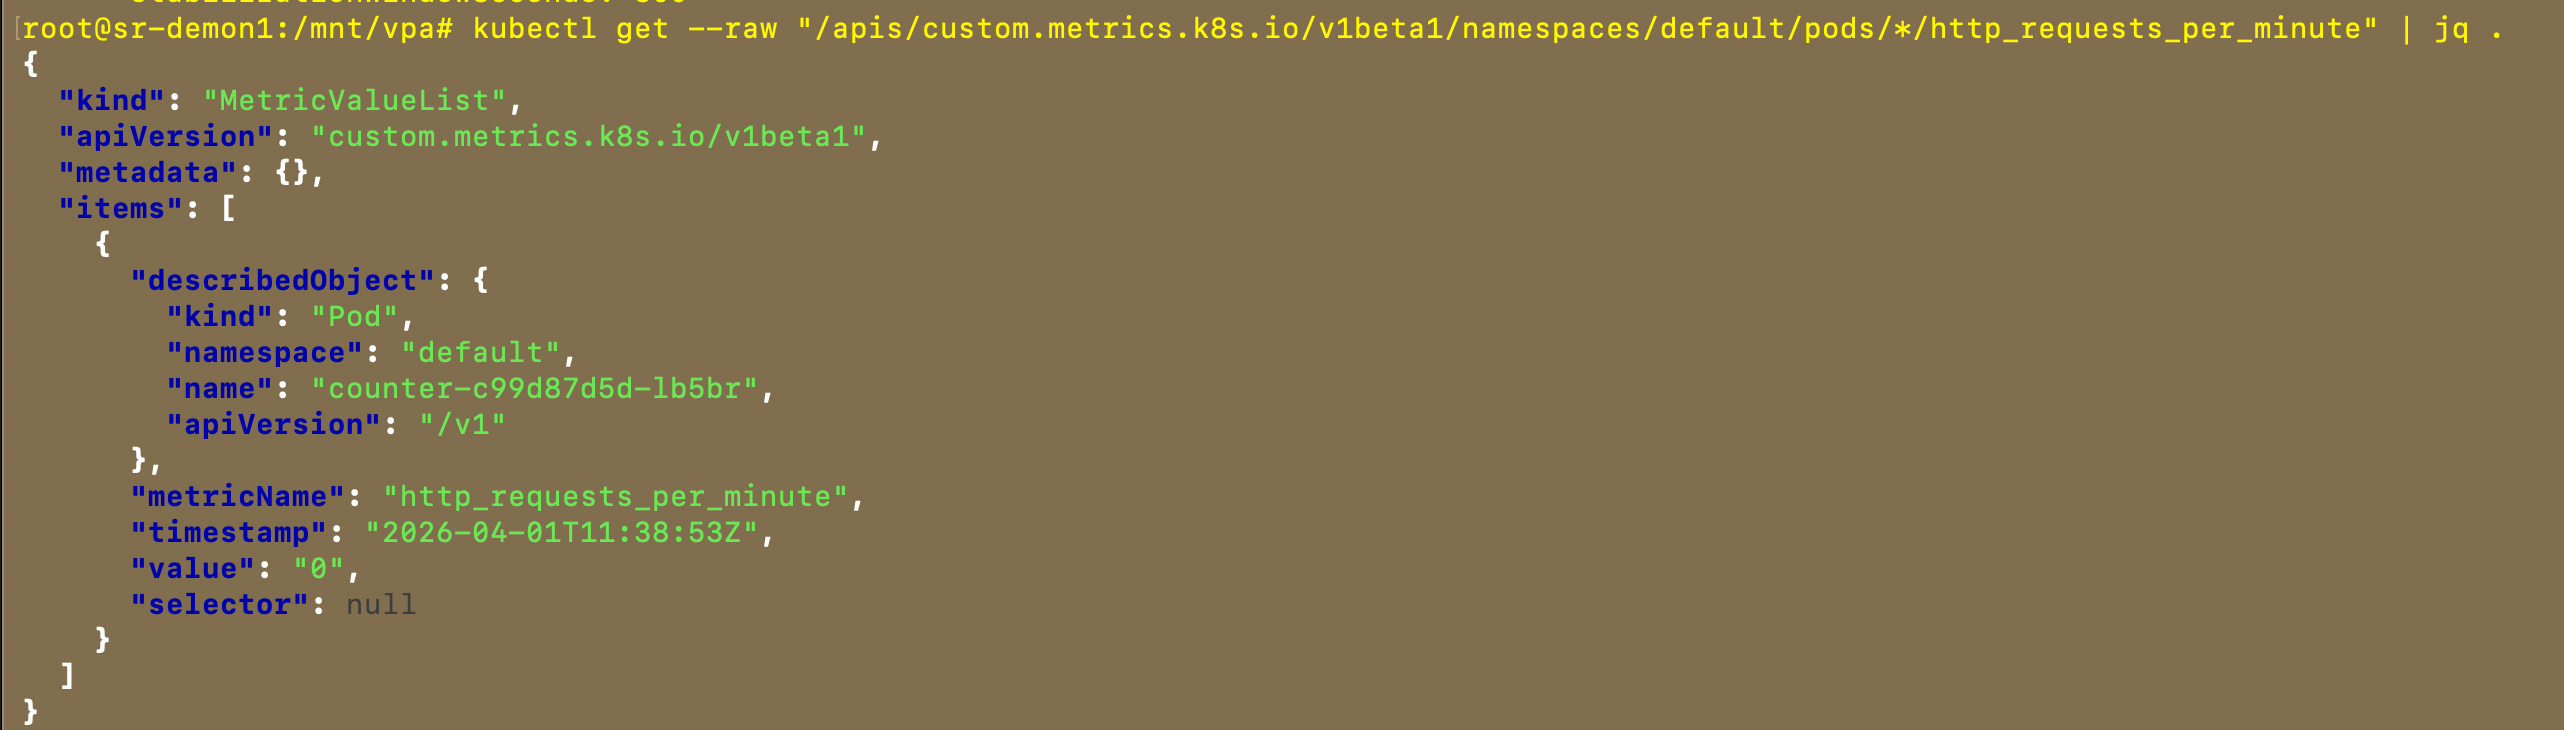
创建后如下:
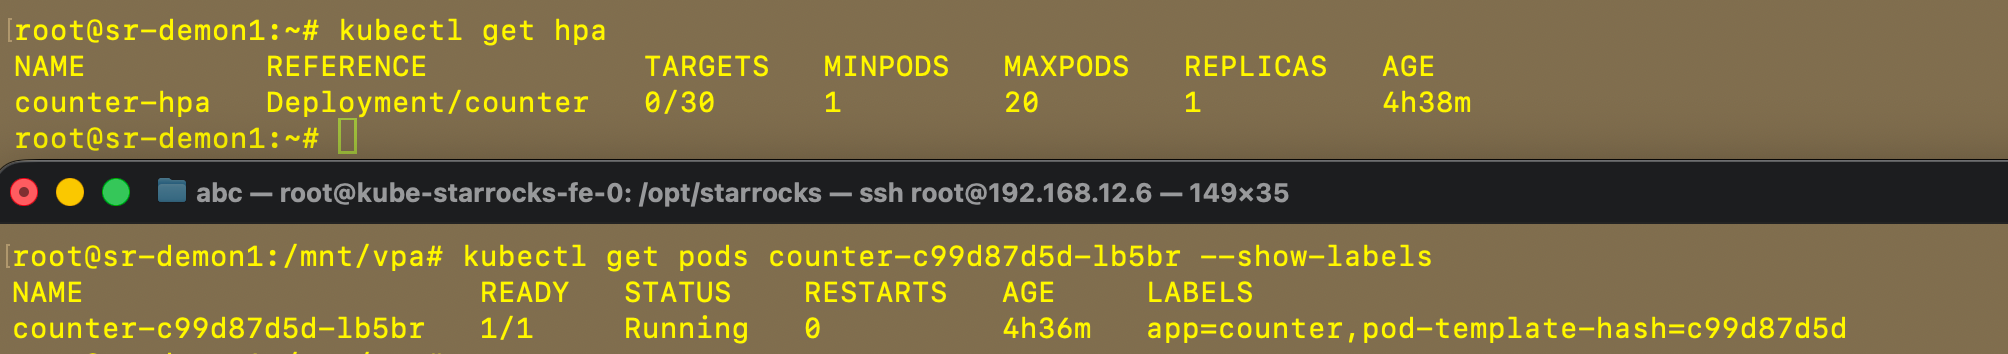
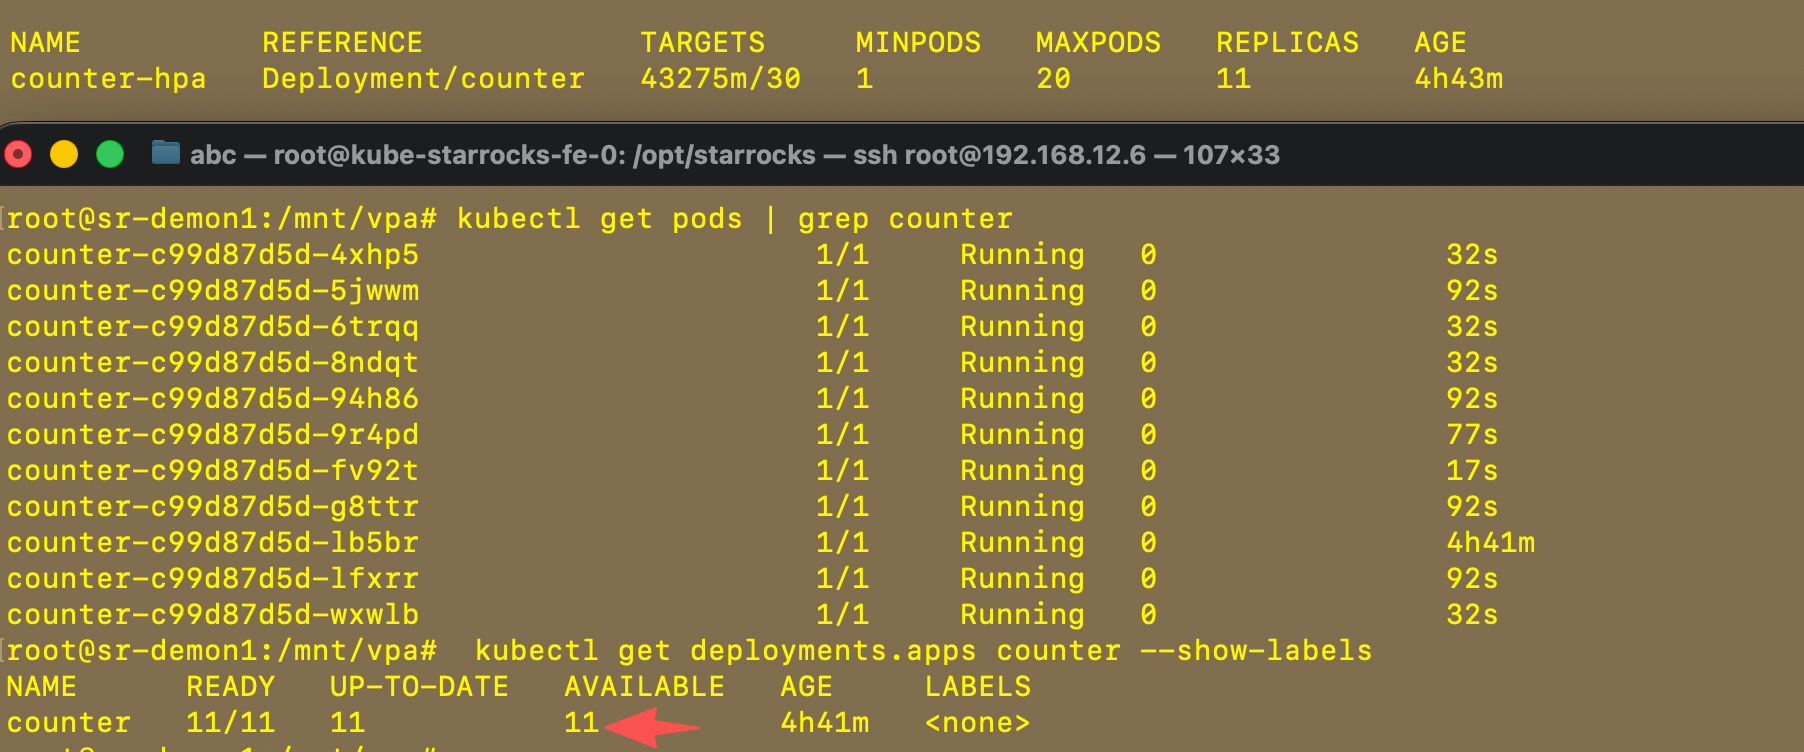
开始测试发送请求
while true; do curl -s http://10.96.202.116:8080/ > /dev/null; sleep 0.05; done成功扩容了,又时间问题没有等到20个pods才退出
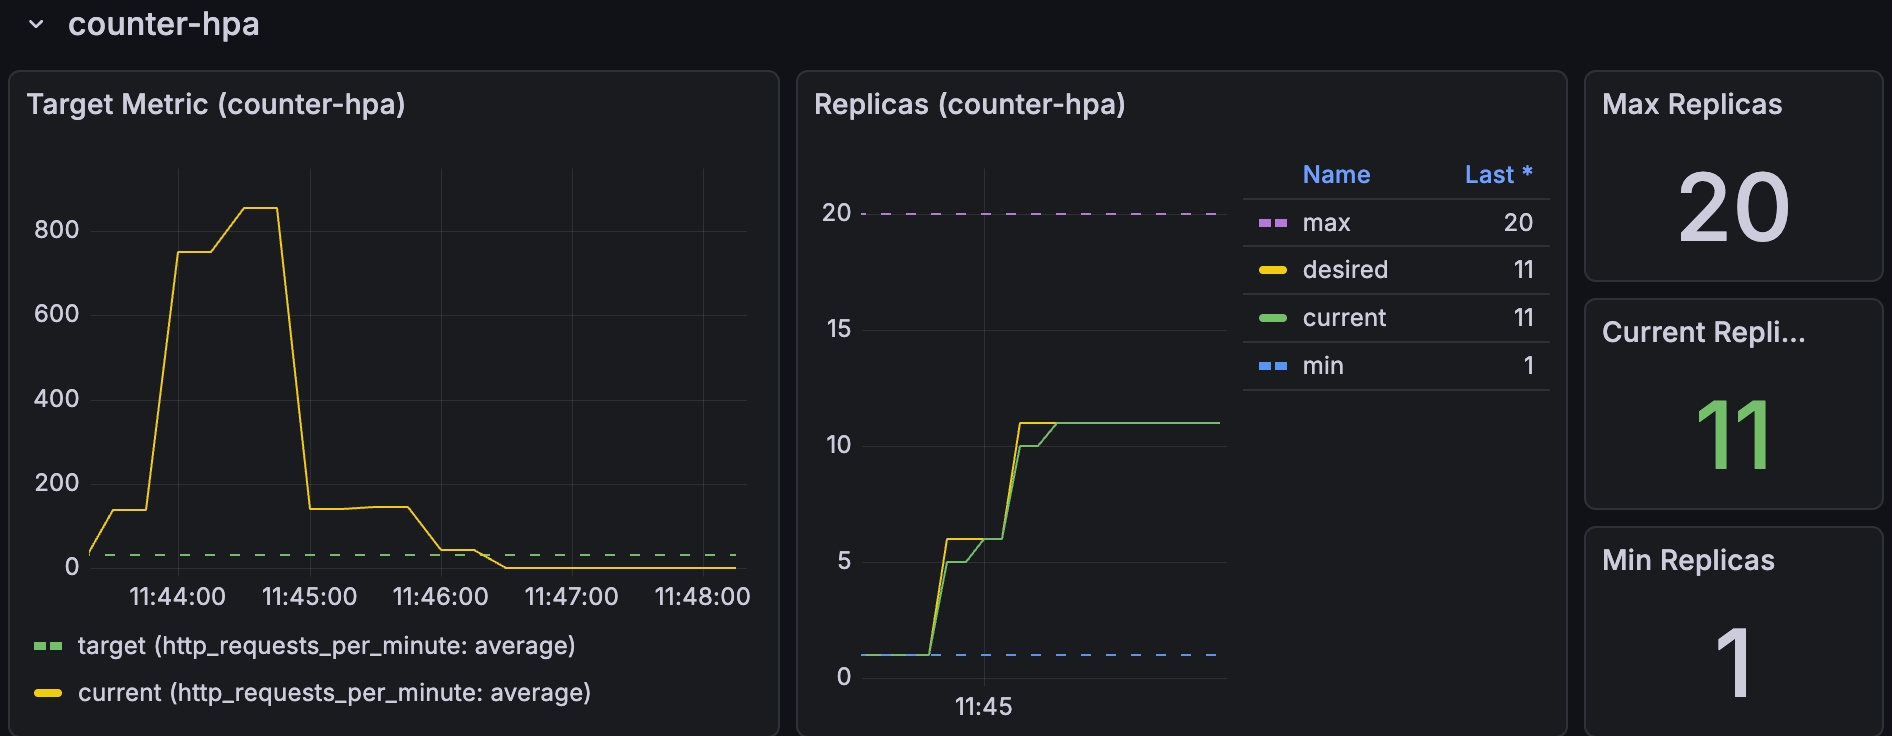
grafana 视图展示
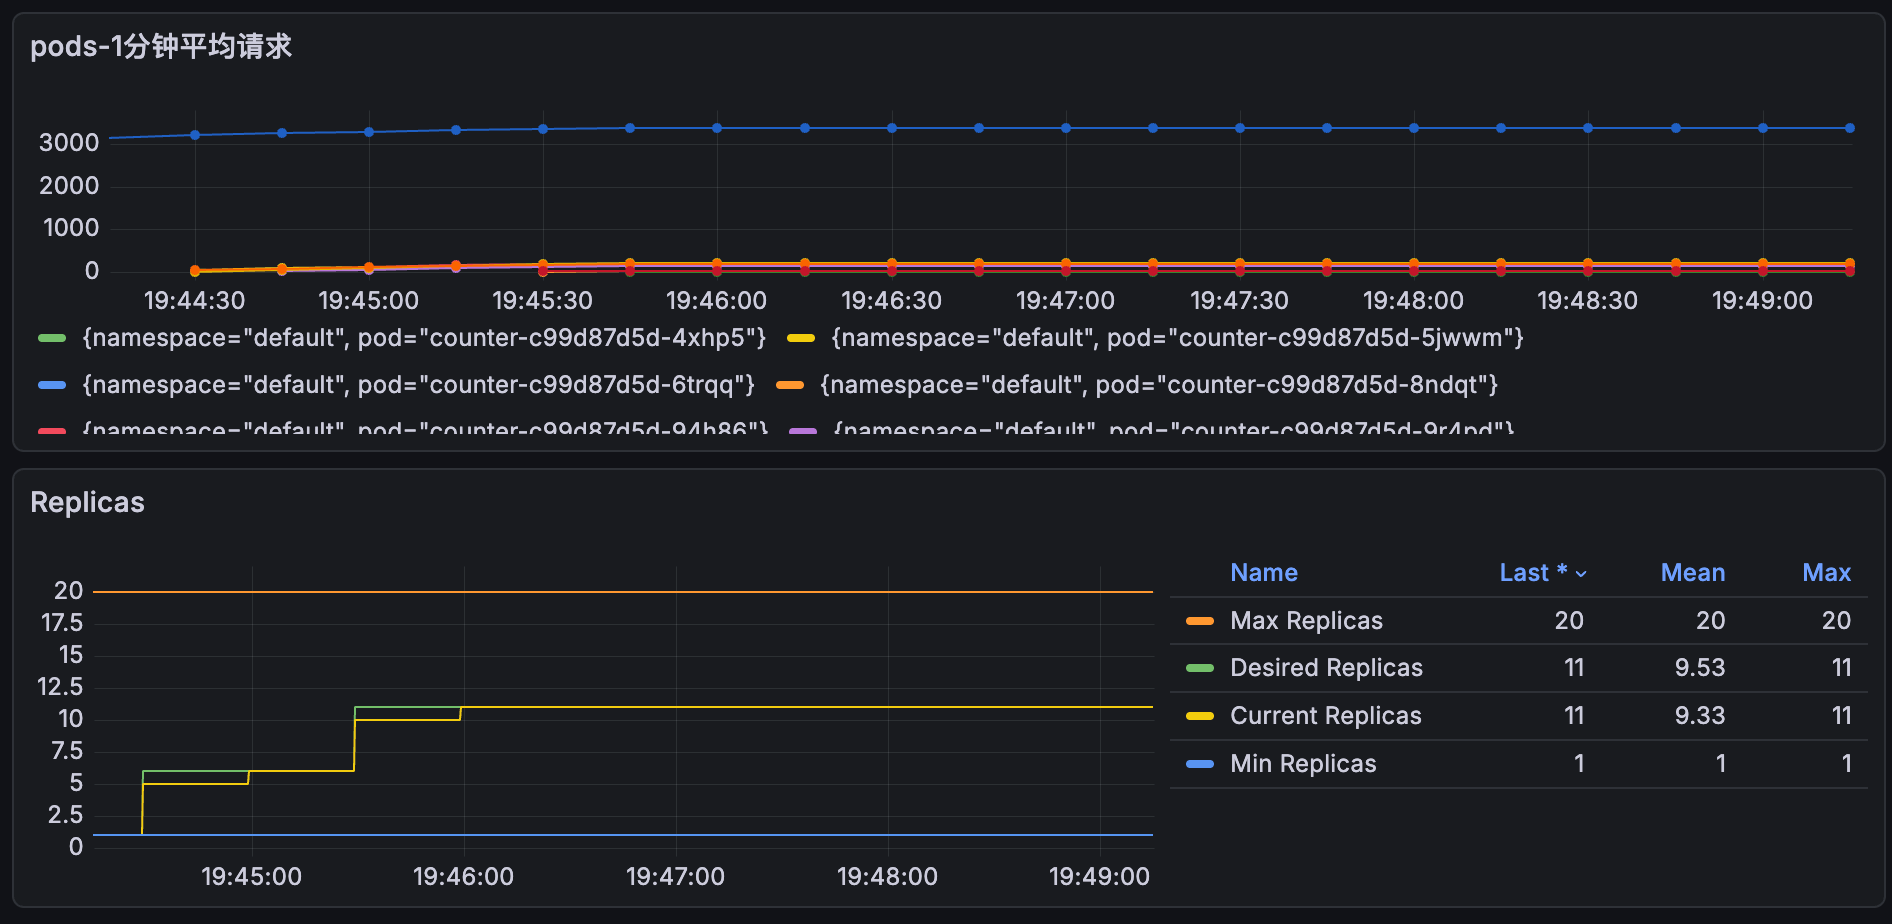
小技巧添加一个自定义视图 收集每个pods的请求数量
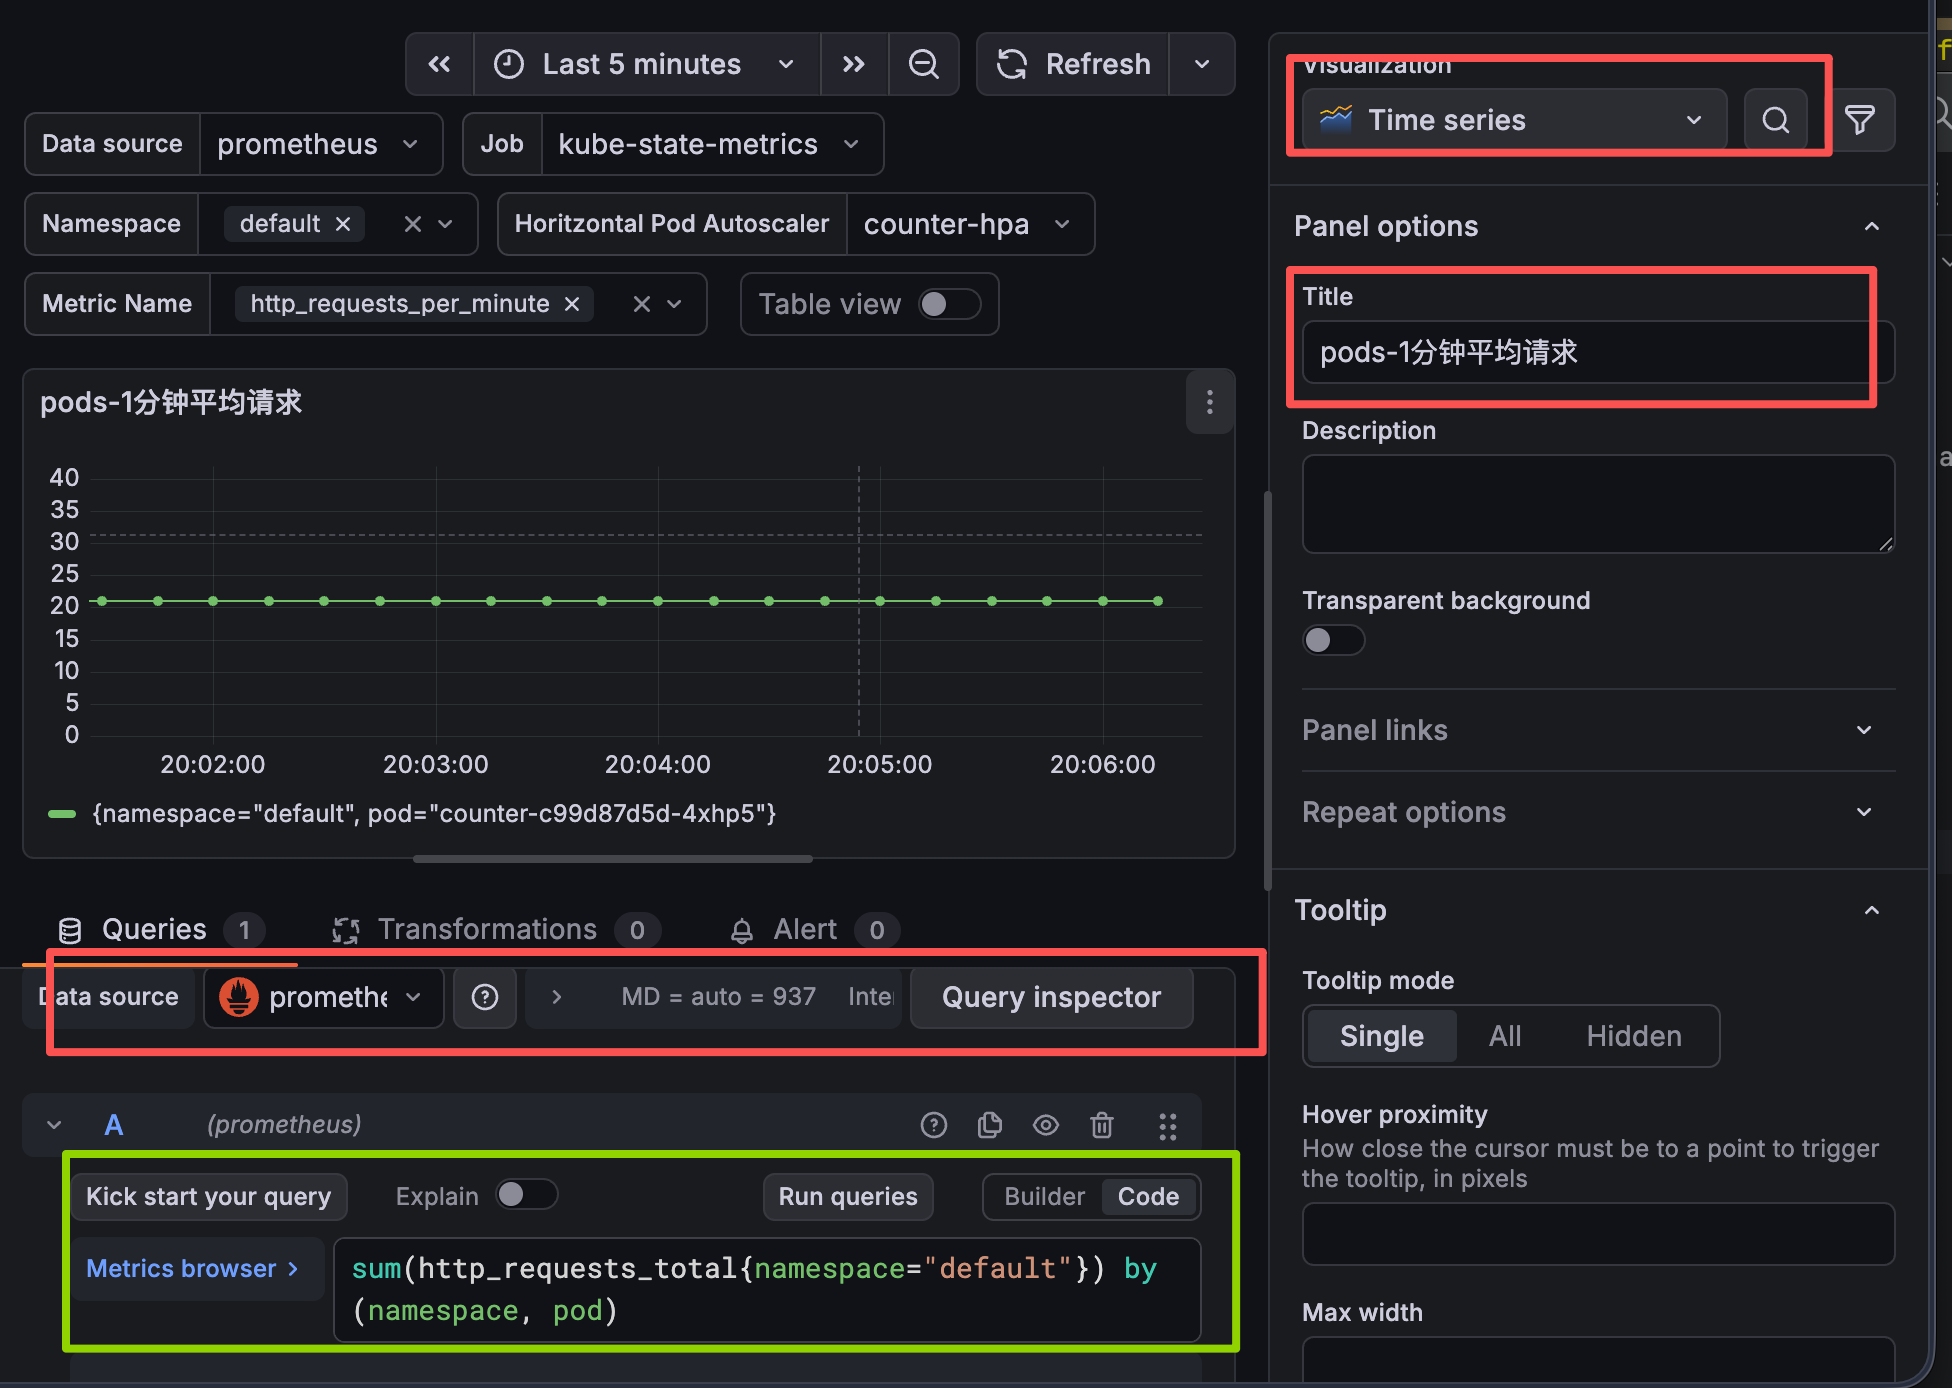
shell
sum(http_requests_total{namespace="default"}) by (namespace, pod)grafana 视图ID推荐
22128
22251