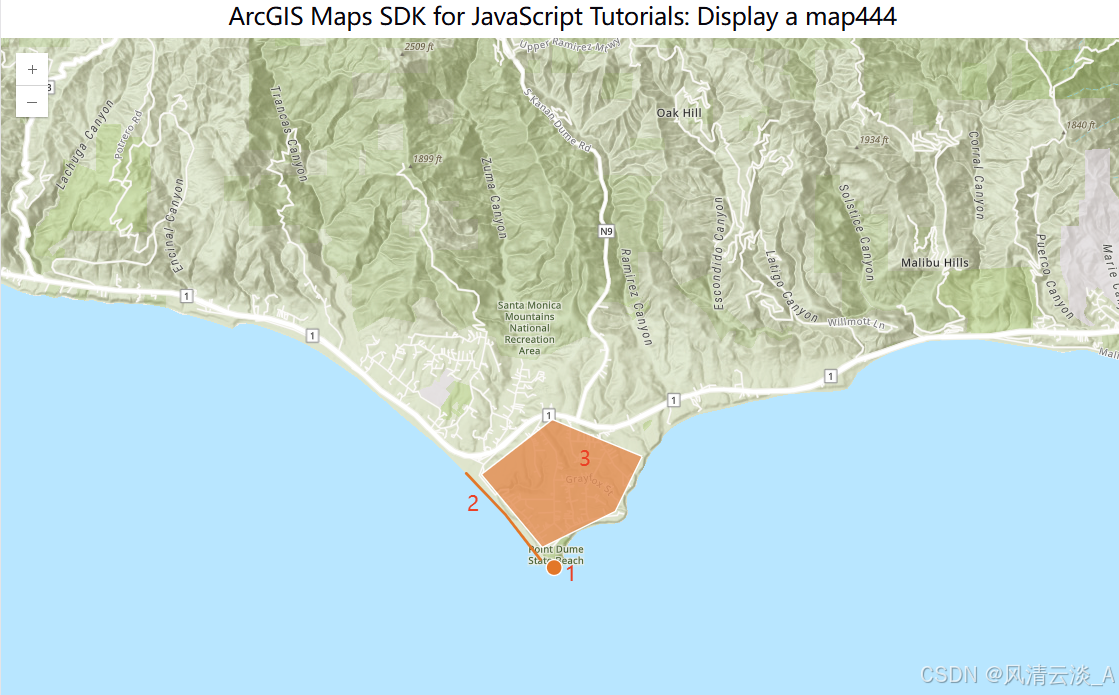
在地上画形状,这是我们业务开发中常见的需求,把某个地方打marker等等
实现效果
在地图上画一个圆形
js
// 画一个圆形
    function drawCircle() {
        const point = {
            //Create a point
            type: "point",
            longitude: -118.80657463861,
            latitude: 34.0005930608889,
        };
        const simpleMarkerSymbol = {
        type: "simple-marker",
        color: [226, 119, 40], // Orange
        outline: {
            color: [255, 255, 255], // White
            width: 1,
        },
        };

        const pointGraphic = new Graphic({ geometry: point, symbol: simpleMarkerSymbol });
        graphicsLayer.add(pointGraphic);
}在initMap方法中调用这个生成圆形的方法
js
...
// 画一个圆形
drawCircle();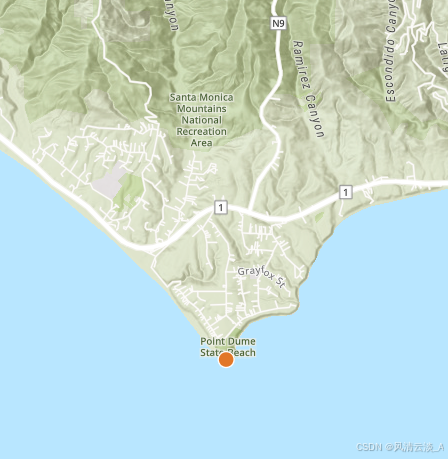
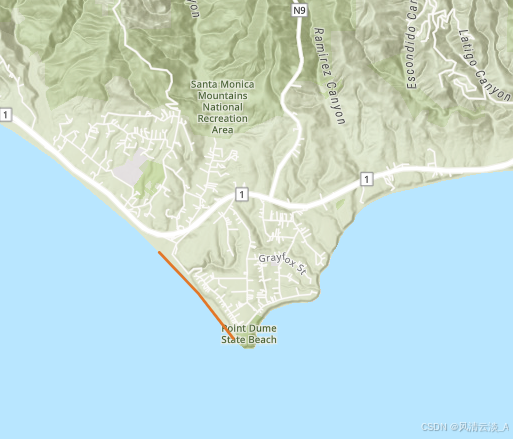
画一条直线
js
function drawLine() {
        // Create a line geometry
        const polyline = {
            type: "polyline",
            paths: [
                [-118.821527826096, 34.0139576938577], //Longitude, latitude
                [-118.814893761649, 34.0080602407843], //Longitude, latitude
                [-118.808878330345, 34.0016642996246], //Longitude, latitude
            ],
        };
        const simpleLineSymbol = {
            type: "simple-line",
            color: [226, 119, 40], // Orange
            width: 2,
        };

        const polylineGraphic = new Graphic({ geometry: polyline, symbol: simpleLineSymbol });
        graphicsLayer.add(polylineGraphic);
    }
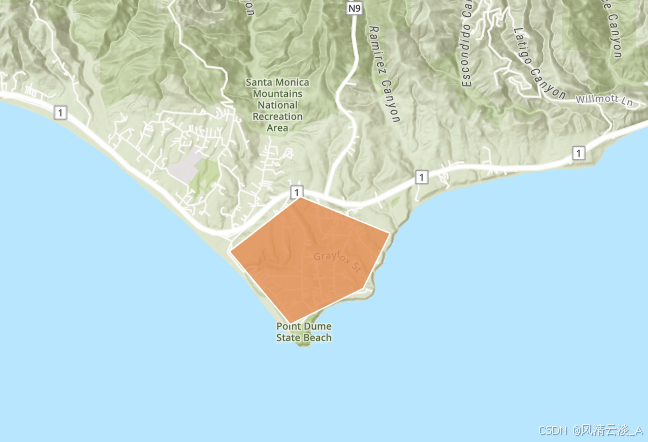
画一个多边形
js
// 画一个多边形
    function drawPolygon() {
        const polygon = {
            type: "polygon",
            rings: [
                [-118.818984489994, 34.0137559967283], //Longitude, latitude
                [-118.806796597377, 34.0215816298725], //Longitude, latitude
                [-118.791432890735, 34.0163883241613], //Longitude, latitude
                [-118.79596686535, 34.008564864635], //Longitude, latitude
                [-118.808558110679, 34.0035027131376], //Longitude, latitude
            ],
        };

        const simpleFillSymbol = {
            type: "simple-fill",
            color: [227, 139, 79, 0.8], // Orange, opacity 80%
            outline: { color: [255, 255, 255], width: 1 },
        };

        const polygonGraphic = new Graphic({
            geometry: polygon,
            symbol: simpleFillSymbol,

        });
        graphicsLayer.add(polygonGraphic);
    }
完整的代码实现
html
<script setup>
    import Map from "@arcgis/core/Map";
    import MapView from '@arcgis/core/views/MapView'
    import { onMounted, ref } from "vue";
    import GraphicsLayer from "@arcgis/core/layers/GraphicsLayer";
    import Graphic from "@arcgis/core/Graphic";
    const graphicsLayer = new GraphicsLayer();

    const mapDiv = ref(null)
    let view;
    const initMap = () => {
        const map = new Map({
            basemap: "arcgis/topographic",
            layers: [graphicsLayer], // 将图形图层添加到地图中
        });

        view = new MapView({
            center: [-118.805, 34.020],
            zoom: 13,
            container: mapDiv.value,
            map: map
        });


        view.on('click', (event) => {
            console.log('点击事件:', event);
        });
        // 画一个圆形
        // drawCircle();

        // // 画一条直线
        // drawLine();

        // // 画一个多边形
        drawPolygon();

        view.when(
            () => {
            console.log('地图加载成功')
            },
            (error) => {
            console.error('地图加载失败:', error)
            }
        )
    }

    // 画一个圆形
    function drawCircle() {
        const point = {
            //Create a point
            type: "point",
            longitude: -118.80657463861,
            latitude: 34.0005930608889,
        };
        const simpleMarkerSymbol = {
        type: "simple-marker",
        color: [226, 119, 40], // Orange
        outline: {
            color: [255, 255, 255], // White
            width: 1,
        },
        };

        const pointGraphic = new Graphic({ geometry: point, symbol: simpleMarkerSymbol });
        graphicsLayer.add(pointGraphic);
    }

    function drawLine() {
        // Create a line geometry
        const polyline = {
            type: "polyline",
            paths: [
                [-118.821527826096, 34.0139576938577], //Longitude, latitude
                [-118.814893761649, 34.0080602407843], //Longitude, latitude
                [-118.808878330345, 34.0016642996246], //Longitude, latitude
            ],
        };
        const simpleLineSymbol = {
            type: "simple-line",
            color: [226, 119, 40], // Orange
            width: 2,
        };

        const polylineGraphic = new Graphic({ geometry: polyline, symbol: simpleLineSymbol });
        graphicsLayer.add(polylineGraphic);
    }

    // 画一个多边形
    function drawPolygon() {
        const polygon = {
            type: "polygon",
            rings: [
                [-118.818984489994, 34.0137559967283], //Longitude, latitude
                [-118.806796597377, 34.0215816298725], //Longitude, latitude
                [-118.791432890735, 34.0163883241613], //Longitude, latitude
                [-118.79596686535, 34.008564864635], //Longitude, latitude
                [-118.808558110679, 34.0035027131376], //Longitude, latitude
            ],
        };

        const simpleFillSymbol = {
            type: "simple-fill",
            color: [227, 139, 79, 0.8], // Orange, opacity 80%
            outline: { color: [255, 255, 255], width: 1 },
        };

        const polygonGraphic = new Graphic({
            geometry: polygon,
            symbol: simpleFillSymbol,

        });
        graphicsLayer.add(polygonGraphic);
    }


    onMounted(() => {
        initMap()
    })
</script>

<template>
    <h2>ArcGIS Maps SDK for JavaScript Tutorials: Display a map444</h2>
    <div id="container">
        <div ref="mapDiv" class="map-div"></div>
    </div>
</template>

<style>
   #container {
      height: 100%;
      margin: 0;
    }
    .map-div {
        height: 100%;
    }

</style>
这样就实现了在地图上做标记的功能