在我们开发的上位机软件运行过程中,界面卡顿、响应延迟是较为常见的问题,其诱因多种多样,其中CPU 利用率满载至 100% 是典型诱因之一。因此,实时监控 CPU 利用率,可有效判断上位机卡顿是否由 CPU 负载过高引发。通常情况下,CPU 负载过高多出现于程序死循环、线程未设置合理延时、线程数量过多等场景。
常见方法一:
通过Windows任务管理器来排查,如下图所示:
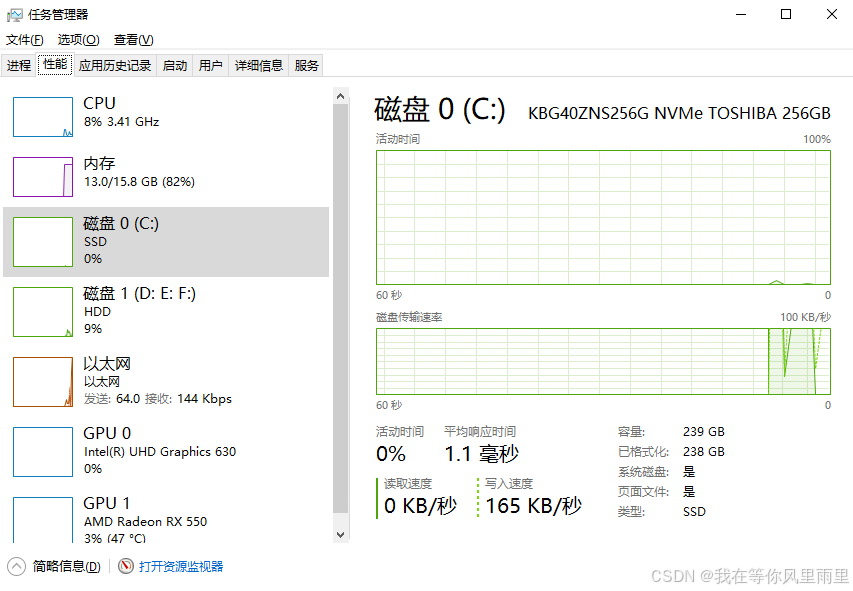
在 Windows 任务管理器的 "性能" 页面中,可以直观查看当前 CPU 利用率,例如上图显示为 8%。但这种手动查看方式存在明显不足:当上位机软件出现卡顿问题时,无法自动记录卡顿发生时刻的 CPU 使用状态,给问题定位与排查带来较大困难。
若能在程序代码中实现 CPU 状态的实时监控,并将 CPU 利用率自动写入本地日志,那么在软件发生卡顿时,即可通过时间点匹配对应日志记录,快速判断卡顿是否由 CPU 占用过高引起,从而精准定位问题根源。
下面通过PerformanceCounter类来获取可用CPU利用率:
MainWindow.xaml
<Window x:Class="WpfApplication1.MainWindow"
        xmlns="http://schemas.microsoft.com/winfx/2006/xaml/presentation"
        xmlns:x="http://schemas.microsoft.com/winfx/2006/xaml"
        xmlns:d="http://schemas.microsoft.com/expression/blend/2008"
        xmlns:mc="http://schemas.openxmlformats.org/markup-compatibility/2006"
        xmlns:local="clr-namespace:WpfApplication1"
        mc:Ignorable="d"
        Title="CPU监控" Height="200" Width="400">
    <Grid>
        <Label x:Name="Label1" HorizontalAlignment="Center" VerticalAlignment="Center" FontSize="20"></Label>
    </Grid>
</Window>
MainWindow.xaml.cs
using System;
using System.Runtime.InteropServices;
using System.Threading;
using System.Threading.Tasks;
using System.Windows;
namespace WpfApplication1
{
/// <summary>
/// Interaction logic for MainWindow.xaml
/// </summary>
public partial class MainWindow : Window
{
private int _processorCount;
private PERFORMANCE_COUNTER _cpuCounter = new PERFORMANCE_COUNTER();
[StructLayout(LayoutKind.Sequential)]
private class PERFORMANCE_COUNTER
{
public int dwSize = 0;
public long liUsage = 0;
public long liIdleTime = 0;
public long liUser = 0;
public long liNice = 0;
public long liSystem = 0;
public long liHighInt = 0;
public long liReserved = 0;
public long liCallerParty = 0;
public long liServiceCode = 0;
public long liVector = 0;
}
[DllImport("kernel32.dll")]
private static extern bool GlobalMemoryStatusEx(ref MEMORYSTATUSEX lpBuffer);
[StructLayout(LayoutKind.Sequential)]
private struct MEMORYSTATUSEX
{
public uint dwLength;
public uint dwMemoryLoad;
public ulong ullTotalPhys;
public ulong ullAvailPhys;
public ulong ullTotalPageFile;
public ulong ullAvailPageFile;
public ulong ullTotalVirtual;
public ulong ullAvailVirtual;
public ulong ullAvailExtendedVirtual;
}
[DllImport("ntdll.dll", SetLastError = true)]
private static extern int NtQuerySystemInformation(int SystemInformationClass, IntPtr SystemInformation, int SystemInformationLength, IntPtr ReturnLength);
[DllImport("kernel32.dll")]
private static extern bool GetSystemTimes(out long lpIdleTime, out long lpKernelTime, out long lpUserTime);
public MainWindow()
{
InitializeComponent();
_processorCount = Environment.ProcessorCount;
Task.Run(Run);
}
private void Run()
{
while (true)
{
CpuInfo cpuUsage = GetCpuUsage();
Dispatcher.Invoke(() =>
{
Label1.Content = cpuUsage.ToString();
});
Thread.Sleep(1000);
}
}
private CpuInfo GetCpuUsage()
{
try
{
long idleTime, kernelTime, userTime;
GetSystemTimes(out idleTime, out kernelTime, out userTime);
long totalCpuTime = kernelTime + userTime;
long busyTime = totalCpuTime - idleTime;
double cpuUsage = 0;
if (_cpuCounter.liUsage > 0)
{
long currentBusyTime = busyTime - (_cpuCounter.liUser + _cpuCounter.liSystem - _cpuCounter.liIdleTime);
long currentTotalTime = totalCpuTime - (_cpuCounter.liUser + _cpuCounter.liSystem);
if (currentTotalTime > 0)
{
cpuUsage = (double)currentBusyTime / currentTotalTime * 100;
cpuUsage = Math.Min(100, Math.Max(0, cpuUsage));
}
}
_cpuCounter.liIdleTime = idleTime;
_cpuCounter.liUser = userTime;
_cpuCounter.liSystem = kernelTime;
_cpuCounter.liUsage = busyTime;
return new CpuInfo
{
UsagePercentage = (float)cpuUsage,
ProcessCount = _processorCount
};
}
catch (Exception ex)
{
Dispatcher.Invoke(() =>
{
Label1.Content = $"错误: {ex.Message}";
});
return new CpuInfo { UsagePercentage = 0, ProcessCount = _processorCount };
}
}
public class CpuInfo
{
public float UsagePercentage { get; set; }
public int ProcessCount { get; set; }
public override string ToString()
{
return $"系统CPU占用率: {UsagePercentage:F0}%\n处理器数量: {ProcessCount}";
}
}
}
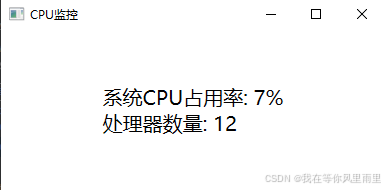
}运行界面如下: