Qt + GDAL 等高线生成示例
以下是REC533计算的5*5原始结果:
json
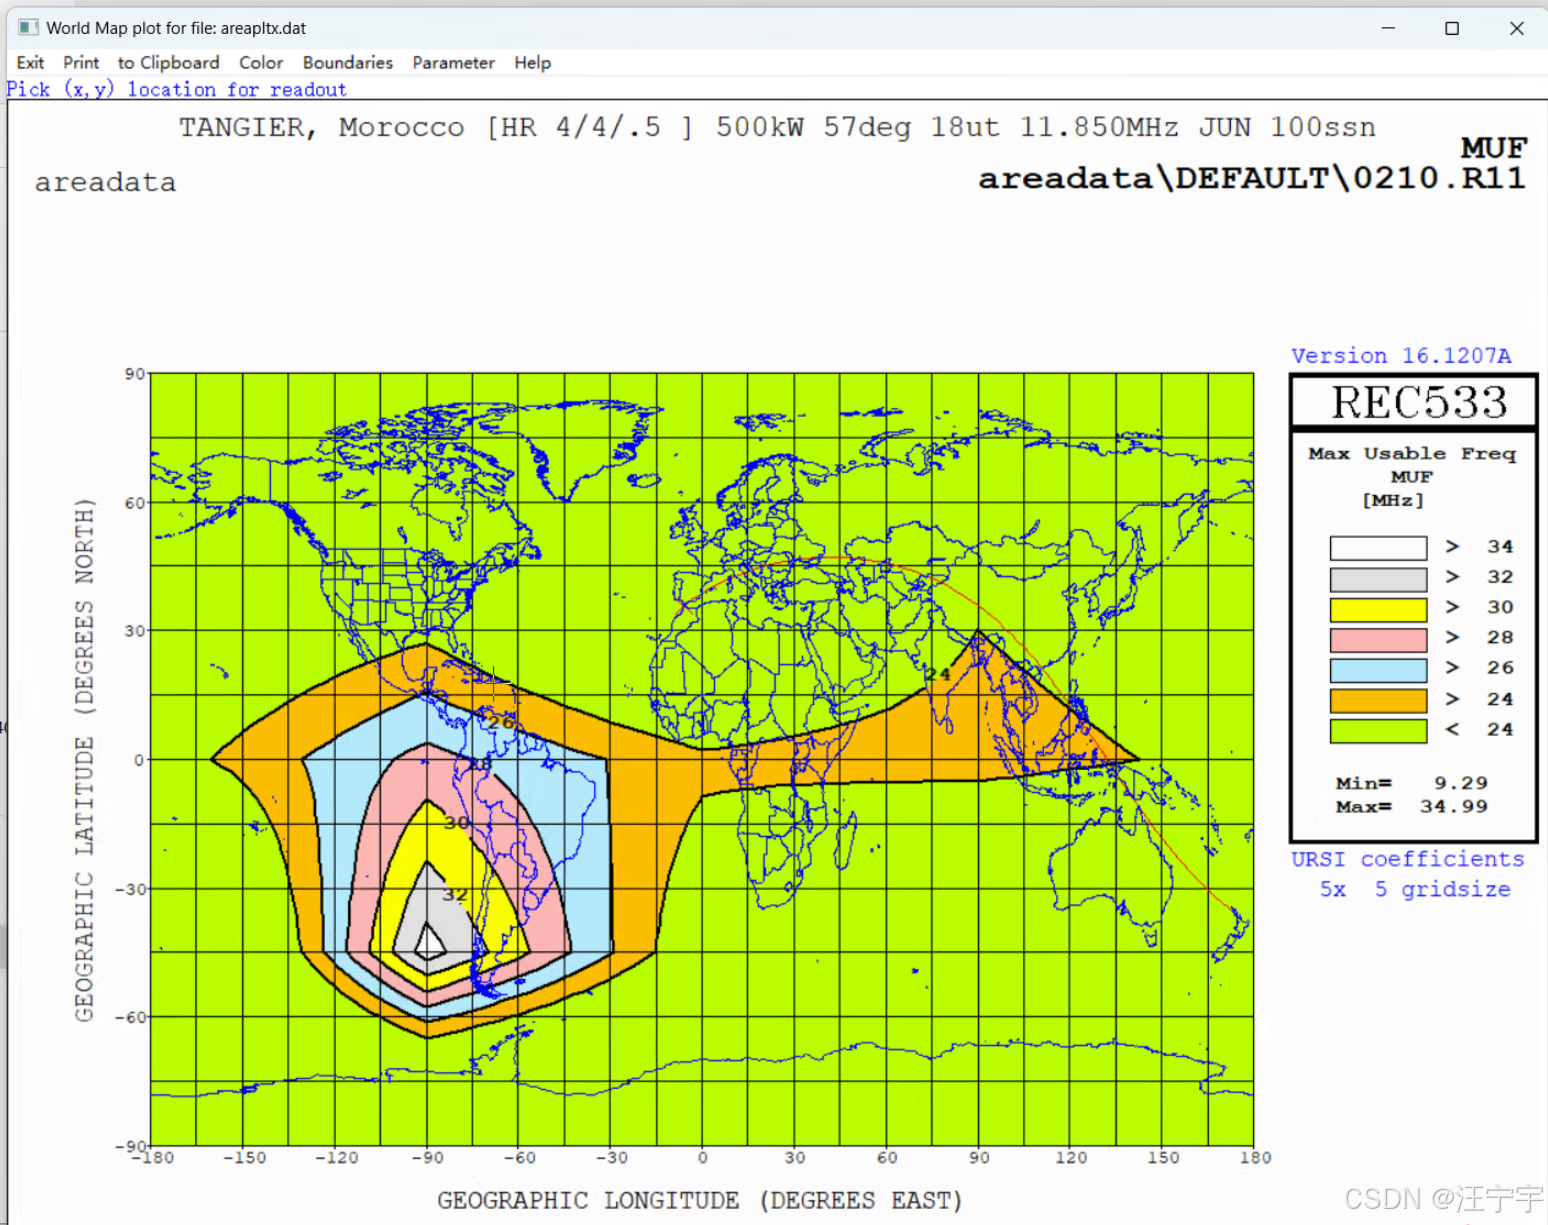
REC533 Version 16.1207A
TANGIER, Morocco [HR 4/4/.5 ] 500kW 57deg 18ut 11.850MHz JUN 100ssn
  5  5  Latitude Longitude   MUF  MODE  ANGL   DBU   S/N  FS/N  SNxx
  1  1  -90.0000 -180.0000 10.17   ---   3.0  -0.7  34.4 0.010  13.7
  2  1  -90.0000  -90.0000 10.17   ---   3.0  -0.7  34.4 0.010  13.7
  3  1  -90.0000    0.0000 10.17   ---   3.0  -0.7  34.4 0.010  13.7
  4  1  -90.0000   90.0000 10.17   ---   3.0  -0.7  34.4 0.010  13.7
  5  1  -90.0000  180.0000 10.17   ---   3.0  -0.7  34.4 0.010  13.7
  1  2  -45.0000 -180.0000 10.73   ---   3.0  -8.8  25.8 0.010   8.4
  2  2  -45.0000  -90.0000 34.99   ---   3.0 -44.8 -11.1 0.010 -25.2
  3  2  -45.0000    0.0000 21.74   ---   3.0  16.8  49.6 0.010  35.7
  4  2  -45.0000   90.0000  9.29   ---   3.0   3.8  38.9 0.010  21.4
  5  2  -45.0000  180.0000 10.73   ---   3.0  -8.8  25.8 0.010   8.4
  1  3    0.0000 -180.0000 22.68   ---   3.0 -41.2  -7.7 0.010 -23.5
  2  3    0.0000  -90.0000 28.70   ---   3.0 -36.1  -1.3 0.010 -15.6
  3  3    0.0000    0.0000 24.55   3F2  15.0  30.6  63.8 0.107  49.6
  4  3    0.0000   90.0000 25.86   ---   3.0  32.6  65.0 0.119  51.6
  5  3    0.0000  180.0000 22.68   ---   3.0 -41.2  -7.7 0.010 -23.5
  1  4   45.0000 -180.0000 19.18   ---   3.0 -16.7  18.0 0.010   2.0
  2  4   45.0000  -90.0000 20.91   4F2  22.0   1.6  37.1 0.010  20.9
  3  4   45.0000    0.0000 13.53   1E    8.0  49.7  82.6 0.791  65.8
  4  4   45.0000   90.0000 23.08   -I-   3.0  51.4  86.1 0.891  72.3
  5  4   45.0000  180.0000 19.18   ---   3.0 -16.7  18.0 0.010   2.0
  1  5   90.0000 -180.0000 18.79   3F2  17.0  19.8  54.9 0.010  38.8
  2  5   90.0000  -90.0000 18.79   3F2  17.0  19.8  54.9 0.010  38.8
  3  5   90.0000    0.0000 18.79   3F2  17.0  19.8  54.9 0.010  38.8
  4  5   90.0000   90.0000 18.79   3F2  17.0  19.8  54.9 0.010  38.8
  5  5   90.0000  180.0000 18.79   3F2  17.0  19.8  54.9 0.010  38.8
REC533软件输出的图形:
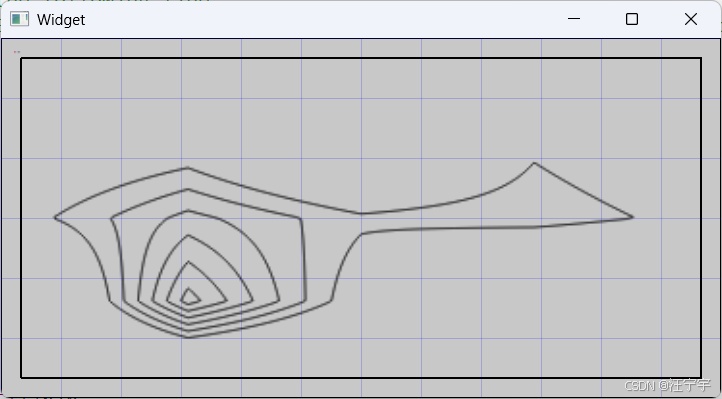
基于Qt5.15.12 + GDAL计算的结果:
1️⃣ 功能概览
这份代码的主要功能是:
- 对原始栅格数据进行双线性插值,将低分辨率网格(如 5x5)映射到高分辨率网格(如 360x180)。
- 使用 GDAL 的等高线生成器(Contour Generator)生成等值线。
- 将生成的等高线绘制到 QImage 上,通过 QPainter 可视化。
- 支持将插值后的数据存储为内存栅格数据集(MEM)或导出为 ESRI Shapefile 矢量文件。
- 提供坐标系转换工具函数,将绘图坐标转换为地图坐标。
- 提供多边形数据管理工具,如按等高线等级分组存储多边形。
2️⃣ 详细描述
-
栅格插值
- 从小网格(如 5×5)插值生成大网格(如 360×180)。
- 使用 双线性插值 算法 (
bilinearInterpolation/interpolateGrid)。 - 支持无效值处理(
NaN或指定NoData值)。
-
等高线生成
- 使用 GDAL 内存等高线生成器 (
GDALContourGeneratorH)。 - 按设定的 等高线间隔 (
g_dfContourInterval) 和 基准值 (g_dfContourBase) 生成等高线。 - 自定义回调函数
rasterContourWriter2:- 转为 Qt 多边形 (
QPolygonF)。 - 使用
QPainter绘制等高线。 - 管理多条等高线等级 (
g_vPolygonList)。
- 转为 Qt 多边形 (
- 使用 GDAL 内存等高线生成器 (
-
绘图与可视化
- 生成 QImage / QPixmap,绘制红色等高线。
- 可直接在 Qt 界面显示。
-
生成 GIS 数据
- 内存栅格数据集 (
MEM驱动)。 - 写入 GDAL 栅格波段。
- 生成 Shapefile 矢量数据:
- 每条等高线存为线要素。
- 自动创建字段(ID、高程等)。
- 使用
GDALContourGenerate输出等高线。
- 内存栅格数据集 (
-
坐标系转换
- 从绘图坐标系 (0~360, 0~180) 转到地理坐标系 (-180~180, -90~90)。
cpp
QT       += core gui

greaterThan(QT_MAJOR_VERSION, 4): QT += widgets

CONFIG += c++17
DESTDIR = bin

# https://gisinternals.com/query.html?content=filelist&file=release-1929-x64-gdal-3-12-1-mapserver-8-6-0.zip
#       https://download.gisinternals.com/sdk/downloads/release-1929-x64-gdal-3-12-1-mapserver-8-6-0.zip
#       https://download.gisinternals.com/sdk/downloads/release-1929-x64-gdal-3-12-1-mapserver-8-6-0-libs.zip
INCLUDEPATH += "D:/class/gdal-3-12-1/include"
LIBS += -LD:/class/gdal-3-12-1/lib
LIBS += -lgdal_i

# You can make your code fail to compile if it uses deprecated APIs.
# In order to do so, uncomment the following line.
#DEFINES += QT_DISABLE_DEPRECATED_BEFORE=0x060000    # disables all the APIs deprecated before Qt 6.0.0

SOURCES += \
    gdal_public.cpp \
    main.cpp \
    widget.cpp

HEADERS += \
    gdal_public.h \
    widget.h

FORMS += \
    widget.ui

# Default rules for deployment.
qnx: target.path = /tmp/$${TARGET}/bin
else: unix:!android: target.path = /opt/$${TARGET}/bin
!isEmpty(target.path): INSTALLS += target
gdal_public.h
cpp
#ifndef GDAL_PUBLIC_H
#define GDAL_PUBLIC_H

#include <QPainter>
#include <QImage>
#include <QPolygonF>
#include <QPointF>
#include <QVector>
#include <QDebug>

#include "cpl_conv.h"       // 必须放最前
#include "gdal_priv.h"
#include "gdal_alg.h"       // Contour API
#include "ogr_api.h"
#include "ogrsf_frmts.h"

#define SIZE_LAT   90
#define SIZE_LNG   180

typedef struct tagMY_POLYGON_LIST
{
    double              m_fLevel;
    QVector<QPolygonF>  m_vPolygon;
    tagMY_POLYGON_LIST() : m_fLevel(0.0f)  {}
    tagMY_POLYGON_LIST(double level) : m_fLevel(level) {}
}MY_POLYGON_LIST;

// 等高线的间隔和基准
extern double                      g_dfContourInterval;
extern double                      g_dfContourBase;
extern int                         g_bNoDataSet;
extern double                      g_dfNoDataValue;

extern QPixmap                     *g_PixmapResult;

extern QVector<QColor>             g_vColorBand;
extern QVector<MY_POLYGON_LIST *>  g_vPolygonList;

void addPolygon(double dfLevel, QPolygonF polygon);
void getDrawXY(double ax, double ay, double &bx, double & by);

void gdal_genPolygon();

double idw_get_z(const double x, const double y);

// 利用IDW插值算法补齐空白点
int idw_make_points();

int grid_bilinearInterpolation();

#endif // GDAL_PUBLIC_H
gdal_public.cpp
cpp
#include "gdal_public.h"    // 自定义封装

// 定义常量:地球半径 (单位:千米)
const double R = 6371.0;

// 等高线的间隔和基准
double                      g_dfContourInterval = 2.0f;         // 等值线间隔
double                      g_dfContourBase = 24.0f;            // 等值线基准值, 从多少开始
int                         g_bNoDataSet = FALSE;               // 是否使用 NoData 值
double                      g_dfNoDataValue = std::nan("-9999.0");// 或者设置为一个特定的值,如 -9999

// 定义常见颜色并将其存储在 QVector 中
QVector<QColor>             g_vColorBand;

// 当前等值多边形
QVector<MY_POLYGON_LIST *>  g_vPolygonList;

QPixmap                     *g_PixmapResult;

// 按z值升序排序
bool comparePolygon(MY_POLYGON_LIST a, MY_POLYGON_LIST b) {
    return a.m_fLevel > b.m_fLevel;
}

// 比较两个浮点值是否相等
bool compareDoubles(double a, double b, double epsilon = 1e-9) {
    return std::fabs(a - b) < epsilon;
}

// 添加一个地图坐标系中的多边形
void addPolygon(double dfLevel, QPolygonF polygon)
{
    MY_POLYGON_LIST *pItem;

    foreach(pItem, g_vPolygonList)
    {
        if(compareDoubles(pItem->m_fLevel, dfLevel))
        {
            pItem->m_vPolygon.push_back(polygon);
            return;
        }
    }

    pItem = new MY_POLYGON_LIST;
    pItem->m_fLevel = dfLevel;
    pItem->m_vPolygon.push_back(polygon);
    g_vPolygonList.push_back(pItem);
}

// 从绘图坐标获取地图坐标的位置
//坐标系A:矩形左上角X=0,Y=0;        左下角X=0,Y=180;       右上角X=360,Y=0;       下角X=360,Y=180
//坐标系B:矩形左上角X=-180,Y=90;    左下角X=-180,Y=-90;    右上角X=180,Y=90;      右下角X=180,Y=-90
void getDrawXY(double ax, double ay, double &bx, double & by)
{
    // X轴转换:坐标系A的 [0, 360] 转换到坐标系B的 [-180, 180]
    bx = ax - 180.0f;

    // Y轴转换:坐标系A的 [0, 180] 转换到坐标系B的 [-90, 90]
    by = 90.0f - ay;
}


// 双线性插值求未知点坐标
double bilinearInterpolation(double x, double y, const std::vector<std::vector<double>>& grid)
{
    int x1 = static_cast<int>(x);
    int y1 = static_cast<int>(y);
    int x2 = x1 + 1;
    int y2 = y1 + 1;

    // 防止越界
    x2 = qMin(x2, static_cast<int>(grid.size()) - 1);
    y2 = qMin(y2, static_cast<int>(grid[0].size()) - 1);

    double q11 = grid[x1][y1];
    double q12 = grid[x1][y2];
    double q21 = grid[x2][y1];
    double q22 = grid[x2][y2];

    double denom = (x2 - x1) * (y2 - y1);

    // 双线性插值公式
    double interpolatedValue = q11 * (x2 - x) * (y2 - y) / denom
                               + q21 * (x - x1) * (y2 - y) / denom
                               + q12 * (x2 - x) * (y - y1) / denom
                               + q22 * (x - x1) * (y - y1) / denom;

    // 过滤无效值
    if(isnan(interpolatedValue))
        return -9999.0f;

    return interpolatedValue;
}

// 双线性插值算法: 将30x30网格映射到360x180网格
std::vector<std::vector<double>> interpolateGrid(const std::vector<std::vector<double>> & originalGrid, int targetWidth, int targetHeight)
{
    int                                 originalWidth = originalGrid.size();
    int                                 originalHeight = originalGrid[0].size();
    std::vector<std::vector<double>>    targetGrid(targetWidth, std::vector<double>(targetHeight));

    for (int j = 0; j < targetHeight; ++j)
    {
        for (int i = 0; i < targetWidth; ++i)
        {
            // 计算原始网格坐标
            double origX = static_cast<double>(i) / (targetWidth - 1) * (originalWidth - 1);
            double origY = static_cast<double>(j) / (targetHeight - 1) * (originalHeight - 1);

            // 使用双线性插值计算目标网格点的值
            targetGrid[i][j] = bilinearInterpolation(origX, origY, originalGrid);
        }
    }

    return targetGrid;
}


// 自定义的等高线写操作器
CPLErr rasterContourWriter2(double dfLevel, int nPoints, double *padfX, double *padfY, void *ptr)
{
    char        szMsg[256] = {0x00};

    // 小于基数的Z值不处理
    if(dfLevel < g_dfContourBase)
        return CE_None;

    // 如果需要绘制,可以使用 QPainter
    QPainter    *painter = static_cast<QPainter*>(ptr);  // 获取 QPainter 对象
    QPolygonF   polygon, polyDraw;
    double      bx, by;
    for (int i = 0; i < nPoints; i++) {
        polygon.append(QPointF(padfX[i], padfY[i]));

        getDrawXY(padfX[i], padfY[i], bx, by);
        polyDraw.append(QPointF(bx, by));
        sprintf(szMsg, "   level:%.2f, ax=%.2f, ay=%.2f, bx=%.2f, by=%.2f", dfLevel, padfX[i], padfY[i], bx, by);
        qDebug() << szMsg;

    }
    addPolygon(dfLevel, polyDraw);

    // 如果该多边形红框无效或面积小于10
    if(!polygon.isClosed() || polygon.isEmpty())
        return CE_None;

    // 创建一个红色的画笔,并设置线宽为1
    QPen pen;
    pen.setColor(Qt::red);
    pen.setWidth(1);

    // 设置画笔并绘制多边形
    painter->setPen(pen);
    painter->setBrush(Qt::NoBrush);  // 不填充

    // 设置边框色
    QPen borderPen(QColor(0, 0, 0));  // 黑色边框
    painter->setPen(borderPen);
    painter->drawPolygon(polygon);
    return CE_None;
}


// 双线性插值方法
int grid_bilinearInterpolation()
{
    // 设置目标网格大小为360x180
    const int                   targetWidth = 360;
    const int                   targetHeight = 180;

    // 它是GDAL库中的一个等高线生成器类
    GDALContourGeneratorH       cg = NULL;

    // 一定要初始化 GDAL
    GDALAllRegister();

    // 存储插值后的数据点阵(左上角为0,0;右下角为正值区)
    std::vector<std::vector<double>>    targetGrid;

    // 按行存储所有插值结果(左上角为0,0;右下角为正值区;从上至下和从左至右扫描)
    double                              *pZValues = NULL, *pScanLine = NULL;

    // 假设原始网格数据是5x5的
    const int       originalSize = 5;
    std::vector<std::vector<double>> originalGrid(originalSize, std::vector<double>(originalSize));

    // Latitude:    纬度Y
    // Longitude:   经度X
    // [X][Y]

    /*
  5  5  Latitude Longitude   MUF  MODE  ANGL   DBU   S/N  FS/N  SNxx
  1  1  -90.0000 -180.0000 10.17   ---   3.0  -0.7  34.4 0.010  13.7
  2  1  -90.0000  -90.0000 10.17   ---   3.0  -0.7  34.4 0.010  13.7
  3  1  -90.0000    0.0000 10.17   ---   3.0  -0.7  34.4 0.010  13.7
  4  1  -90.0000   90.0000 10.17   ---   3.0  -0.7  34.4 0.010  13.7
  5  1  -90.0000  180.0000 10.17   ---   3.0  -0.7  34.4 0.010  13.7
*/
    originalGrid[0][4] = 10.17;
    originalGrid[1][4] = 10.17;
    originalGrid[2][4] = 10.17;
    originalGrid[3][4] = 10.17;
    originalGrid[4][4] = 10.17;

    /*
  1  2  -45.0000 -180.0000 10.73   ---   3.0  -8.8  25.8 0.010   8.4
  2  2  -45.0000  -90.0000 34.99   ---   3.0 -44.8 -11.1 0.010 -25.2
  3  2  -45.0000    0.0000 21.74   ---   3.0  16.8  49.6 0.010  35.7
  4  2  -45.0000   90.0000  9.29   ---   3.0   3.8  38.9 0.010  21.4
  5  2  -45.0000  180.0000 10.73   ---   3.0  -8.8  25.8 0.010   8.4
*/
    originalGrid[0][3] = 10.73;
    originalGrid[1][3] = 34.99;
    originalGrid[2][3] = 21.74;
    originalGrid[3][3] = 9.29;
    originalGrid[4][3] = 10.73;

    /*
  1  3    0.0000 -180.0000 22.68   ---   3.0 -41.2  -7.7 0.010 -23.5
  2  3    0.0000  -90.0000 28.70   ---   3.0 -36.1  -1.3 0.010 -15.6
  3  3    0.0000    0.0000 24.55   3F2  15.0  30.6  63.8 0.107  49.6
  4  3    0.0000   90.0000 25.86   ---   3.0  32.6  65.0 0.119  51.6
  5  3    0.0000  180.0000 22.68   ---   3.0 -41.2  -7.7 0.010 -23.5
*/
    originalGrid[0][2] = 22.68;
    originalGrid[1][2] = 28.70;
    originalGrid[2][2] = 24.55;
    originalGrid[3][2] = 25.86;
    originalGrid[4][2] = 22.68;

    /*
  1  4   45.0000 -180.0000 19.18   ---   3.0 -16.7  18.0 0.010   2.0
  2  4   45.0000  -90.0000 20.91   4F2  22.0   1.6  37.1 0.010  20.9
  3  4   45.0000    0.0000 13.53   1E    8.0  49.7  82.6 0.791  65.8
  4  4   45.0000   90.0000 23.08   -I-   3.0  51.4  86.1 0.891  72.3
  5  4   45.0000  180.0000 19.18   ---   3.0 -16.7  18.0 0.010   2.0
*/
    originalGrid[0][1] = 19.18;
    originalGrid[1][1] = 20.91;
    originalGrid[2][1] = 13.53;
    originalGrid[3][1] = 23.08;
    originalGrid[4][1] = 19.18;

    /*
    1  5   90.0000 -180.0000 18.79   3F2  17.0  19.8  54.9 0.010  38.8
    2  5   90.0000  -90.0000 18.79   3F2  17.0  19.8  54.9 0.010  38.8
    3  5   90.0000    0.0000 18.79   3F2  17.0  19.8  54.9 0.010  38.8
    4  5   90.0000   90.0000 18.79   3F2  17.0  19.8  54.9 0.010  38.8
    5  5   90.0000  180.0000 18.79   3F2  17.0  19.8  54.9 0.010  38.8
*/
    originalGrid[0][0] = 18.79;
    originalGrid[1][0] = 18.79;
    originalGrid[2][0] = 18.79;
    originalGrid[3][0] = 18.79;
    originalGrid[4][0] = 18.79;

    /////////////////////////////////////////////////////////////////////////////////
    // 插值并获得目标网格数据
    targetGrid = interpolateGrid(originalGrid, targetWidth, targetHeight);

    // 输出插值后的结果(这里只打印一些值来验证)
    pZValues = new double[targetWidth * targetHeight * sizeof(double)];
    for (int i = 0; i < targetHeight; ++i)
    {
        for (int j = 0; j < targetWidth; ++j)
        {
            pZValues[i * targetWidth + j] = targetGrid[j][i];
        }
    }

    // 这里是调用QImage存储结果(可忽略)
    // 创建一个简单的 QPainter 用于绘制等高线
    QImage      *image = new QImage(targetWidth, targetHeight, QImage::Format_ARGB32);
    QPainter    *painter = new QPainter(image);
    painter->setPen(Qt::black);
    painter->setRenderHint(QPainter::Antialiasing); // 启用抗锯齿

    cg = GDAL_CG_Create(targetWidth, targetHeight, g_bNoDataSet, g_dfNoDataValue, g_dfContourInterval, g_dfContourBase, rasterContourWriter2, painter);

    // 将内存数据传递给等高线生成器
    pScanLine = pZValues;
    for (int i = 0; i < targetHeight; ++i) {
        GDAL_CG_FeedLine(cg, pScanLine);
        pScanLine += targetWidth;  // 每行宽度
    }
    GDAL_CG_Destroy(cg);


    // 保存生成的图像
    image->save("./123.png");
    if(!g_PixmapResult)
        g_PixmapResult = new QPixmap();
    *g_PixmapResult = QPixmap::fromImage(*image);

    /////////////////////////////////////////////////////////////////////////////////////////////////////
    // 生成tif创建内存中的栅格数据集
    double xMin = -targetWidth/2;
    double xMax = targetWidth/2;
    double yMin = -targetHeight/2;
    double yMax = targetHeight/2;

    // 栅格行列数 (1 度 × 1 度分辨率)
    int     rows = targetHeight;
    int     cols = targetWidth;

    GDALDriver* poDriver = GetGDALDriverManager()->GetDriverByName("MEM");
    if (!poDriver) {
        return 0;
    }

    GDALDataset* poDataset = poDriver->Create("contours.shp", cols, rows, 1, GDT_Float64, nullptr);
    if (!poDataset) {
        return 0;
    }

    // 设置地理变换(左上角坐标和像素大小)
    double pixelSizeX = (double)(xMax - xMin) / (double)cols;
    double pixelSizeY = (double)(yMax - yMin) / (double)rows;
    double adfGeoTransform[6] = {(double)xMin, pixelSizeX, 0, (double)yMax, 0, -pixelSizeY}; // y 轴向下为正
    poDataset->SetGeoTransform(adfGeoTransform);

    // 写入插值后的 z 值数据
    GDALRasterBand          *poBand = poDataset->GetRasterBand(1);

    poBand->RasterIO(GF_Write, 0, 0, cols, rows, pZValues, cols, rows, GDT_Float64, 0, 0);

    // 创建矢量数据集(用于存储等值线)
    GDALDriver* poVectorDriver = GetGDALDriverManager()->GetDriverByName("ESRI Shapefile");
    if (!poVectorDriver) {
        return 0;
    }

    GDALDataset* poVectorDataset = poVectorDriver->Create("contours.shp", 0, 0, 0, GDT_Unknown, nullptr);
    if (!poVectorDataset) {
        return 0;
    }

    // 创建图层
    OGRLayer* poLayer = poVectorDataset->CreateLayer("contours", nullptr, wkbLineString, nullptr);
    if (!poLayer) {
        return 0;
    }

    // 添加字段(等值线值)
    OGRFieldDefn oField("ID", OFTInteger);
    if (poLayer->CreateField(&oField) != OGRERR_NONE) {
        return 0;
    }

    // 生成等值线
    double  contourInterval = 2.0;          // 等值线间隔
    double  contourBase = 22.0;             // 等值线基准值
    int     nFixedLevelCount = 0;           // 固定等值线数量
    double  *fixedLevels = nullptr;         // 固定等值线值
    int     bUseNoData = FALSE;             // 是否使用 NoData 值
    double  dfNoDataValue = std::nan("");   // NoData 值,使用 NaN
    int     iIDField = 0;                   // 字段索引
    int     iElevField = 0;                 // 高程字段索引

    CPLErr err = GDALContourGenerate(
        poBand, contourInterval, contourBase, nFixedLevelCount, fixedLevels,
        bUseNoData, dfNoDataValue, poLayer, iIDField, iElevField, nullptr, nullptr
        );
    if (err != CE_None) {
        return 0;
    }

    // 清理
    GDALClose(poDataset);
    GDALClose(poVectorDataset);

    delete [] pZValues;
    pZValues = NULL;
    return 1;
}
widget.h
cpp
#ifndef WIDGET_H
#define WIDGET_H

#include <QWidget>
#include <QPainter>
#include <QPaintEvent>
#include <QMessageBox>

QT_BEGIN_NAMESPACE
namespace Ui {
class Widget;
}
QT_END_NAMESPACE

class Widget : public QWidget
{
    Q_OBJECT

public:
    Widget(QWidget *parent = nullptr);
    ~Widget();

    int     getNewPoint(int iOldX, int iOldY, int &iNewX, int &iNewY);
    int     getOldPoint(int iNewX, int iNewY, int &iOldX, int &iOldY);

    void    drawBack(QPainter & painter);
    void    drawPolygonList(QPainter & painter);

protected:
    void mousePressEvent(QMouseEvent *event) override;
    void paintEvent(QPaintEvent *event) override;


public:
    double m_fScaleX, m_fScaleY;

private:
    double xMin = -180.0, xMax = 180.0;
    double yMin = -90.0, yMax = 90.0;

private:
    Ui::Widget *ui;
};
#endif // WIDGET_H
widget.cpp
cpp
#include "widget.h"
#include "ui_widget.h"
#include "gdal_public.h"


Widget::Widget(QWidget *parent)
    : QWidget(parent)
    , ui(new Ui::Widget)
{
    ui->setupUi(this);

    this->resize(360 * 2, 180 * 2);

    grid_bilinearInterpolation();

    ui->label->setPixmap(*g_PixmapResult);
    ui->label->setScaledContents(true); // 直接拉伸内容
    ui->label->setAlignment(Qt::AlignCenter);
}

Widget::~Widget()
{
    delete ui;
}


int Widget::getNewPoint(int iOldX, int iOldY, int &iNewX, int &iNewY)
{
    // 获取窗口的宽度和高度
    int width = this->width();
    int height = this->height();

    // 坐标系的范围
    //double xMin = -181.0, xMax = 181.0;
    //double yMin = -91.0, yMax = 91.0;

    // 计算缩放因子
    double scaleX = (xMax - xMin) / width;
    double scaleY = (yMax - yMin) / height;

    // 计算坐标平移后的原始坐标
    double translatedX = iOldX - (width / 2);
    double translatedY = iOldY - (height / 2);

    // 将原始坐标转换为目标坐标系
    iNewX = translatedX * scaleX;  // 转换为 x 坐标
    iNewY = -translatedY * scaleY; // 转换为 y 坐标(y轴翻转)

    return 0;
}


int Widget::getOldPoint(int iNewX, int iNewY, int &iOldX, int &iOldY)
{
    // 获取窗口的宽度和高度
    int width = this->width();
    int height = this->height();

    // 坐标系的范围
    //double xMin = -180.0, xMax = 180.0;
    //double yMin = -90.0, yMax = 90.0;

    // 计算缩放因子
    double scaleX = (xMax - xMin) / width;
    double scaleY = (yMax - yMin) / height;

    // 反向缩放,得到窗口坐标系的值
    double translatedX = (iNewX / scaleX);
    double translatedY = (iNewY / scaleY);

    // 反向平移,使得坐标回到左上角为原点的坐标系
    iOldX = translatedX + (width / 2);
    iOldY = translatedY + (height / 2);

    return 0;
}


void Widget::drawBack(QPainter & painter)
{
    // 获取窗口的宽度和高度
    int width = this->width();
    int height = this->height();

    // 坐标系的范围,窗口区域为 361 x 181
    double xMin = 0.0, xMax = 360.0;
    double yMin = 0.0, yMax = 180.0;

    // 计算缩放因子,确保坐标系统在窗口拉伸时自适应
    double scaleX = width / (xMax - xMin);
    double scaleY = height / (yMax - yMin);

    // 设置缩放因子
    painter.scale(scaleX, scaleY);

    // 将坐标系平移到窗口的左上角 (0, 0)
    painter.translate(xMin, yMin);

    // 绘制一个矩形,左上角为 (0, 0),右下角为 (361, 181)
    painter.setBrush(QBrush(QColor(200, 200, 200)));
    painter.drawRect(0, 0, 360, 180);  // 绘制一个矩形

    // 绘制坐标轴
    painter.setPen(Qt::black);
    painter.drawLine(0, 0, 360, 0); // x 轴
    painter.drawLine(0, 0, 0, 180); // y 轴
    \
        // 注意一下,虽然旋转调整了Y轴,但绘图函数仍是以上角为中心点
        QPolygonF polygon;
    polygon.append(QPointF(10, 10));
    polygon.append(QPointF(350, 10));
    polygon.append(QPointF(350, 170));
    polygon.append(QPointF(10, 170));
    polygon.append(QPointF(10, 10));
    painter.drawPolygon(polygon);

    // 绘制网格线
    painter.setPen(QPen(Qt::blue, 0.1));
    for (int i = 0; i <= 360; i += 30) {
        painter.drawLine(i, 0, i, 181);  // 绘制竖直线
    }
    for (int j = 0; j <= 180; j += 30) {
        painter.drawLine(0, j, 360, j);  // 绘制水平线
    }
}

void Widget::mousePressEvent(QMouseEvent *event)
{
    int x, y, iOldX, iOldY;
    getNewPoint(event->x(), event->y(), x, y);

    getOldPoint(x, y, iOldX, iOldY);

    int     width = this->width();
    int     height = this->height();
    double scaleX = (xMax - xMin) / width;
    double scaleY = (yMax - yMin) / height;

    iOldX *= scaleX;
    iOldY *= scaleY;

    QString     strText = QString("iNewX=%1, iNewY=%2, iOldX=%3, iOldY=%3").arg(x).arg(y).arg(iOldX).arg(iOldY);
    setWindowTitle(strText);
}

void Widget::paintEvent(QPaintEvent *event)
{
    Q_UNUSED(event)

    QPainter    painter(this);

    drawBack(painter);
    //drawPolygonList(painter);
}

void Widget::drawPolygonList(QPainter & painter)
{
    int     index = 0;

    // 添加常见颜色到 colorBand
    if(g_vColorBand.size() == 0)
    {
        g_vColorBand.append(QColor(255, 0, 0));    // Red
        g_vColorBand.append(QColor(0, 255, 0));    // Green
        g_vColorBand.append(QColor(0, 0, 255));    // Blue
        g_vColorBand.append(QColor(255, 255, 0));  // Yellow
        g_vColorBand.append(QColor(255, 165, 0));  // Orange
        g_vColorBand.append(QColor(75, 0, 130));   // Indigo
        g_vColorBand.append(QColor(238, 130, 238)); // Violet
        g_vColorBand.append(QColor(0, 255, 255));  // Cyan
        g_vColorBand.append(QColor(255, 255, 255)); // White
        g_vColorBand.append(QColor(0, 0, 0));      // Black
    }

    if(g_vPolygonList.size() == 0)
        return;

    foreach(MY_POLYGON_LIST *pList, g_vPolygonList)
    {
        // 设置画笔颜色(边框颜色)
        QPen pen(Qt::black);  // 黑色边框
        painter.setPen(pen);

        // 设置填充颜色
        QBrush brush(g_vColorBand.at(index));  // 填充蓝色
        painter.setBrush(brush);

        foreach(QPolygonF polygon, pList->m_vPolygon)
        {
            painter.drawPolygon(polygon);
        }

        index++;
    }
}
widget.ui
cpp
<?xml version="1.0" encoding="UTF-8"?>
<ui version="4.0">
 <class>Widget</class>
 <widget class="QWidget" name="Widget">
  <property name="geometry">
   <rect>
    <x>0</x>
    <y>0</y>
    <width>800</width>
    <height>600</height>
   </rect>
  </property>
  <property name="windowTitle">
   <string>Widget</string>
  </property>
  <layout class="QGridLayout" name="gridLayout">
   <item row="0" column="0">
    <widget class="QLabel" name="label">
     <property name="text">
      <string/>
     </property>
    </widget>
   </item>
  </layout>
 </widget>
 <resources/>
 <connections/>
</ui>
main.cpp
cpp
#include "widget.h"

#include <QApplication>
#include <QCoreApplication>
#include <QDir>
#include <QDebug>
#include <QProcessEnvironment>

#ifdef Q_OS_WIN
#include <windows.h>
#endif

void addGdalBinToPath()
{
    // 1. 获取可执行文件所在目录
    QString exeDir = QCoreApplication::applicationDirPath();

    // 2. 拼接 GDAL bin 路径
    QString gdalBinPath = QDir(exeDir).filePath("gdal_bin");

#ifdef Q_OS_WIN
    // 3. 获取当前 PATH
    wchar_t buffer[32767]; // 最大环境变量长度
    DWORD len = GetEnvironmentVariableW(L"PATH", buffer, 32767);
    QString currentPath = QString::fromWCharArray(buffer, len);

    // 4. 将 gdal_bin 添加到 PATH 前面
    QString newPath = gdalBinPath + ";" + currentPath;

    // 5. 设置当前进程的环境变量
    SetEnvironmentVariableW(L"PATH", (const wchar_t*)newPath.utf16());
#else
    // Linux / macOS
    QByteArray pathEnv = qgetenv("PATH");
    pathEnv = gdalBinPath.toUtf8() + ":" + pathEnv;
    qputenv("PATH", pathEnv);
#endif

    qDebug() << "GDAL bin path added to PATH:" << gdalBinPath;
}

int main(int argc, char *argv[])
{
    QApplication a(argc, argv);
    Widget w;
    w.show();
    return a.exec();
}