前言:c# winform UI控件系列(Net6+),纯GDI绘图无依赖,虽然做不到最好,争取做好更好用!
一、效果图 (x轴三种类型:数值、时间、字符串)
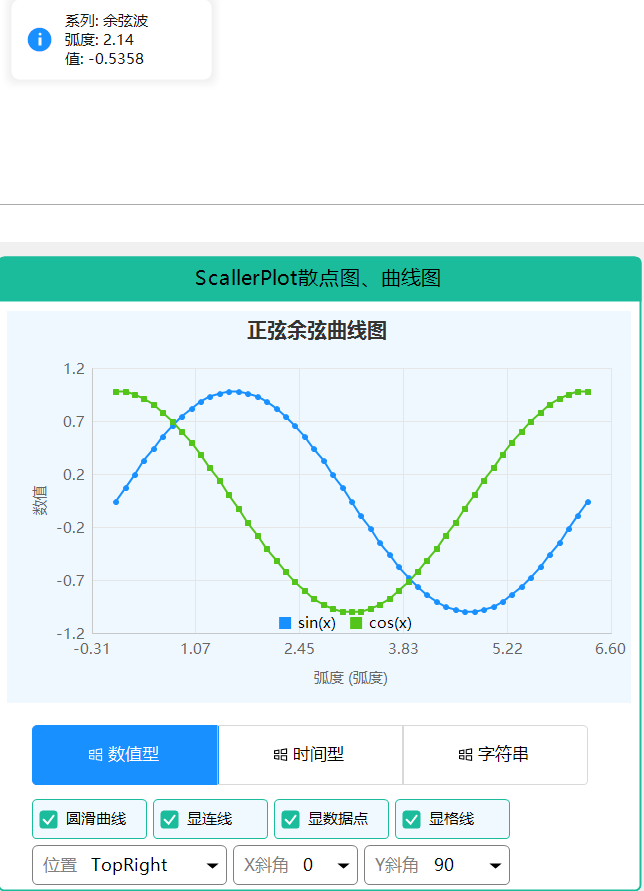
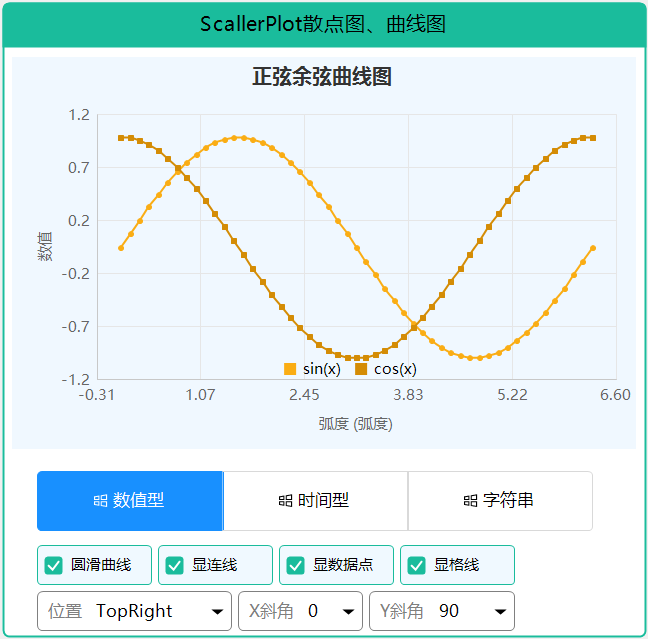
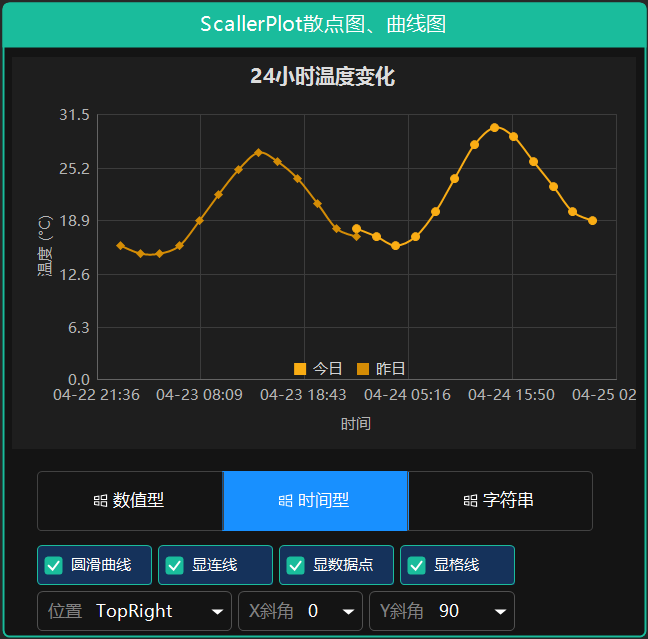
- 支持五种颜色风格。
- 标题:位置支持(左中右布局)
- x轴标题、y轴标题:支持旋转角度。图例支持位置定义(选择合适位置)
- 是否显示连线,是否显示网格线,是否圆滑曲线
二、使用说明
ScatterPlot 散点图/折线图控件
控件简介
ScatterPlot 是一个功能强大的散点图和折线图控件,参考 ScottPlot 设计,支持平滑曲线、多种X轴类型(数值型、字符串型、日期时间型)、网格线、值提示和图例显示。
主要特性
- 多种X轴类型:支持 Numeric(数值)、Category(字符串类别)、DateTime(日期时间)
- 平滑曲线:支持 Smooth 平滑曲线显示,可调整张力
- 网格线:支持 X/Y 轴网格线显示控制
- 值提示:鼠标悬停显示数据点值,支持自动格式化
- 图例位置控制:支持 7 种图例位置(None, TopLeft, TopCenter, TopRight, BottomLeft, BottomCenter, BottomRight)
- 轴标签旋转:支持 X/Y 轴标签旋转角度设置
- 自动日期时间格式:根据时间跨度自动选择最优显示格式
- 属性变更通知:实现 INotifyPropertyChanged,属性值改变立即生效
基本使用
简单散点图
csharp
// 创建散点图控件
var scatterPlot = new ScatterPlot
{
    Dock = DockStyle.Fill,
    ColorType = ColorType.Primary
};

// 添加数据系列
var series = new ScatterSeries
{
    Name = "系列1",
    ShowLine = true,
    ShowMarkers = true,
    Smooth = true
};

// 添加数据点
for (int i = 0; i < 10; i++)
{
    series.Points.Add(new ScatterPoint(i, Math.Sin(i * 0.5) * 10 + 20));
}

scatterPlot.Series.Add(series);
scatterPlot.RefreshPlot();
this.Controls.Add(scatterPlot);
X轴类型设置
csharp
// 数值型(默认)
scatterPlot.XAxisType = XAxisType.Numeric;
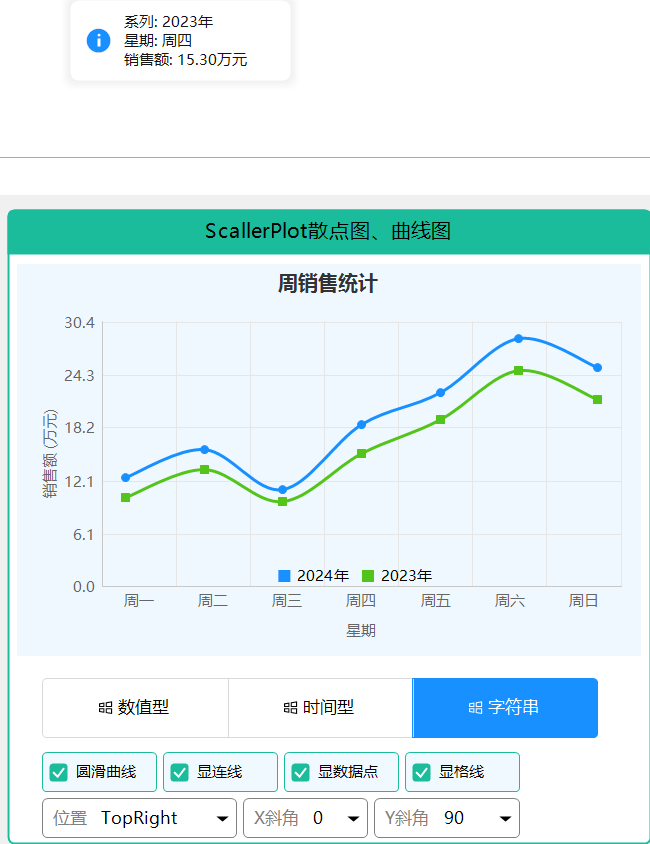
// 字符串类别型
scatterPlot.XAxisType = XAxisType.Category;
// 日期时间型
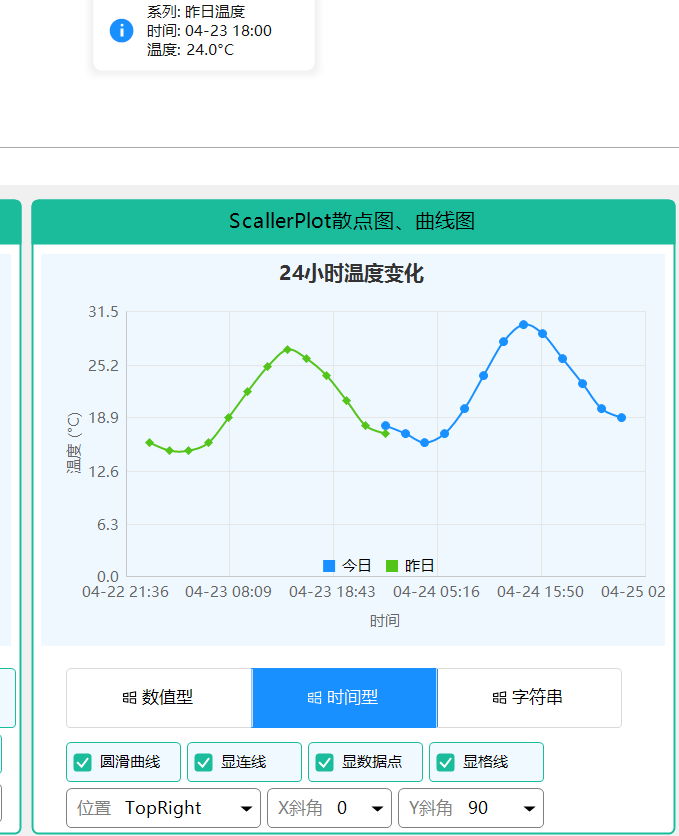
scatterPlot.XAxisType = XAxisType.DateTime;日期时间型数据
当使用 XAxisType.DateTime 时,控件会自动根据时间跨度选择合适的显示格式:
| 时间跨度 | X轴显示格式 | Tooltip格式 |
|---|---|---|
| ≤24小时 | HH:mm | HH:mm |
| ≤72小时 | MM-dd HH:mm | MM-dd HH:mm |
| ≤30天 | MM-dd | MM-dd |
| ≤1年 | yyyy-MM | yyyy-MM |
| >1年 | yyyy-MM-dd | yyyy-MM-dd |
csharp
// 日期时间型示例(24小时内数据)
scatterPlot.XAxisType = XAxisType.DateTime;
scatterPlot.Title = "24小时温度变化";
scatterPlot.XAxisLabel = "时间";

var series = new ScatterSeries
{
    Name = "今日温度",
    ShowLine = true,
    ShowMarkers = true
};

// 添加24小时内的数据点
DateTime today = DateTime.Now.Date;
series.Add(today.AddHours(0), 18);
series.Add(today.AddHours(6), 20);
series.Add(today.AddHours(12), 28);
series.Add(today.AddHours(18), 24);
series.Add(today.AddHours(24), 19);

scatterPlot.AddSeries(series);
scatterPlot.RefreshPlot();
图例位置控制
csharp
scatterPlot.ShowLegend = true;
scatterPlot.LegendPosition = LegendPosition.TopRight;  // 右上角
scatterPlot.LegendOrientation = LegendOrientation.Horizontal;  // 水平排列
轴标签旋转
csharp
// X轴标签旋转 45 度
scatterPlot.AxisLabelStyle.XAxisRotation = 45;

// Y轴标签旋转 -90 度
scatterPlot.AxisLabelStyle.YAxisRotation = -90;
网格线控制
csharp
// 显示 X 轴网格线
scatterPlot.GridLineStyle.ShowX = true;

// 显示 Y 轴网格线
scatterPlot.GridLineStyle.ShowY = true;

// 设置网格线颜色
scatterPlot.GridLineStyle.Color = Color.FromArgb(230, 230, 230);
属性说明
主要属性
| 属性名 | 类型 | 默认值 | 说明 |
|---|---|---|---|
| Series | List | - | 数据系列集合 |
| XAxisType | XAxisType | Numeric | X轴类型 |
| ColorType | ColorType | Primary | 色彩类型 |
| Title | string | "" | 图表标题 |
| XAxisLabel | string | "" | X轴标题 |
| YAxisLabel | string | "" | Y轴标题 |
图例属性
| 属性名 | 类型 | 默认值 | 说明 |
|---|---|---|---|
| ShowLegend | bool | true | 是否显示图例 |
| LegendPosition | LegendPosition | BottomCenter | 图例位置 |
| LegendOrientation | LegendOrientation | Horizontal | 图例排列方向 |
轴标签样式
| 属性名 | 类型 | 默认值 | 说明 |
|---|---|---|---|
| AxisLabelStyle.XAxisRotation | int | 0 | X轴标签旋转角度 |
| AxisLabelStyle.YAxisRotation | int | 0 | Y轴标签旋转角度 |
| AxisLabelStyle.FontSize | float | 9 | 标签字体大小 |
| AxisLabelStyle.Color | Color | Gray | 标签颜色 |
网格线样式
| 属性名 | 类型 | 默认值 | 说明 |
|---|---|---|---|
| GridLineStyle.ShowX | bool | true | 是否显示X轴网格线 |
| GridLineStyle.ShowY | bool | true | 是否显示Y轴网格线 |
| GridLineStyle.Color | Color | LightGray | 网格线颜色 |
| GridLineStyle.Width | int | 1 | 网格线宽度 |
事件
PointClicked
数据点点击事件,可用于显示详细信息:
csharp
scatterPlot.PointClicked += (sender, args) =>
{
    string xValue;
    if (scatterPlot.XAxisType == XAxisType.DateTime)
    {
        xValue = new DateTime((long)args.Point.X).ToString("MM-dd HH:mm");
    }
    else
    {
        xValue = args.Point.X.ToString();
    }

    MessageBox.Show($"系列: {args.Series.Name}\nX: {xValue}\nY: {args.Point.Y:F2}");
};
完整示例
24小时温度变化
csharp
var scatterPlot = new ScatterPlot
{
    Dock = DockStyle.Fill,
    Title = "24小时温度变化",
    XAxisLabel = "时间",
    YAxisLabel = "温度 (°C)",
    XAxisType = XAxisType.DateTime,
    ShowLegend = true,
    LegendPosition = LegendPosition.BottomCenter
};

// 今日温度
var todaySeries = new ScatterSeries
{
    Name = "今日温度",
    LegendText = "今日",
    ShowLine = true,
    ShowMarkers = true,
    Smooth = true,
    SmoothTension = 0.4f,
    LineWidth = 2
};

DateTime today = DateTime.Now.Date;
todaySeries.Add(today.AddHours(0), 18);
todaySeries.Add(today.AddHours(2), 17);
todaySeries.Add(today.AddHours(4), 16);
todaySeries.Add(today.AddHours(6), 17);
todaySeries.Add(today.AddHours(8), 20);
todaySeries.Add(today.AddHours(10), 24);
todaySeries.Add(today.AddHours(12), 28);
todaySeries.Add(today.AddHours(14), 30);
todaySeries.Add(today.AddHours(16), 29);
todaySeries.Add(today.AddHours(18), 26);
todaySeries.Add(today.AddHours(20), 23);
todaySeries.Add(today.AddHours(22), 20);
todaySeries.Add(today.AddHours(24), 19);

scatterPlot.AddSeries(todaySeries);
scatterPlot.RefreshPlot();
this.Controls.Add(scatterPlot);
多日期温度对比
csharp
var scatterPlot = new ScatterPlot
{
    Dock = DockStyle.Fill,
    Title = "温度趋势图",
    XAxisLabel = "日期",
    YAxisLabel = "温度 (°C)",
    XAxisType = XAxisType.DateTime,
    ShowLegend = true,
    LegendPosition = LegendPosition.TopRight
};

// 本周温度
var series1 = new ScatterSeries
{
    Name = "本周温度",
    LegendText = "本周",
    ShowLine = true,
    ShowMarkers = true,
    Smooth = true,
    LineWidth = 2
};

// 添加7天数据
for (int i = -6; i <= 0; i++)
{
    series1.Add(DateTime.Now.AddDays(i).Date, 20 + Math.Sin(i * 0.5) * 5);
}

scatterPlot.AddSeries(series1);
scatterPlot.RefreshPlot();
注意事项
- 日期时间数据 :使用
DateTime.ToOADate()或DateTime.Ticks转换为数值存储 - 刷新图表 :修改数据后调用
RefreshPlot()重新绘制 - 平滑曲线 :设置
Smooth = true并可通过SmoothTension调整平滑度(0-1之间) - 图例绘制:图例始终在最上层显示,不会被网格线遮挡
- 轴标题 :设置
XAxisLabel或YAxisLabel会自动预留空间,避免与轴标签重叠
三、后记
陆续补充完善中,敬请关注,如有需求,有好的建议,请留言(xue5zhijing)