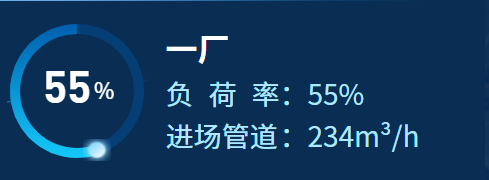
echarts环形图自定义,光圈是图片自定义在终点
c
  getCXQCharts(valNum, chartId, colorType) {
      const imgUrl =
        colorType === "red"
          ? require("@/assets/images/chrat_icon1.png")
          : require("@/assets/images/chrat_icon.png");
      this[chartId] = this.$echarts.init(document.getElementById(chartId));
      let color1 = colorType === "red" ? "#ae9600" : "#005fae";
      let color2 = colorType === "red" ? "#faa81b" : "#14c9fa";
      let color3 = colorType === "red" ? "#756b05" : "#053d75";

      let option = {
        title: {
          text: "{a|" + valNum + "}{b|%}",
          x: "center",
          y: "center",
          textStyle: {
            rich: {
              a: {
                fontSize: 44,
                fontWeight: "bold",
                color: "#fff",
                fontFamily: "DINPro",
              },
              b: {
                fontSize: 22,
                color: "#fff",
                fontFamily: "Source Han Sans CN",
              },
            },
          },
        },
        series: [
          {
            type: "pie",
            clockWise: false,
            radius: [57, 67], // 缩小饼图预留空间
            startAngle: 90,
            hoverAnimation: false,
            center: ["50%", "50%"],
            data: [
              {
                value: valNum,
                itemStyle: {
                  normal: {
                    color: new this.$echarts.graphic.LinearGradient(
                      0,
                      0,
                      0,
                      1,
                      [
                        { offset: 0, color: color1 },
                        { offset: 1, color: color2 },
                      ]
                    ),
                  },
                },
              },
              {
                //画中间的图标
                name: "",
                value: 0,
                offset: [-8, -18], // [-8向左偏移, -8向上偏移]
                label: {
                  position: "inside",
                  backgroundColor: {
                    image: imgUrl,
                  },
                  width: 28,
                  height: 28,

                },
              },
              {
                value: 100 - valNum,
                name: "invisible",
                itemStyle: {
                  normal: { color: color3 },
                  emphasis: { color: color3 },
                },
              },
            ],
          },
        ],
      };

      this[chartId].setOption(option, true);
    }