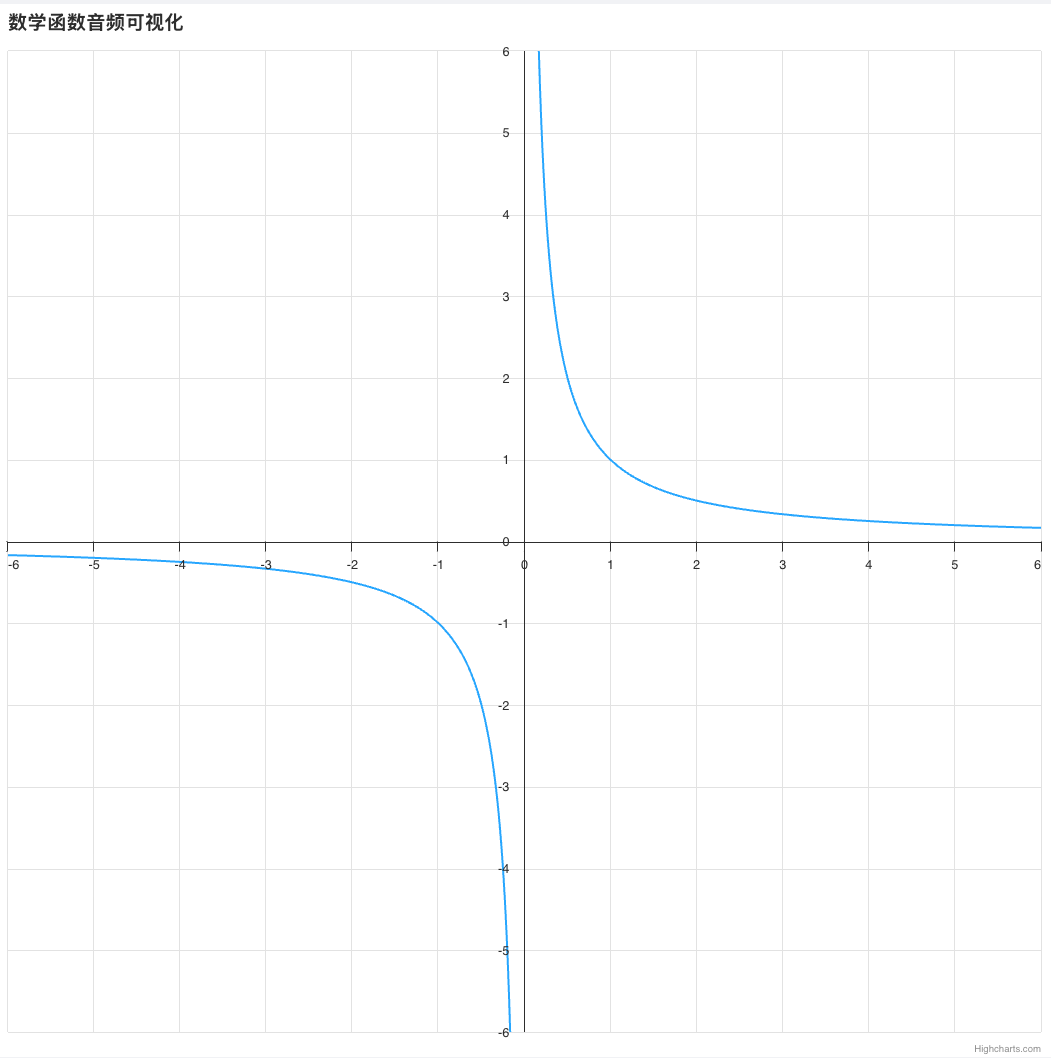
制作一个简单的演示,展示了如何通过音线进行音化。在这种情况下,我们对方程 y = 1 / x 进行了音化。该图在 x=0 处有一个垂直渐近线,y=0 处有一个水平渐近线,形成了一个双曲形状,函数接近但从不接触 X 轴和 Y 轴。
完整可运行HTML代码
html
<!DOCTYPE html>
<html lang="zh-CN">
<head>
    <meta charset="UTF-8">
    <meta name="viewport" content="width=device-width, initial-scale=1.0">
    <title>数学函数音频可视化</title>
    <style>
        body { margin:0; padding:10px; height: 100vh; box-sizing:border-box; }
        #sonify {
            padding: 8px 22px;
            font-size:14px;
            background:#2f7ed8;
            color:white;
            border:none;
            border-radius:4px;
            cursor:pointer;
            margin-bottom:10px;
        }
        #container { height: calc(100% - 50px); }
    </style>
</head>
<body>

<button id="sonify">播放音频可视化</button>
<div id="container"></div>

<script src="https://code.highcharts.com/11.4.0/highcharts.js"></script>
<script src="https://code.highcharts.com/11.4.0/modules/sonification.js"></script>
<script src="https://code.highcharts.com/11.4.0/modules/accessibility.js"></script>

<script>
// 生成数据:y = 1/x 双曲线
const data = [];
for (let x = -6; x < 6; x += 0.01) {
    data.push([
        x, Math.round(x * 100) ? 1 / x : null
    ]);
}

// 创建图表
const chart = Highcharts.chart('container', {
    chart: {
        height: '100%'
    },
    title: {
        text: '数学函数音频可视化',
        align: 'left'
    },
    sonification: {
        duration: 8000,
        defaultInstrumentOptions: {
            instrument: 'basic1',
            roundToMusicalNotes: false
        }
    },
    accessibility: {
        landmarkVerbosity: 'one'
    },
    xAxis: {
        min: -6,
        max: 6,
        gridLineWidth: 1,
        tickInterval: 1,
        crossing: 0
    },
    yAxis: {
        min: -6,
        max: 6,
        tickInterval: 1,
        lineWidth: 1,
        crossing: 0,
        title: {
            text: null
        }
    },
    legend: {
        enabled: false
    },
    tooltip: {
        headerFormat: '',
        pointFormat: 'y = {point.y:.2f}'
    },
    series: [{
        data: data
    }]
});

// 修复按钮点击:强制激活音频上下文,永远不会无反应
document.getElementById('sonify').addEventListener('click', async function () {
    // 解决浏览器音频拦截
    if (window.AudioContext || window.webkitAudioContext) {
        const tempCtx = new (window.AudioContext || window.webkitAudioContext)();
        await tempCtx.resume();
    }
    chart.toggleSonify();
});
</script>

</body>
</html>
本案例对函数 y = 1/x 进行音频化处理。该图像在 x=0 处存在垂直渐近线,在 y=0 处存在水平渐近线,整体呈现双曲线形态;函数曲线无限靠近 X 轴与 Y 轴,但永远不会与坐标轴相交。
代码核心逻辑
-
数据生成 循环遍历
x取值范围-6 ~ 6,步长 0.01 密集取点;当x=0时分式无意义,手动赋值为空值断开曲线,避免程序报错,最终生成完整双曲线坐标数据集。 -
图表基础配置
- 坐标轴:设定 XY 轴取值范围均为
-6~6,开启网格线,坐标轴原点交于(0,0) - 隐藏图例,精简界面
- 悬浮提示:鼠标悬停显示精准坐标
y=数值
- 音频可视化核心配置
- 总播放时长:8 秒
- 发声乐器:基础合成音色
- 音调规则:不强制对齐标准乐理音符,完全跟随函数数值高低实时变化
功能说明
- 图表 :双曲线
y = 1/x - 音频:随着曲线高低发出连续音调(越高音越高,越低音越低)
- 按钮 :点击 播放 / 暂停