提示:本文原创作品,良心制作,干货为主,简洁清晰,一看就会
文章目录
- 前言
- 一、整体概述
-
- [1.1 实验环境](#1.1 实验环境)
- [1.2 流程概述](#1.2 流程概述)
- 二、Nginx部署
-
- [2.1 创建configmap](#2.1 创建configmap)
- [2.2 创建nginx和nginx-exporter pod](#2.2 创建nginx和nginx-exporter pod)
- [2.3 创建nginx svc](#2.3 创建nginx svc)
- 三、监控Nginx
-
- [3.1 创建servicemonitor](#3.1 创建servicemonitor)
- [3.2 grafana添加dashboard](#3.2 grafana添加dashboard)
前言
在 Kubernetes 集群运维工作中,实时掌握业务服务运行状态是保障业务稳定的核心。Nginx 作为常用的反向代理与 Web 服务组件,对其运行指标进行常态化监控至关重要。本文依托 Prometheus Operator,结合 ConfigMap、Deployment、Service 资源,完成 Nginx 服务部署与指标采集,搭建完整监控体系,全方位监测服务运行状况,助力运维人员快速排查故障
一、整体概述
1.1 实验环境
我的实验环境:
| 主机名 | ip | 作用 |
|---|---|---|
| K8s-master1 | 192.168.13.136 | k8s控制节点 |
| K8s-master2 | 192.168.13.137 | k8s控制节点 |
| K8s-master3 | 192.168.13.138 | k8s控制节点 |
| k8s-node1 | 192.168.13.139 | k8s工作节点 |
| k8s-node2 | 192.168.13.140 | k8s工作节点 |
| NFS | 192.168.13.141 | NFS服务端,提供存储 |
当前,我的高可用 Kubernetes 集群已部署完毕,Prometheus Operator 也已完成安装配置。接下来,我将开始实操,对集群内运行的 Nginx 进行监控配置
1.2 流程概述
1,通过 deployment 部署了 nginx 及其 prometheus exporter 边车容器;nginx 容器启用 stub_status 模块,exporter 通过 localhost 抓取 /status 指标
2,使用 configmap 挂载 nginx 配置
3,随后创建 clusterip 类型的 service,同时暴露 nginx 业务端口 80 和 exporter 指标端口 9113
4,创建 serviceMonitor 资源,通过标签匹配 service,prometheus operator 自动发现并开始抓取数据
5,grafana 中导入 nginx 官方仪表盘,实现了对 nginx 服务的完整监控与可视化
二、Nginx部署
2.1 创建configmap
yaml
root@k8s-master1:~# mkdir /k8s/nginx/
root@k8s-master1:~# cd /k8s/nginx/
root@k8s-master1:/k8s/nginx# vim nginx.cm.yaml
# 1. ConfigMap: Nginx 配置(包含主配置和 default.conf)
apiVersion: v1
kind: ConfigMap
metadata:
  name: nginx-conf
  namespace: default
data:
  nginx.conf: |
    # 自定义 nginx 主配置,所有临时路径指向 /tmp,日志输出到 stdout
    worker_processes  auto;

    error_log  /dev/stdout notice;
    pid        /tmp/nginx.pid;

    events {
        worker_connections  1024;
    }

    http {
        include       /etc/nginx/mime.types;
        default_type  application/octet-stream;

        log_format  main  '$remote_addr - $remote_user [$time_local] "$request" '
                          '$status $body_bytes_sent "$http_referer" '
                          '"$http_user_agent" "$http_x_forwarded_for"';

        access_log  /dev/stdout  main;

        sendfile        on;
        keepalive_timeout  65;

        # 所有临时目录指向 /tmp
        client_body_temp_path /tmp/client_temp;
        proxy_temp_path       /tmp/proxy_temp;
        fastcgi_temp_path     /tmp/fastcgi_temp;
        uwsgi_temp_path       /tmp/uwsgi_temp;
        scgi_temp_path        /tmp/scgi_temp;

        include /etc/nginx/conf.d/*.conf;
    }

  default.conf: |
    server {
      listen       80;
      server_name  localhost;

      location / {
        root   /usr/share/nginx/html;
        index  index.html index.htm;
      }

      location /status {
        stub_status on;
        access_log off;
        allow 127.0.0.1;
        deny all;
      }

      error_page   500 502 503 504  /50x.html;
      location = /50x.html {
        root   /usr/share/nginx/html;
      }
    }
yaml
root@k8s-master1:/k8s/nginx# kubectl apply -f nginx.cm.yaml2.2 创建nginx和nginx-exporter pod
yaml
root@k8s-master1:/k8s/nginx# vim nginx.pod.yaml
---
# 2. 创建 Deployment 部署 Nginx 应用
apiVersion: apps/v1
kind: Deployment
metadata:
  name: nginx-server
spec:
  selector:
    matchLabels:
      app: nginx
  replicas: 4
  strategy:
    rollingUpdate:
      maxSurge: 25%
      maxUnavailable: 0
  template:
    metadata:
      labels:
        app: nginx
      # 用于Prometheus自动发现采集指标
      annotations:
        # 开启Prometheus抓取
        prometheus.io/scrape: "true"
        # 指标端口
        prometheus.io/port: "9113"
        # 指标接口路径
        prometheus.io/path: "/metrics"
    spec:
      containers:
      # 第一个容器:Nginx主服务容器
      - name: nginx
        image: nginx:1.24.0
        ports:
        - containerPort: 80
        resources:
          requests:
            memory: 128Mi
            cpu: 100m
          limits:
            memory: 256Mi
            cpu: 500m
        volumeMounts:
        # 挂载 default.conf 到 conf.d 目录
        - name: nginxconf
          mountPath: /etc/nginx/conf.d/default.conf
          subPath: default.conf
          readOnly: true
        # 挂载 nginx.conf 主配置文件
        - name: nginxconf
          mountPath: /etc/nginx/nginx.conf
          subPath: nginx.conf
          readOnly: true
        # 挂载临时目录emptyDir,存放Nginx各类临时文件
        - name: tmp
          mountPath: /tmp
        livenessProbe:
          httpGet:
            path: /
            port: 80
          initialDelaySeconds: 10
          periodSeconds: 10
        readinessProbe:
          httpGet:
            path: /
            port: 80
          initialDelaySeconds: 5
          periodSeconds: 5
        # 容器安全上下文
        securityContext:
          # 禁止以root用户运行
          runAsNonRoot: true
          # 指定运行用户ID 101(Nginx默认普通用户)
          runAsUser: 101
          # 根文件系统只读,提升安全
          readOnlyRootFilesystem: true
      # 第二个容器:Nginx Prometheus 指标采集Exporter
      - name: nginx-exporter
        image: nginx/nginx-prometheus-exporter:1.4.0
        # 启动参数:指定抓取Nginx状态页地址
        args:
        - -nginx.scrape-uri=http://localhost/status
        ports:
        - containerPort: 9113
        resources:
          limits:
            memory: 128Mi
            cpu: 500m
        livenessProbe:
          httpGet:
            path: /metrics
            port: 9113
          initialDelaySeconds: 15
          periodSeconds: 10
        securityContext:
          runAsNonRoot: true
          runAsUser: 65534
      volumes:
      # 卷1:关联上方ConfigMap,存放Nginx配置文件
      - name: nginxconf
        configMap:
          name: nginx-conf
      # 卷2:临时空目录,Pod生命周期内有效,Pod删除数据丢失
      - name: tmp
        emptyDir: {}
yaml
root@k8s-master1:/k8s/nginx# kubectl apply -f nginx.pod.yaml2.3 创建nginx svc
yaml
root@k8s-master1:/k8s/nginx# vim nginx.svc.yaml
---
# 3. 创建 Service 暴露应用服务
apiVersion: v1
kind: Service
metadata:
  name: nginx-server-svc
  namespace: default
  labels:
    app: nginx
  # Prometheus 自动发现注解
  annotations:
    prometheus.io/scrape: "true"
    prometheus.io/port: "9113"
spec:
  selector:
    app: nginx
  ports:
    # 业务HTTP端口
    - name: http
      port: 80
      targetPort: 80
      protocol: TCP
    # 监控指标端口
    - name: metrics
      port: 9113
      targetPort: 9113
      protocol: TCP
  type: ClusterIP
yaml
root@k8s-master1:/k8s/nginx# kubectl apply -f nginx.svc.yaml
root@k8s-master1:/k8s/nginx# kubectl get pod
NAME                            READY   STATUS    RESTARTS      AGE
nginx-server-7987759647-9qrl5   2/2     Running   0             11s
nginx-server-7987759647-q4d4r   2/2     Running   0             11s
nginx-server-7987759647-wj27w   2/2     Running   0             11s
nginx-server-7987759647-x5mxr   2/2     Running   0             11s
root@k8s-master1:~/kube-prometheus/manifests# kubectl get svc | grep nginx
NAME               TYPE        CLUSTER-IP      EXTERNAL-IP   PORT(S)              AGE
nginx-server-svc   ClusterIP   10.109.33.108   <none>        80/TCP,9113/TCP      4m3s
root@k8s-master1:~/kube-prometheus/manifests# curl 10.109.33.108:9113/metrics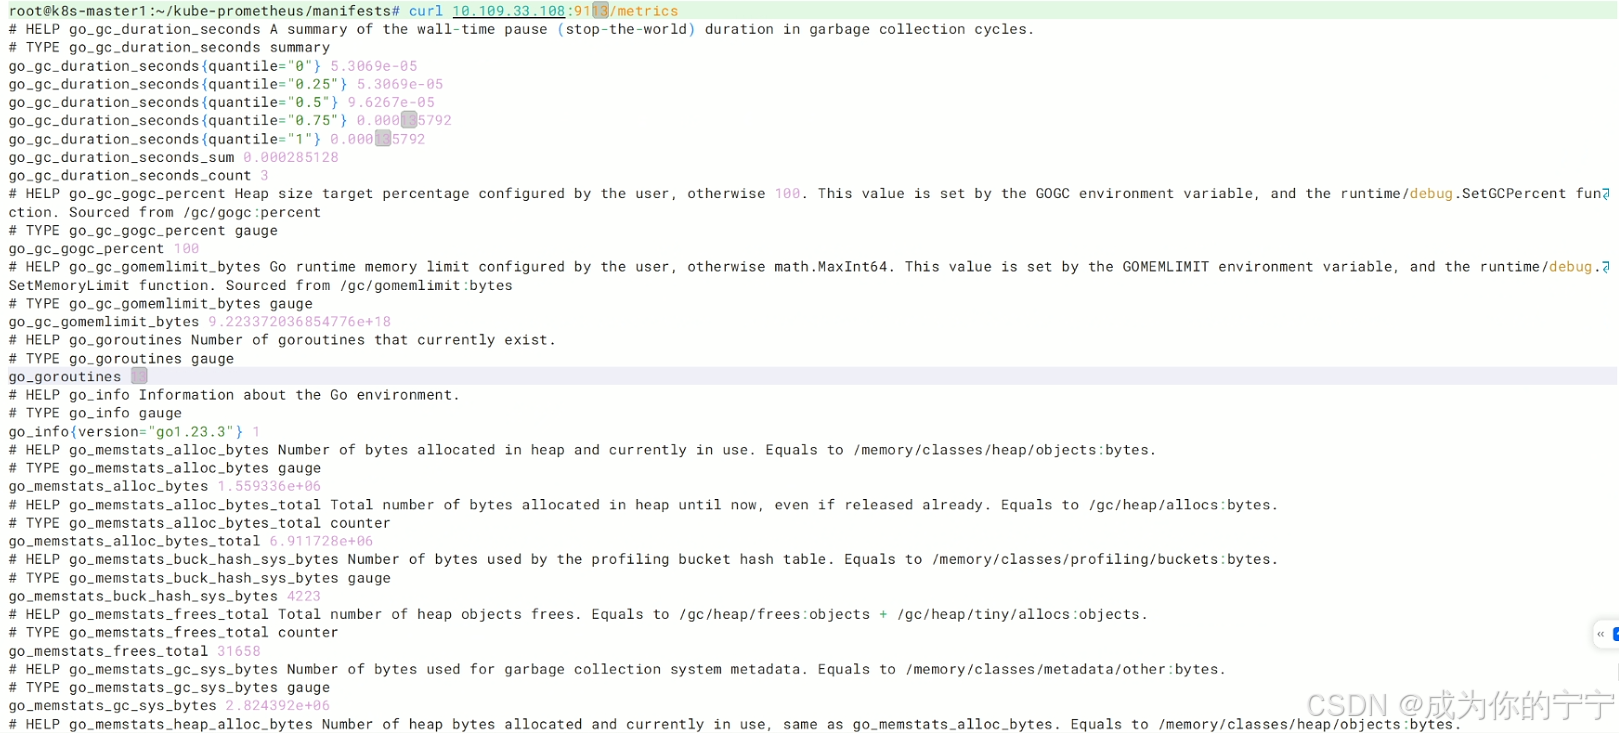
三、监控Nginx
3.1 创建servicemonitor
yaml
root@k8s-master1:/k8s/nginx# cd /root/kube-prometheus/manifests/
root@k8s-master1:~/kube-prometheus/manifests# vim nginx-servicemonitor.yaml
---
apiVersion: monitoring.coreos.com/v1
kind: ServiceMonitor
metadata:
name: nginx-exporter # sericemonitor的名称
namespace: monitoring # 命名空间
labels:
k8sapp: nginx-exporter # servicemonitor的标签
namespace: monitoring
spec:
jobLabel: k8s-app
endpoints:
- port: metrics # service的端口号
interval: 30s # 检测间隔
scheme: http # 使用的协议
path: /metrics
selector:
matchLabels:
app: nginx # nginx-exporter的service的标签
namespaceSelector: # 命名空间标签,需和service的命名空间一致
matchNames:
- default
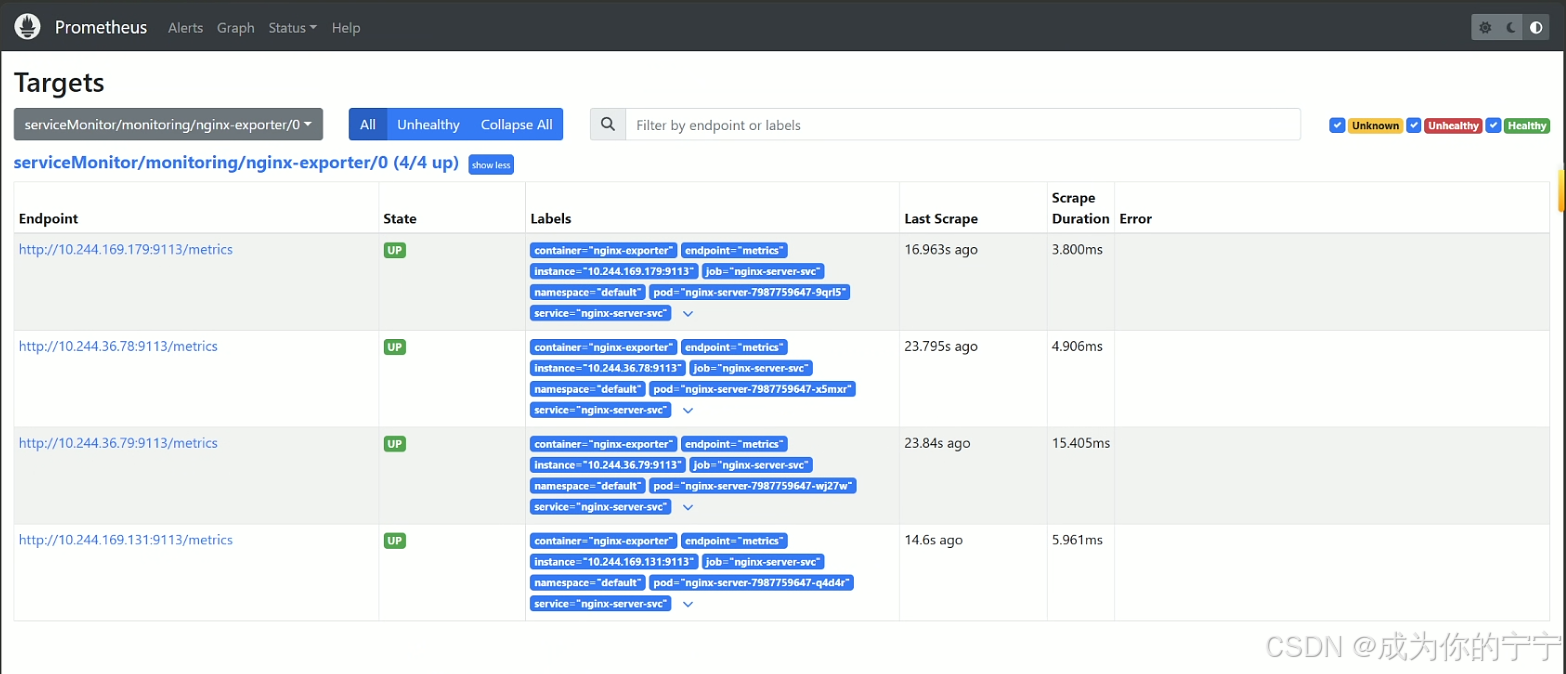
root@k8s-master1:~/kube-prometheus/manifests# kubectl apply -f nginx-servicemonitor.yaml 浏览器登录Prometheus页面,可以看到nginx的实例已经被添加
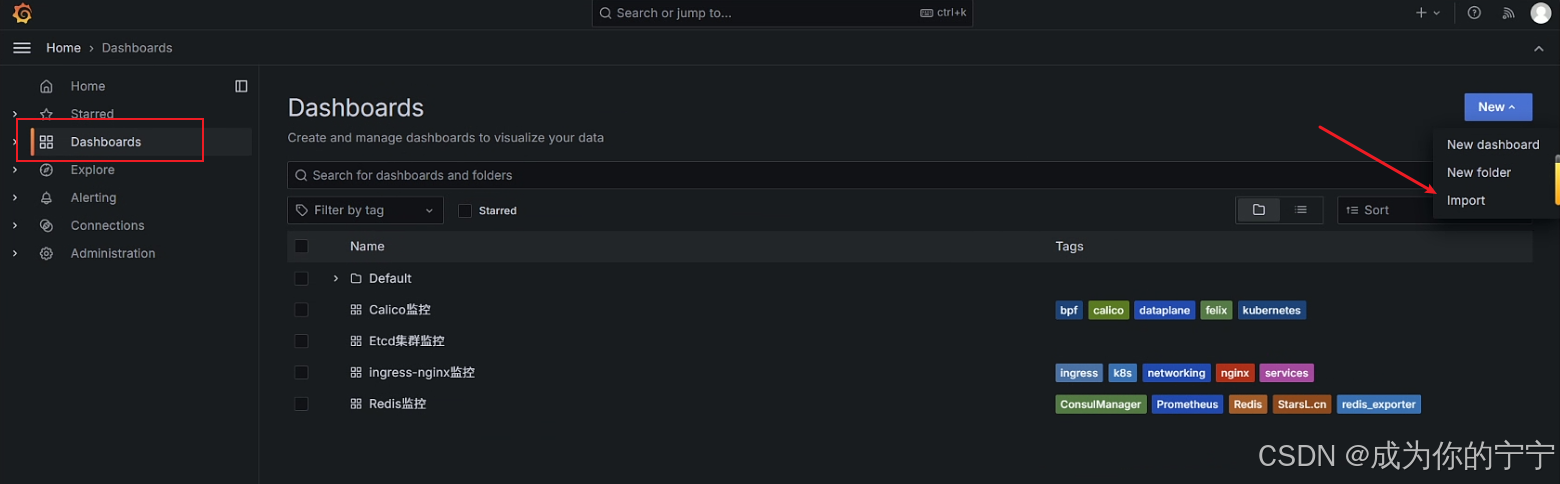
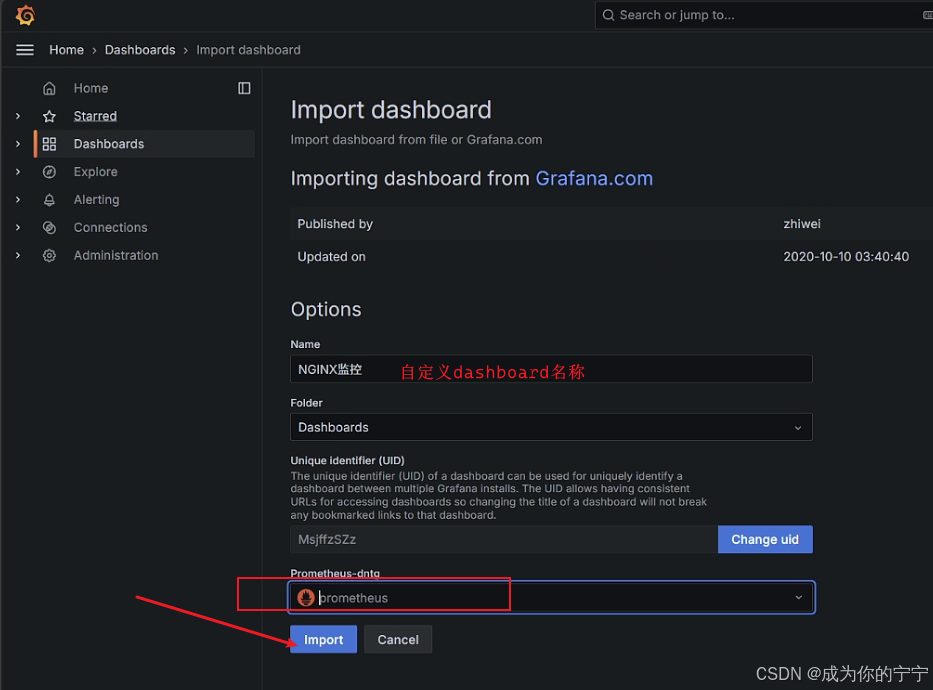
3.2 grafana添加dashboard
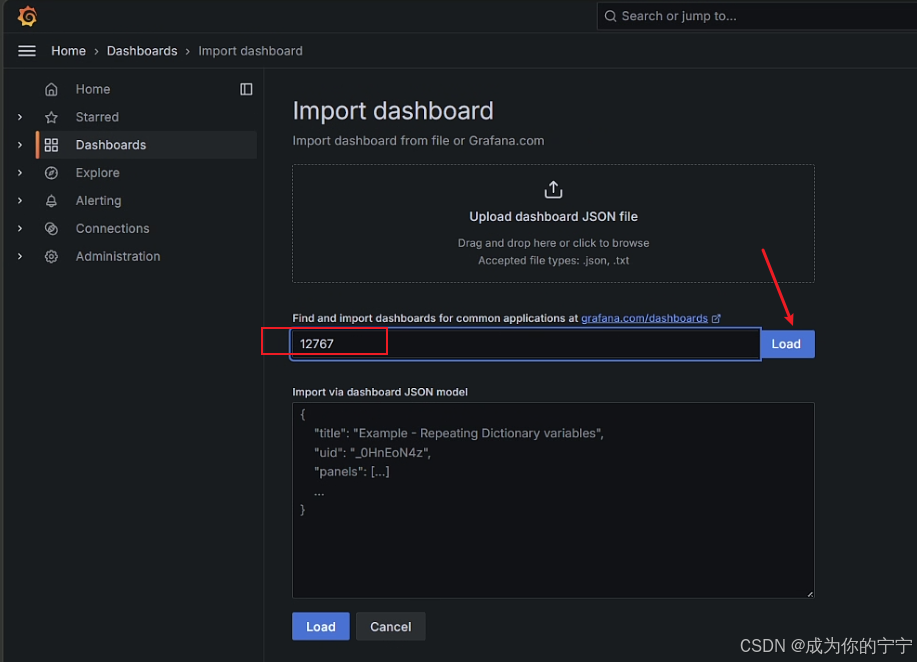
登录grafana,我们可以给nginx添加适合的dashboard
我选择的dashboard:https://grafana.com/grafana/dashboards/12767-nginx/
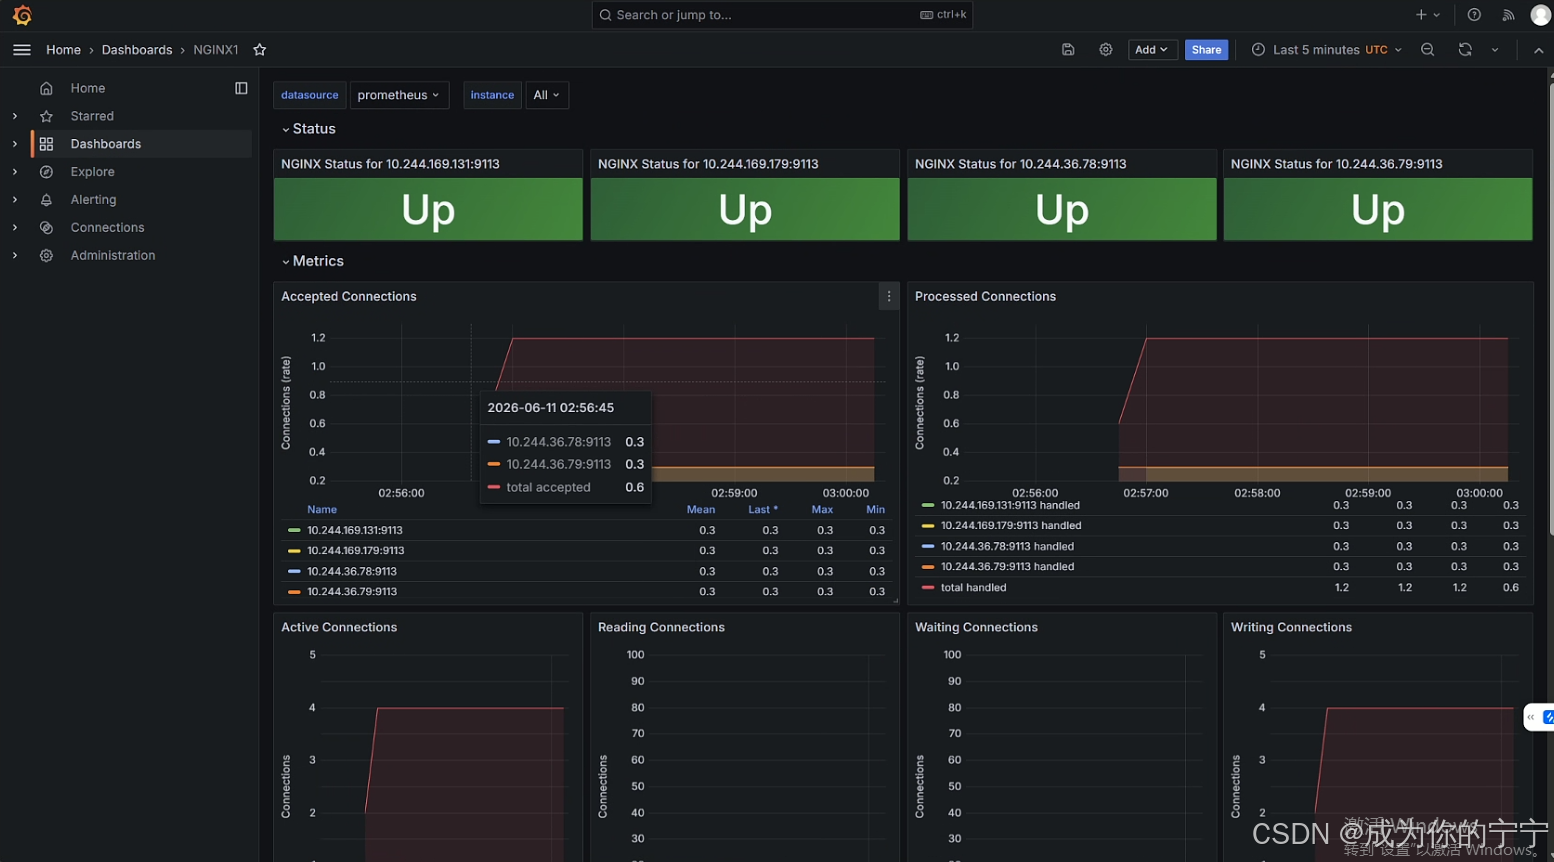
如上配置,完成了 Prometheus Operator 对 K8s Nginx 服务的监控搭建!
注:
文中若有疏漏,欢迎大家指正赐教。
本文为100%原创,转载请务必标注原创作者,尊重劳动成果。
求赞、求关注、求评论!你的支持是我更新的最大动力,评论区等你~