[二、Four Steps of Creating a Report in Power BI Desktop / Power BI Desktop 创建报告四步流程](#二、Four Steps of Creating a Report in Power BI Desktop / Power BI Desktop 创建报告四步流程)
[(一)Step 1: Connect with Data Sources / 连接数据源](#(一)Step 1: Connect with Data Sources / 连接数据源)
[1. Description / 描述](#1. Description / 描述)
[2. Process / 操作过程](#2. Process / 操作过程)
[(二)Step 2: Transform Data & Create Models / 转换数据并创建模型](#(二)Step 2: Transform Data & Create Models / 转换数据并创建模型)
[1. Tool Used / 使用工具](#1. Tool Used / 使用工具)
[2. Actions Performed / 执行操作](#2. Actions Performed / 执行操作)
[3. Analogy / 形象比喻](#3. Analogy / 形象比喻)
[4. Advantage Over Other Tools / 对比优势](#4. Advantage Over Other Tools / 对比优势)
[3. Apply all slicers button / 应用所有切片器按钮](#3. Apply all slicers button / 应用所有切片器按钮)
[六、Copilot in Power BI Mobile Apps (Preview) / Power BI 移动应用中的 Copilot(预览版)](#六、Copilot in Power BI Mobile Apps (Preview) / Power BI 移动应用中的 Copilot(预览版))
[1. Definition / 定义](#1. Definition / 定义)
[2. Functionality / 功能](#2. Functionality / 功能)
[3. Goal / 目标](#3. Goal / 目标)
前言
This revision guide consolidates key concepts from Chapter 2 of your Power BI course, covering the report creation process, core building blocks, essential components, and key interface features. Designed for exam preparation, it presents content in a structured, bilingual format for quick review and retention.
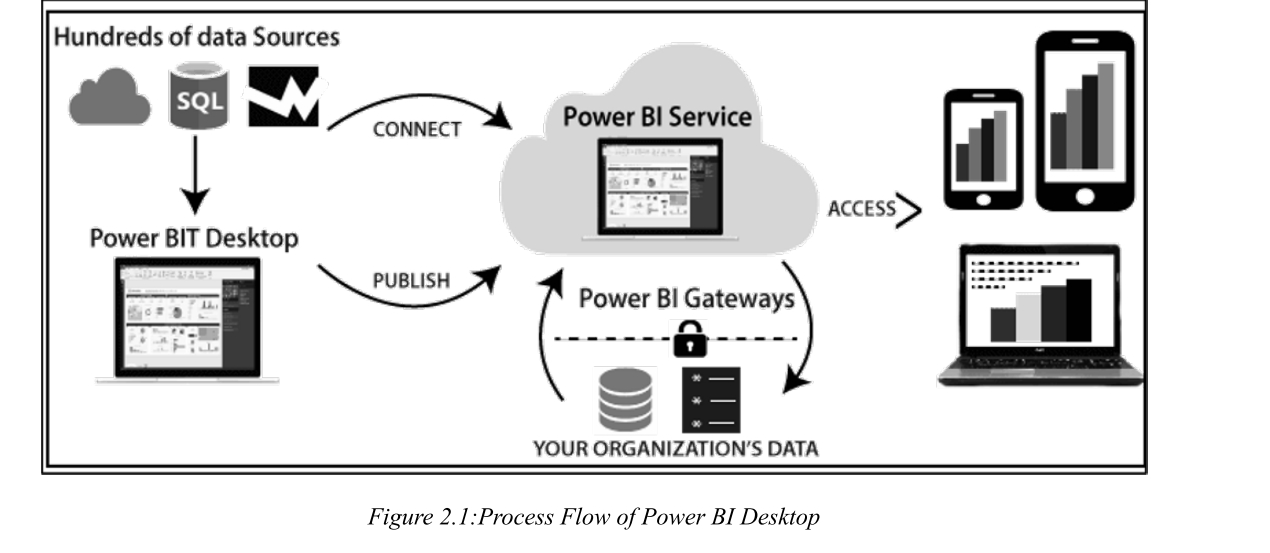
Microsoft Power BI is a business intelligence and data visualization tool developed by Microsoft. It allows users to connect to various data sources, transform raw data into meaningful insights, and create visually appealing reports and dashboards. It is widely used for data analysis, reporting, and sharing insights across organizations.
Microsoft Power BI 是微软开发的商业智能与数据可视化工具。它允许用户连接多种数据源,将原始数据转化为有意义的见解,并创建视觉效果出色的报告和仪表板。它广泛应用于数据分析、报告编制以及组织内见解共享。
2. Key Characteristics / 核心特点
Collection of services: Power BI is a collection of software services, apps, and connectors that work together to turn your unrelated sources of data into coherent insights.
集成服务集合:Power BI 是软件服务、应用和连接器的集合,协同工作,将分散的数据源转化为连贯的洞察。
Power BI Desktop: A free application you install on the local computer that lets you connect to, transform, and visualize your data.
Power BI Desktop:安装在本地计算机上的免费应用程序,用于连接、转换和可视化数据。
3.PowerBI Desktop
Power BI Desktop bridges the gap between data and decision-making in the following way:
Power BI Desktop通过以下方式弥合数据和决策之间的鸿沟:
Create amazing data experiences: Easily connect to, model, and visualize your data, creating memorable reports personalized with your KPIs and brand. Get fast, AI-powered answers to your business questions---even when asking with conversational language.
Gain insight from your largest BI deployments: Make the most of your big data investments by connecting to all your data sources with the scale to analyze, share, and promote insights across your organization while maintaining data accuracy, consistency, and security.
Make decisions with confidence: Work together easily on the same data, collaborate on reports, and share insights across popular Microsoft Office applications such as Microsoft Teams and Excel. Empower everyone in your organization to quickly make data-driven decisions that drive strategic actions.
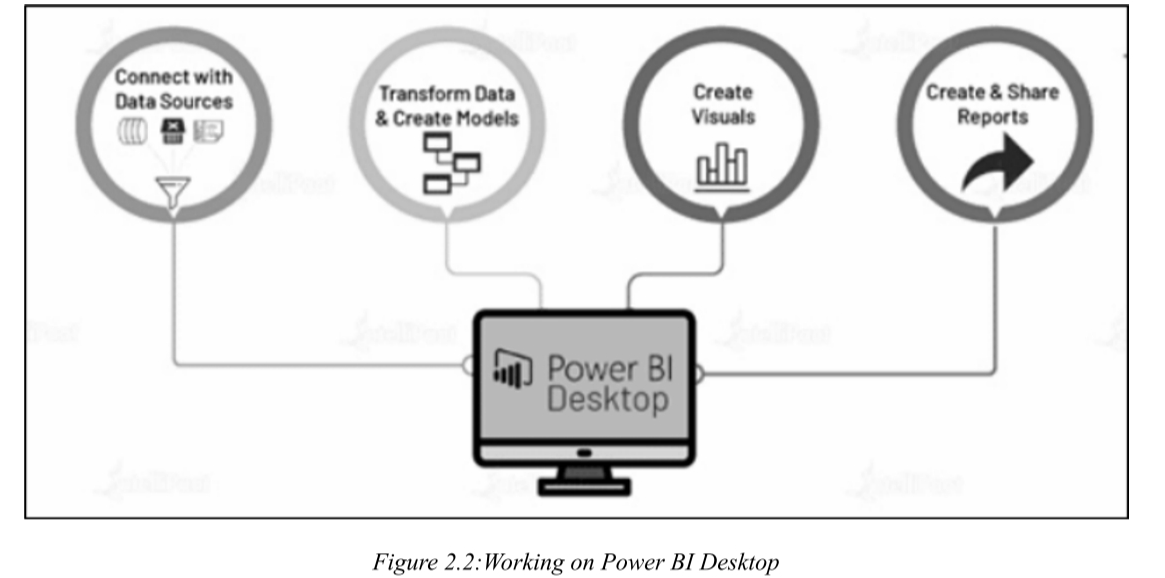
二、Four Steps of Creating a Report in Power BI Desktop / Power BI Desktop 创建报告四步流程
核心考点:按顺序记忆四步流程名称及其核心动作
(一)Step 1: Connect with Data Sources / 连接数据源
1. Description / 描述
Power BI Desktop allows users to connect to various data sources, such as Excel spreadsheets, CSV files, Q-data feeds, online services, and cloud-based data.
Power BI Desktop 允许用户连接到各种数据源,例如 Excel 电子表格、CSV 文件、Q-data 源、在线服务和云端数据。
2. Process / 操作过程
Import data from structured, semi-structured, or unstructured sources based on business requirements.
根据业务需求,从结构化、半结构化或非结构化源导入数据。
After importing, proceed with data transformation and filtering.
导入后,进行数据转换和筛选。
(二)Step 2: Transform Data & Create Models / 转换数据并创建模型
1. Tool Used / 使用工具
Use Power Query Editor to prepare and refine the data for analysis.
使用 Power Query 编辑器 准备和精炼数据以进行分析。
2. Actions Performed / 执行操作
Extract valuable insights, remove anomalies, and apply conditions for better data comprehension.
提取有价值的见解,删除异常值,并应用条件以便更好地理解数据。
Perform operations like changing columns, modifying data types, and adding default values to handle nulls.
执行更改列、修改数据类型以及为空值添加默认值等操作。
3. Analogy / 形象比喻
This stage is akin to sculpting a block of wood by cutting the edges, removing extra wood, shaving off projections, and adding other ingredients to make it look as intended.
此阶段类似于雕刻一块木头:切割边缘、去除多余部分、削去突出物,并添加其他元素,使其达到预期形态。
4. Advantage Over Other Tools / 对比优势
If you do Business Analytics on Tableau, the transformation of data would be exhausting. However, Power BI components convert it into a drag-n-drop play for data modelling.
如果在 Tableau 上进行商业分析,数据转换会非常繁琐。但 Power BI 组件将其转化为用于数据建模的拖拽式操作。
(三)Step 3: Create Visuals / 创建可视化
1. Definition / 定义
Visuals are the graphical representations of the data stored in a model.
可视化是数据模型中存储数据的图形化表示。
2. Features / 功能
Drag-and-drop capabilities to create charts, graphs, maps, KPIs, etc.
拖拽功能创建图表、图形、地图、KPI 等。
Attach visuals to dashboards or live reports as tiles for organized insights.
将可视化作为磁贴附加到仪表板或实时报告中,以组织见解。
Custom visuals help identify problems in various departments and market behavior, enabling better decision-making.
自定义可视化有助于识别各部门和市场行为中的问题,从而做出更好的决策。
(四)Step 4: Create & Share Reports / 创建和共享报告
1. Definition / 定义
A report in Power BI Desktop is a collection of visuals based on different data models.
Power BI Desktop 中的报告是基于不同数据模型的可视化集合。
2. Types of Reports / 报告类型
Static Reports: Contain pre-defined visuals and summaries.
静态报告:包含预定义的可视化和摘要。
Live Reports: Provide real-time data analysis, streaming in from various sources.
实时报告:提供实时数据分析,从各种来源流式传输数据。
3. Sharing / 共享
Reports can be shared across teams and stakeholders to foster collaboration and informed decision-making.
报告可以在团队和利益相关者之间共享,以促进协作和明智决策。
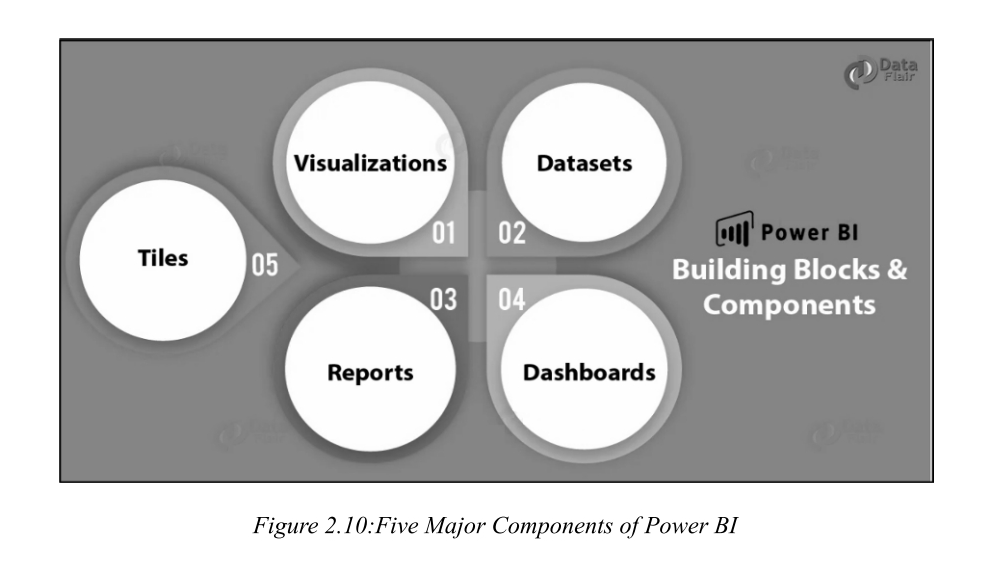
三、Building Blocks of Power BI / Power BI 五大构建块
核心考点:区分五个模块的定义、用途和关键差异(考选择题/匹配题)
The fundamental Power BI building block are:
Visualizations
Datasets
Reports
Dashboards
Tiles
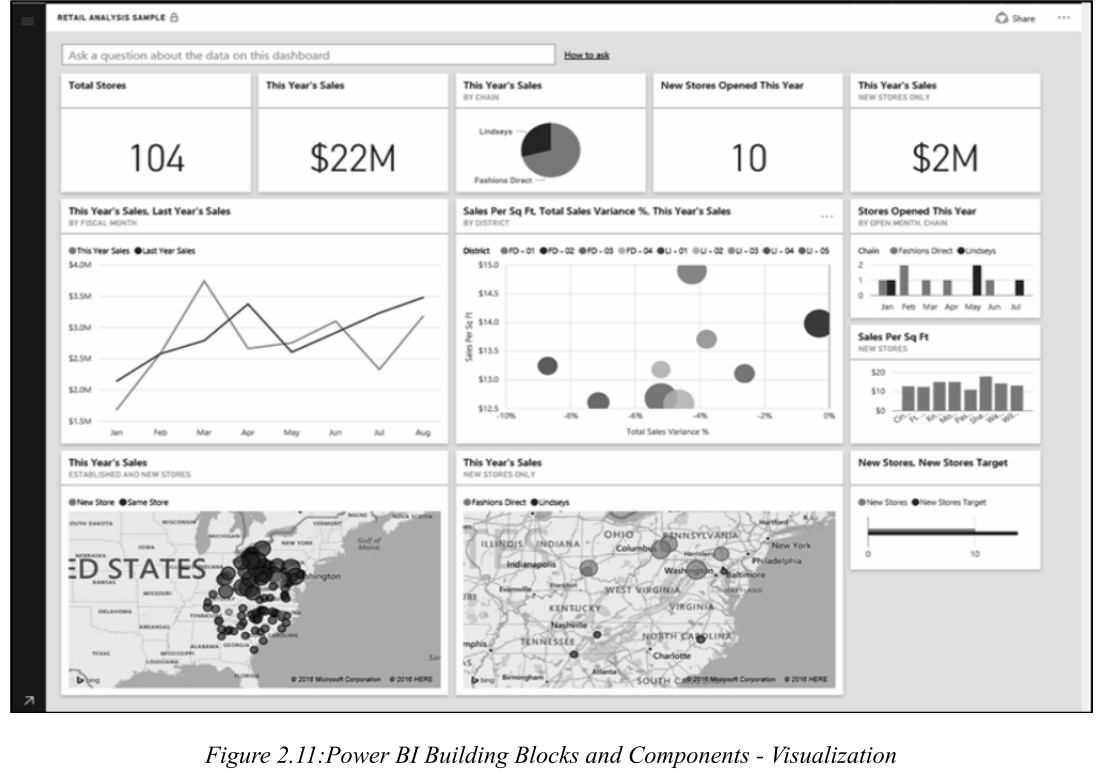
(一)Visualizations / 可视化
1. Definition / 定义
Visualization is a visual representation of data
Graphical representations of data, such as charts, graphs, maps, or KPIs.
数据的图形化表示,如图表、图形、地图或 KPI。
2. Purpose / 目的
Helps users interpret complex data by displaying it in an easily understandable format.
通过以易于理解的格式显示数据,帮助用户解释复杂数据。
3. Examples / 示例
Bar Chart / 条形图
Line Graph / 折线图
Pie Chart / 饼图
Heat Map / 热力图
Tree Map / 树状图
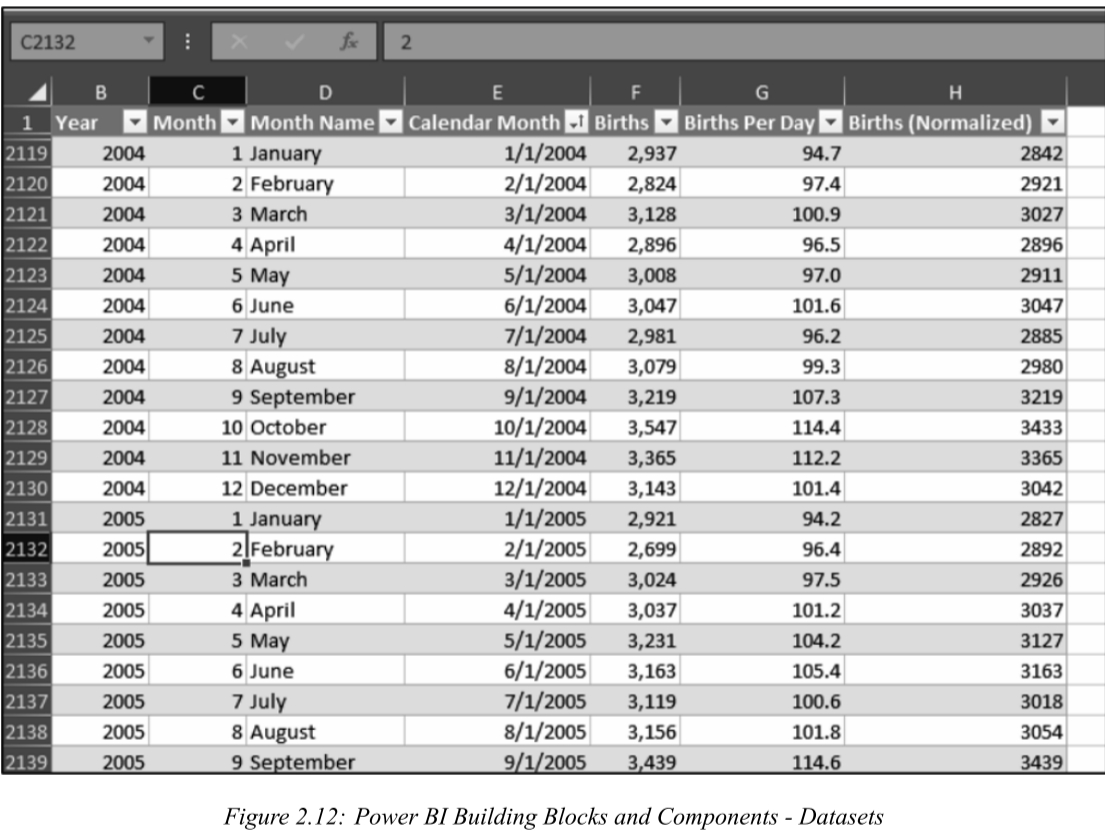
(二)Datasets / 数据集
1. Definition / 定义
A collection of data imported or connected to Power BI from various sources. It is the foundation for building reports and visualizations.
从各种源导入或连接到 Power BI 的数据集合。它是构建报告和可视化的基础。
2. Data Sources / 数据来源
Dataset is a collection of data that Power BI uses to create its visualizations,数据集是Power BI用来创建其可视化效果的数据集合
Data from Excel files, SQL databases, or cloud services like Azure.
来自 Excel 文件、SQL 数据库或 Azure 等云服务的数据。
Real-time datasets streamed via APIs or Azure Stream Analytics.
通过 API 或 Azure 流分析传输的实时数据集。
3. Key Property / 关键属性
Datasets can be a blend of a wide range of sources, which you can filter and consolidate to give a unique collection of data for use in Power BI.
数据集可以是各种来源的混合体,您可以对其进行筛选和合并,以形成用于 Power BI 的独特数据集合。
(三)Reports / 报告
"The report is a collection of visualizations that appear together on one or more pages" .
报告是一起出现在一个或多个页面上的可视化的集合"。
1. Definition / 定义
A multi-page canvas containing visualizations based on a dataset . A collection of interactive visualizations and insights derived from a dataset, often spanning multiple pages.
一个包含基于数据集的可视化的多页画布。它是从数据集衍生的交互式可视化和见解的集合,通常跨越多页。
2. Purpose / 目的
Allows users to analyze and present data insights in a structured format.
允许用户以结构化格式分析和呈现数据见解。
3. Features / 特性
Can include multiple types of visuals.
可包含多种类型的可视化。
Interactive with features like filters, drill-through, and slicers.
具有筛选器、钻取和切片器等功能,支持交互。
4. Simple Explanation / 通俗理解
A report is a gathering of perceptions that appear together on one or more pages. Much like any other report you may make for a business introduction, or a report you would write for a school assignment, in Power BI a report is a collection of things that relate to each other.
报告是一个或多个页面上一起出现的可视化集合。就像你为商业演示或学校作业制作的任何其他报告一样,在 Power BI 中,报告是相互关联的项目的集合。
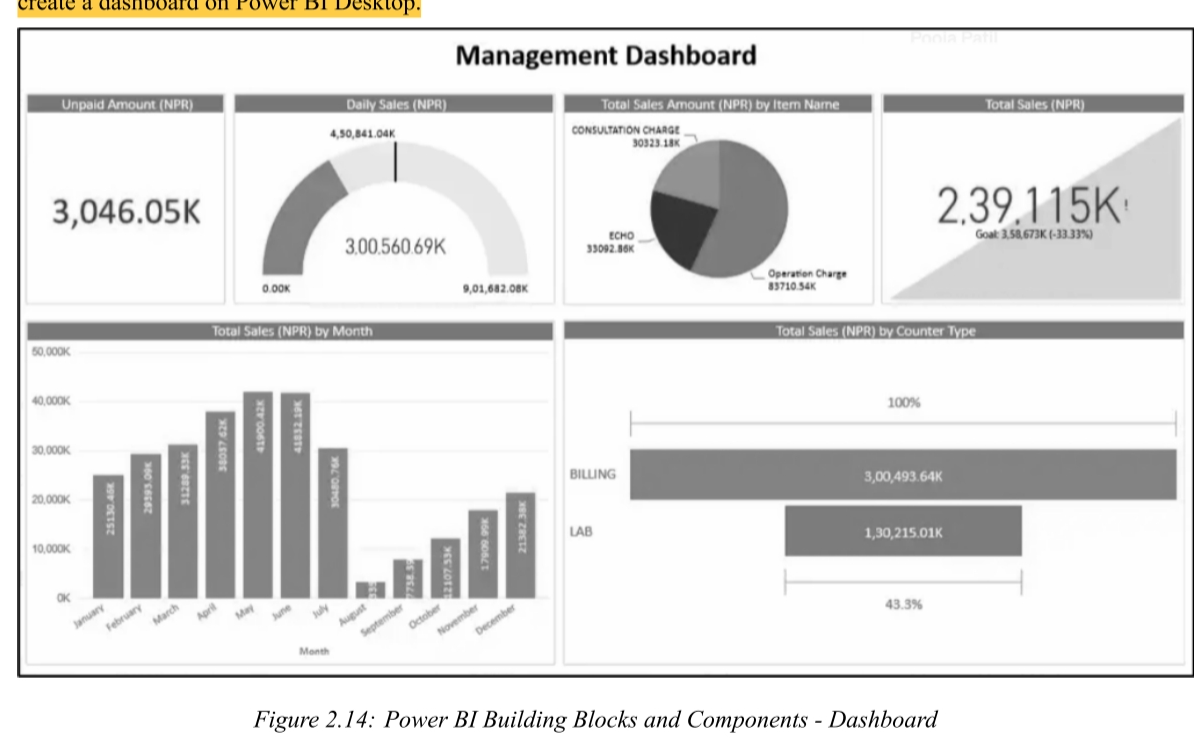
(四)Dashboards / 仪表板
仪表板是多个可视化的单层表示。也就是说,我们可以将一个或多个可视化内容集成到一个一页的层中
The dashboard is a single-layer presentation of multiple visualizations. i.e we can integrate one or more visualizations into a one-page layer
1. Definition / 定义
A single-page , consolidated view of visualizations (tiles ), created from one or more reports. Provides a high-level overview for monitoring key metrics and KPIs.
Visualizations on a dashboard are generated from reports, and each report is based on one dataset.
仪表板上的可视化来自报告,而每个报告基于一个数据集。
Limited interactivity; clicking on a tile typically navigates to the underlying report or dataset.
交互性有限;点击磁贴通常会导航到基础报告或数据集。
Cannot create a dashboard on Power BI Desktop (only in Power BI Service).
无法在 Power BI Desktop 上创建仪表板(仅在 Power BI Service 中可用)。
3. Advantages / 优势
Enables users to analyze reports and view all important metrics at a glance.
使用户能够分析报告并一目了然地查看所有重要指标。
Can create visualizations from multiple datasets or multiple reports.
可以从多个数据集 或多个报告创建可视化。
Can be customized and embedded into applications for a unified user experience.
可定制并嵌入到应用程序中,提供统一的用户体验。
4. Simple Explanation / 通俗理解
The dashboard is a single-layer presentation of multiple visualizations
we can integrate one or more visualizations into a one-page layer.
仪表板是多个可视化的单层呈现------我们可以将一个或多个可视化集成到一个单页层中。
Report vs. Dashboard 核心对比表
对比维度
Report(报告)
Dashboard(仪表板)
定义
基于一个数据集的多页可视化集合,用于深入分析
单页画布,汇集多个磁贴(tiles),用于高层监控
页面数
多页(可添加多个页面)
单页(仅一页)
交互性
完全交互(筛选、钻取、切片器、书签等)
有限交互(点击磁贴跳转到源报告)
数据源基础
每个报告基于 单个数据集
可整合 多个数据集或报告 的磁贴
主要用途
深度数据探索、详细分析、制作分析故事
快速监控 KPI、实时状态概览、决策支持
创建位置
可在 Power BI Desktop 和 Power BI Service 中创建
仅在 Power BI Service 中创建(Desktop 不支持)
实时更新
支持手动或计划刷新
支持实时自动刷新(流数据集)
共享协作
可发布并共享,支持协作编辑
可直接共享,协作能力较弱(主要供查看)
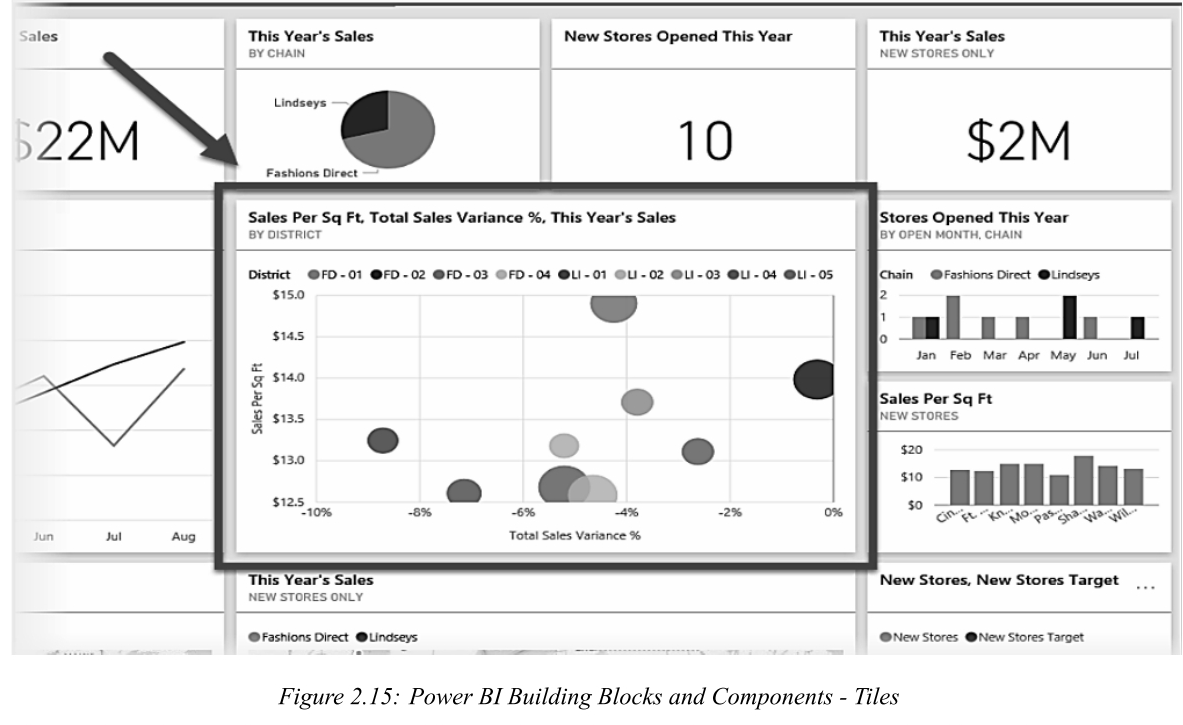
(五)Tiles / 磁贴
1. Definition / 定义
Individual visualizations or widgets pinned to a dashboard. A tile is a snapshot of your data, pinned to the dashboard.
固定在仪表板上的单个可视化或小组件。磁贴是固定在仪表板上的数据快照。
2. Purpose / 目的
Represents a specific metric or insight, such as a chart, KPI, or image.
表示特定的指标或见解,例如图表、KPI 或图像。
3. Key Property / 关键属性
A tile is a single visualization found in a report or on a dashboard. It's the rectangular box that contains each individual visual.
磁贴是报告或仪表板中的单个可视化。它是包含每个单独可视化的矩形框。
You can move or organize tiles any way you want.
您可以随意移动或组织磁贴。
(六)Key Differences at a Glance / 核心差异速查表
Aspect / 方面
Dashboard / 仪表板
Tile / 磁贴
Report / 报告
Scope / 范围
High-level summary / 高层摘要
Individual visual / 单个可视化
Detailed insights / 详细见解
Pages / 页数
Single-page / 单页
Not applicable / 不适用
Multi-page / 多页
Interactivity / 交互性
Limited / 有限
Limited / 有限
Fully interactive / 完全交互
Source / 来源
Can combine multiple datasets/reports / 可组合多个数据集/报告
Visuals from a report or dataset / 来自报告或数据集的可视化
Based on a single dataset / 基于单个数据集
Use Case / 用途
Quick monitoring of KPIs / 快速监控 KPI
Representation of one metric / 单一指标表示
In-depth exploration / 深度探索
四、Power BI Components / Power BI 核心组件
核心考点:区分 Power Query、Power Pivot、Power View、Power Map 各自的用途和特点
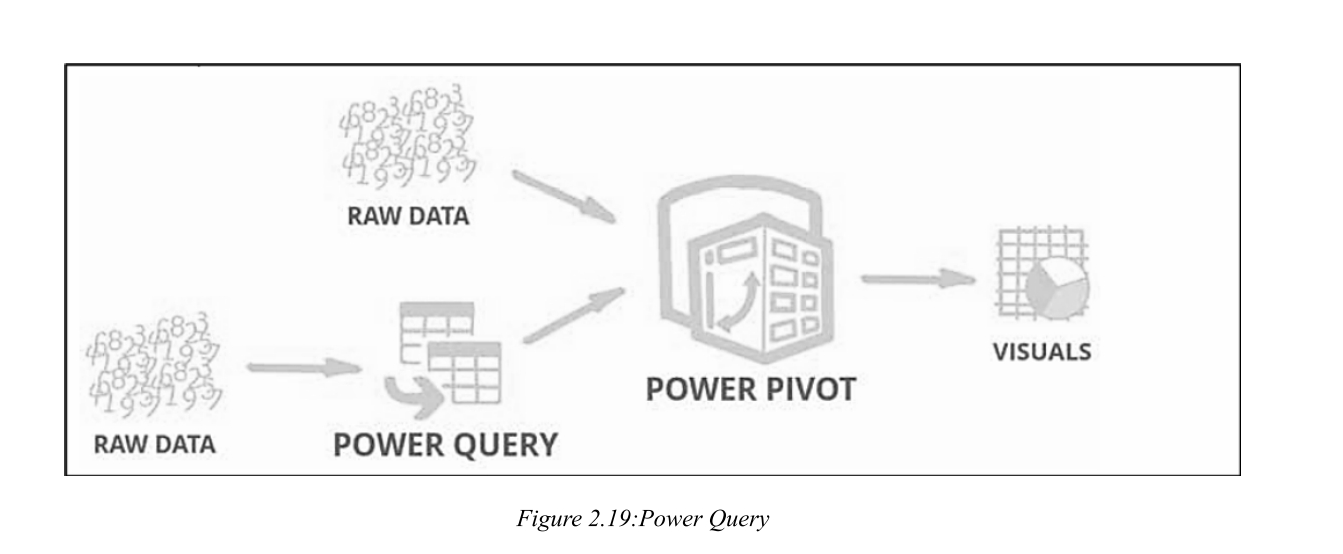
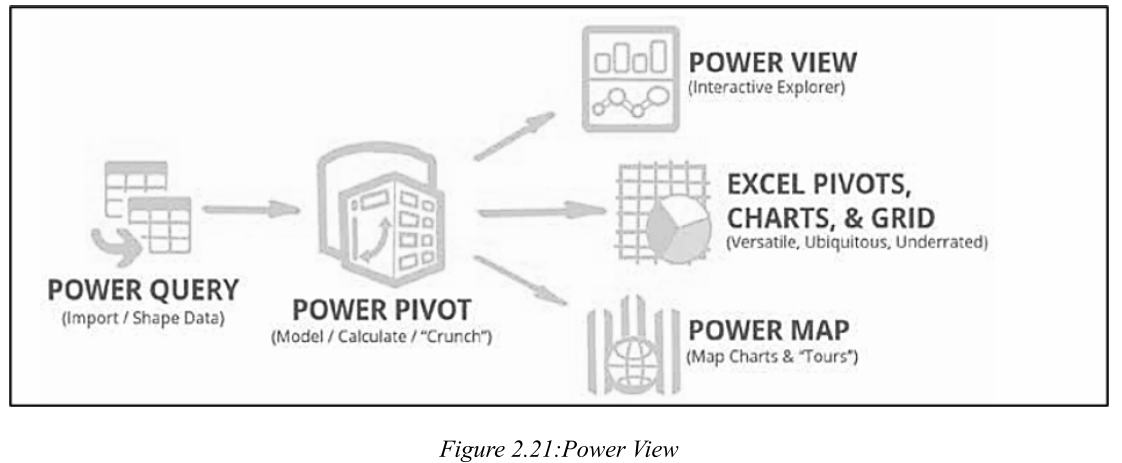
(一)Power Query / 数据查询与转换引擎
1. Definition / 定义
Power Query is a data transformation and mash-up engine. It can be downloaded as an add-in for Excel or used as a part of Power BI Desktop.
Power Query 是一个数据转换和混合引擎。它可以作为 Excel 的外接程序下载,或作为 Power BI Desktop 的一部分使用。
2. Key Features / 关键特性
Data Source Connectivity: Supports a wide range of sources including databases (SQL Server, Oracle, MySQL), files (CSV, Excel), online sources (Facebook, web pages), and more.
Create Your Own Functions (no coding required) / 创建自己的函数(无需编码)
Logs your steps and automates processes / 记录步骤并自动化流程
(二)Power Pivot / 数据建模与内存分析
1. Definition / 定义
Power Pivot is used for data modeling and in-memory analytics . It allows users to create relationships between tables and perform complex calculations using DAX (Data Analysis Expressions).
Power Pivot 用于数据建模和内存分析 。它允许用户建立表之间的关系 ,并使用 DAX(数据分析表达式)执行复杂计算。
2. Key Features / 关键特性
Data Model: Supports relationships and hierarchies.
数据模型:支持关系和层次结构。
DAX Language: Enables advanced calculations (similar to spreadsheet formulas).
DAX 语言:实现高级计算(类似于电子表格公式)。
Excel Integration: Works seamlessly with XLSX files. No server installation needed.
Excel 集成:与 XLSX 文件无缝配合。无需安装服务器。
Pivot Tables: Presents data in an interactive format.
数据透视表:以交互式格式呈现数据。
(三)Power View / 数据可视化交互工具
1. Definition / 定义
Power View is a data visualization tool that supports interactive and intuitive dashboards. It is the fundamental data visualization component of Power BI.
Power View 是一个数据可视化工具 ,支持交互式直观仪表板。它是 Power BI 的基础数据可视化组件。
2. Features / 特性
Visualization Types: Includes charts, maps, tiles, KPIs, and more (Line charts, Pie charts, Scatter charts, Maps, KPIs, etc.).
可视化类型:包括图表、地图、磁贴、KPI 等(折线图、饼图、散点图、地图、KPI 等)。
Interactivity: Users can highlight and filter data dynamically. Different components "talk" to each other.
交互性:用户可以动态突出显示和筛选数据。不同组件之间可以"对话"。
Performance Optimization: Fetches only the required data for better efficiency.
性能优化:仅获取所需数据,提高效率。
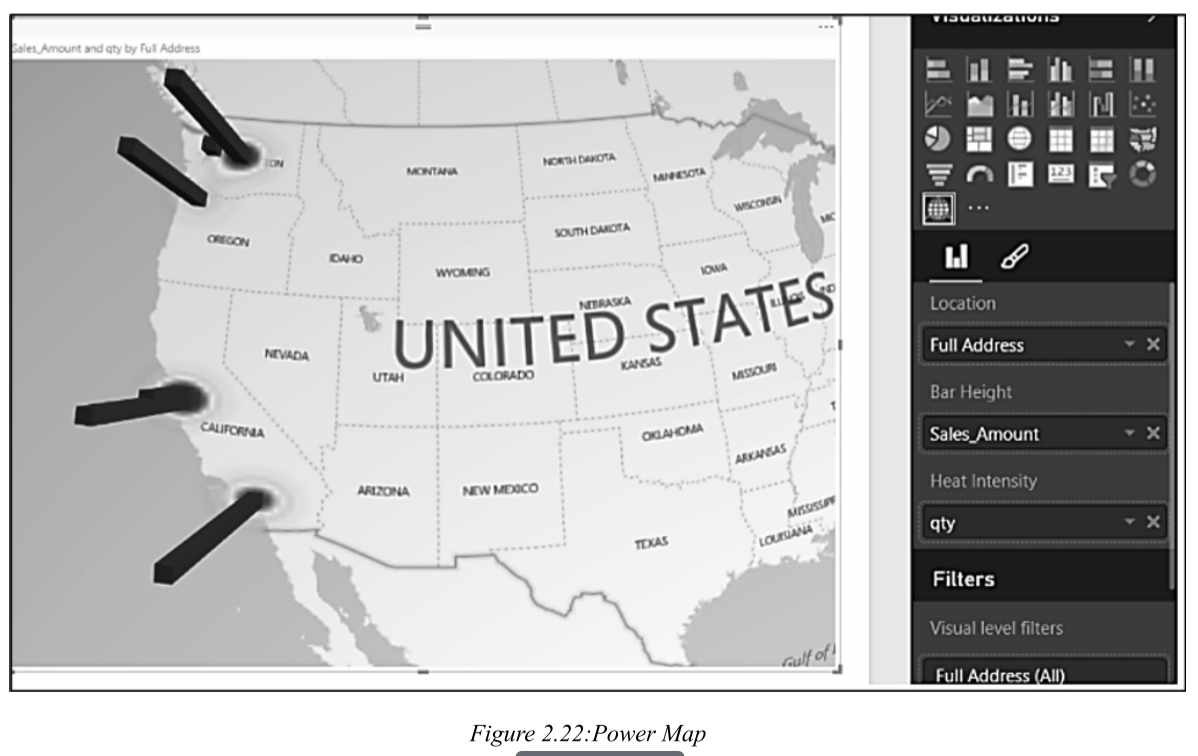
(四)Power Map / 3D 地理空间数据可视化
1. Definition / 定义
Power Map is a 3D data visualization tool for geospatial data analysis. It lets you look at information in new ways.
Power Map 是一个用于地理空间数据分析的 3D 数据可视化工具。它让你以全新的方式查看信息。
2. Features / 特性
3D Visualization : Enables viewing data as columns, heatmaps, or timelines on a 3-D globe.
3D 可视化:能够在 3D 地球仪上以柱状图、热力图或时间轴形式查看数据。
Integration with Bing Maps: Provides accurate geographic visualization based on location data.
与 Bing Maps 集成:根据位置数据提供准确的地理可视化。
Insights Discovery: Reveals trends and patterns not evident in 2D charts.
见解发现:揭示在 2D 图表中不明显的趋势和模式。
(五)Components Comparison / 组件对比表
Component / 组件
Primary Use Case / 主要用途
Integration / 集成方式
Accessibility / 可获取性
Power Query
Data transformation / 数据转换
Excel, Power BI Desktop
Free add-in / 免费外接程序
Power Pivot
Data modeling & analytics / 数据建模与分析
Excel
Embedded / 内嵌
Power View
Data visualization / 数据可视化
Excel
Embedded / 内嵌
Power Map
3D geospatial analysis / 3D 地理空间分析
Excel, Bing Maps
Embedded / 内嵌
Power BI Service
Sharing & collaboration / 共享与协作
Online
Subscription / 订阅制
五、Power BI Ribbon (Tabs & Functions) / 核心界面功能
核心考点:识别各个选项卡下的主要功能按钮及其用途
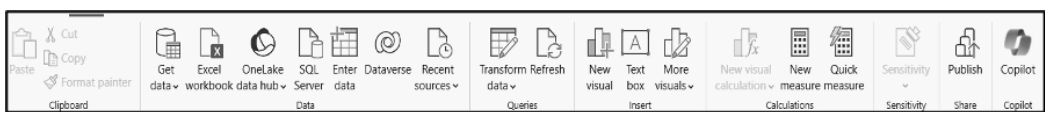
(一)Home Tab /主页选项卡
1. Get Data / 获取数据
A central option that allows users to connect to a wide variety of data sources, including databases, Excel files, cloud services, APIs, and more.
核心选项,允许用户连接到各种数据源,包括数据库、Excel 文件、云服务、API 等。
2. Recent Sources / 最近使用的源
Offers a convenient shortcut to the data connections that have been used recently within Power BI. This streamlines workflow efficiency.
提供指向 Power BI 中最近使用的数据连接的便捷快捷方式。这有助于简化工作流程效率。
3. Enter Data / 输入数据
Allows users to manually create small datasets directly within Power BI Desktop using a spreadsheet-like interface.
允许用户直接在 Power BI Desktop 中,使用类似电子表格的界面手动创建小型数据集。
4. Transform Data / 转换数据
Opens the Power Query Editor, a powerful tool where users can clean, shape, and structure their data.
打开 Power Query 编辑器,这是一个强大的工具,用户可以在其中清理、塑造和构建数据。
5. Refresh / 刷新
Allows users to re-query the original data sources and update the datasets to reflect the most current data.
允许用户重新查询原始数据源并更新数据集以反映最新数据。
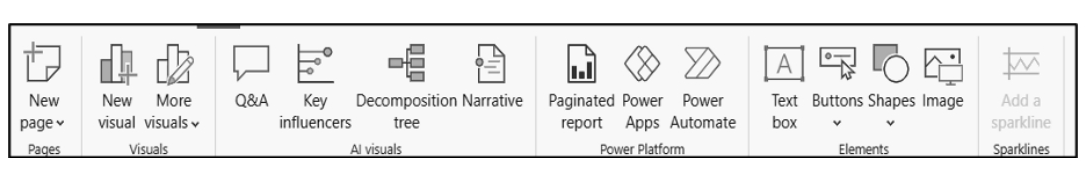
(二)Insert Tab / 插入选项卡
The Insert tab in Power BI Desktop allows users to add visual and functional elements to their reports. It includes visuals like charts, tables, and cards, as well as elements like buttons, shapes, text boxes, images, and even AI-powered visuals.
Power BI Desktop中的Insert选项卡允许用户将视觉元素和功能元素添加到其报告中。它包括图表、表格和卡片等视觉效果,以及按钮、形状、文本框、图像甚至人工智能支持的视觉效果等元素。
1. New Page / 新页面
This option allows users to add a fresh report page within the same Power BI report file. Each page can host its own set of visuals, filters, and design elements.
此选项允许用户在同一个 Power BI 报告文件中添加新的报告页。每个页面都可以承载自己的可视化、筛选器和设计元素。
2. New Visuals / 新建可视化
This section gives users the ability to insert different types of visualizations such as bar charts, line graphs, pie charts, tables, matrices, maps, and more.
此部分允许用户插入不同类型的可视化,例如条形图、折线图、饼图、表格、矩阵、地图等。
3. Decomposition Tree / 分解树
A powerful AI-driven tool that allows users to break down a metric across multiple dimensions. Useful for root cause analysis.
一个强大的 AI 驱动工具,允许用户跨多个维度分解指标。适用于根本原因分析。
4. Narrative / 叙述性
This feature refers to the integration of narrative visuals or smart narrative capabilities that automatically generate textual summaries of data.
此功能是指集成叙述性可视化或智能叙述功能,自动生成数据的文本摘要。
5. Power Apps / Power Apps 可视化
Allows users to embed a Power App directly into a Power BI report, turning a passive report into an interactive solution.
允许用户将 Power App 直接嵌入 Power BI 报告中,将被动报告转变为交互式解决方案。
6. Power Automate / Power Automate 按钮
Allows users to embed automation workflows into their reports, triggering flows directly from Power BI visuals.
允许用户将自动化工作流嵌入到报告中,直接从 Power BI 可视化触发流。
7. Paginated Report / 分页报告
Allows for the inclusion of fixed-layout reports ideal for printing or sharing as PDFs. Supports pixel-perfect formatting.
允许包含固定布局报告,非常适合打印或共享为 PDF。支持像素完美的格式。
8. Text Box / 文本框
Users add custom text to a report page, such as titles, annotations, descriptions, or instructions.
用户向报告页面添加自定义文本,例如标题、注释、描述或说明。
9. Buttons / 按钮
Provide interactive controls within a report. Users can configure buttons for navigation, applying bookmarks, triggering Q&A, or resetting filters.
在报告中提供交互式控件。用户可以配置按钮以导航、应用书签、触发问答或重置筛选器。
10. Shapes / 形状
Allows users to insert graphical elements like rectangles, circles, lines, and arrows into a report.
允许用户在报告中插入矩形、圆形、线条和箭头等图形元素。
11. Images / 图像
Enables users to insert logos, product photos, icons, or any other image file into their reports.
使用户能够将徽标、产品照片、图标或任何其他图像文件插入到其报告中。
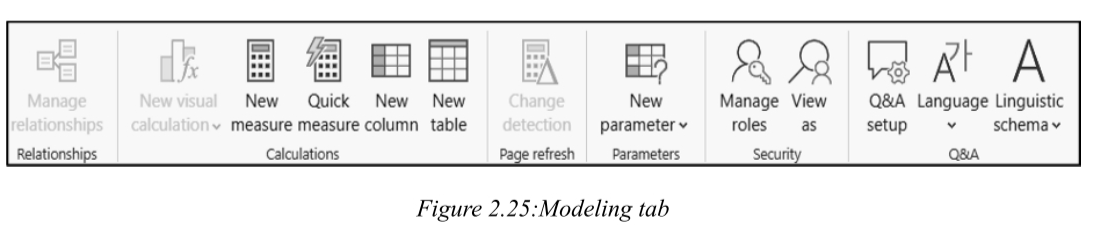
(三)Modeling Tab / 建模选项卡
1. Manage Relationships / 管理关系
This feature allows users to define, edit, or delete relationships between tables in the data model.
此功能允许用户定义、编辑或删除数据模型中表之间的关系。
2. New Measure / 新建度量值
Create new DAX measures.
创建新的 DAX 度量值。
3. Quick Measure / 快速度量值
Prebuilt calculations for common business metrics like running totals, moving averages, or ranking.
针对常见业务指标(如运行总计、移动平均或排名)的预建计算。
4. New Column / 新建列
This feature is used to create calculated columns using DAX. These columns are evaluated during data refresh and stored in the model.
此功能用于使用 DAX 创建计算列。这些列在数据刷新期间计算并存储在模型中。
5. New Table / 新建表
Allows users to create a custom table using DAX expressions. These tables become part of the data model.
允许用户使用 DAX 表达式创建自定义表。这些表成为数据模型的一部分。
6. Manage Roles / 管理角色
The "Manage Roles" feature is used to define Row-Level Security (RLS) rules that restrict data visibility based on user roles.
"管理角色"功能用于定义行级安全性 (RLS) 规则,这些规则根据用户角色限制数据可见性。
7. View as / 以...身份查看
Users can preview their report as if they were a specific role defined under Row-Level Security. This is a testing tool.
用户可以预览报告,就像他们是行级安全性下定义的特定角色一样。这是一个测试工具。
8. Q&A setup / Q&A 设置
Enables users to optimize the natural language Q&A experience in Power BI by managing suggested questions and defining synonyms.
使用户能够通过管理建议的问题和定义同义词来优化 Power BI 中的自然语言问答体验。
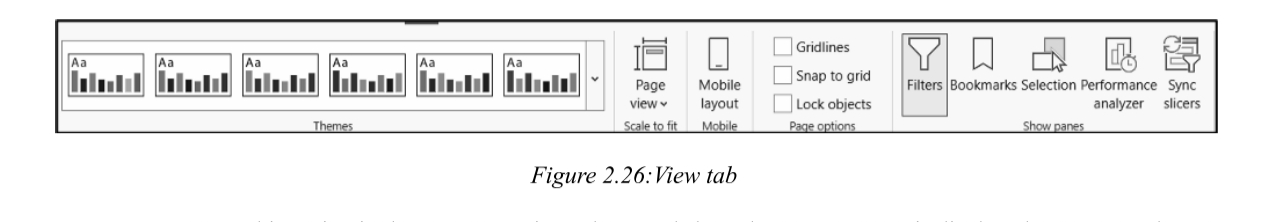
(四)View Tab / 视图选项卡
1. Page View / 页面视图
This option controls how the report canvas is displayed. Users can choose between "Fit to Page," "Fit to Width," or "Actual Size."
此选项控制报告画布的显示方式。用户可以在"适应页面"、"适应宽度"或"实际大小"之间进行选择。
2. Mobile Layout / 移动布局
Allows users to design a version of the report specifically optimized for viewing on mobile devices.
允许用户设计专门针对移动设备查看优化的报告版本。
3. Gridlines / 网格线
Gridlines are visual guides displayed on the report canvas to help align visuals precisely. They do not appear in the published report.
网格线是显示在报告画布上的视觉指南,以帮助精确对齐可视化。它们不会出现在已发布的报告中。
4. Snap to grid / 对齐网格
This function automatically aligns visuals to the nearest grid point when moved or resized, ensuring uniform spacing and alignment.
此功能在移动或调整大小时自动将可视化对齐到最近的网格点,确保均匀的间距和对齐。
5. Lock objects / 锁定对象
This feature allows report designers to freeze the position and size of visuals on the canvas, preventing accidental movement or resizing.
此功能允许报告设计人员冻结画布上可视化的位置和大小,防止意外移动或调整大小。
6. Bookmarks / 书签
Enables users to capture the current state of a report page -- including filters, slicers, and visuals -- and save it as a bookmark. They can be used for storytelling or navigation.
The "Selection" pane provides a list of all elements on the report page and allows users to manage their visibility and layering order.
"选择"窗格提供报告页面上所有元素的列表,并允许用户管理其可见性和分层顺序。
8. Performance Analyzer / 性能分析器
The Performance Analyzer is a diagnostic tool that helps users assess the loading and rendering time of report elements. It helps identify performance bottlenecks.
性能分析器 是一种诊断工具,可帮助用户评估报告元素的加载和渲染时间。它有助于识别性能瓶颈。
9. Sync Slicers / 同步切片器
Allows users to synchronize slicers across multiple report pages. When a user selects a filter value on one page, it automatically applies to all synced pages.
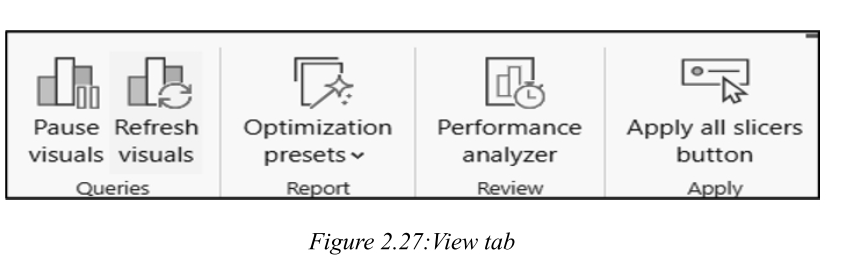
Allows report developers to temporarily halt the automatic refreshing of visuals while editing the report. This improves performance when making multiple changes.
允许报告开发人员在编辑报告时暂时停止可视化的自动刷新。在进行多项更改时,这可以提高性能。
2. Performance Analyzer / 性能分析器
Diagnostic tool that helps developers understand the performance of each visual on a report page by breaking down load times for DAX queries, data retrieval, and rendering.
Enhances the user experience by allowing multiple slicer selections to be applied at once rather than updating visuals after each individual slicer change.
通过允许一次应用多个切片器选择,而不是在每次切片器更改后更新可视化,从而增强用户体验。
六、Copilot in Power BI Mobile Apps (Preview) / Power BI 移动应用中的 Copilot(预览版)
1. Definition / 定义
The "Copilot in Power BI Mobile Apps (Preview)" is an AI-powered feature designed to enhance mobile user experience by enabling natural language interaction with data.
"Power BI 移动应用中的 Copilot(预览版)"是一项 AI 驱动的功能,旨在通过支持与数据的自然语言交互来增强移动用户体验。
2. Functionality / 功能
This preview functionality allows users to ask questions about their data in conversational language and receive intelligent, contextual answers in the form of visual insights.
Copilot aims to make data analysis more accessible on the go, providing recommendations, summaries, and deeper understanding even without technical expertise.