Kubernetes弹性伸缩------水平自动伸缩 HPA
1:介绍
HPA(Horizontal Pod Autoscaler)可以基于 CPU 利用率自动扩缩 ReplicationController、Deployment 和 ReplicaSet 中的 Pod 数量。除了 CPU,也可以基于其他自定义度量指标执行自动扩缩。
注意 :Pod 自动扩缩不适用于无法扩缩的对象,比如
DaemonSet。
Pod 水平自动扩缩特性由 Kubernetes API 资源和控制器实现。控制器会周期性地调整副本数量,使得 Pod 的平均 CPU 利用率与用户设定的目标值匹配。
HPA 定期检查内存和CPU等指标,自动调整Deployment中的副本数;
实际生产中广泛使用以下四类指标:
- Resource metrics -- CPU 和内存利用率指标
- Pod metrics -- 例如网络利用率和流量
- Object metrics -- 特定对象指标,比如 Ingress 的每秒请求数
- Custom metrics -- 自定义监控,例如服务响应时间
2:Metrics-Server 部署
Metrics-Server 可以查看资源(CPU、内存、存储)使用情况。
创建 Metrics-Server 资源
bash
[root@master ~]# wget https://github.com/kubernetes-sigs/metrics-server/releases/latest/download/components.yaml -O metrics-server-components.yaml
[root@master ~]# sed -i 's/registry.k8s.io\/metrics-server/registry.cn-hangzhou.aliyuncs.com\/google_containers/g' metrics-server-components.yaml
[root@master ~]# vim metrics-server-components.yaml
注意 :v0.8.0 版本后,需要添加
--kubelet-insecure-tls参数,否则无法从 kubelet 拉取指标。
yaml
containers:
- args:
    - --cert-dir=/tmp
    - --secure-port=10250
    - --kubelet-insecure-tls        # 添加
    - --kubelet-preferred-address-types=InternalIP,ExternalIP,Hostname
    - --kubelet-use-node-status-port
    - --metric-resolution=15s
  image: registry.cn-hangzhou.aliyuncs.com/google_containers/metrics-server:v0.8.0
查看pod
bash
[root@master ~]# kubectl apply -f metrics-server-components.yaml

[root@master~]# kubectl get pods -n kube-system
NAME                                         READY   STATUS    RESTARTS         AGE
calico-kube-controllers-585df69d45-jvw2t     1/1     Running   23 (6h12m ago)   35d
calico-node-6hhpc                            1/1     Running   18 (6h12m ago)   35d
calico-node-csnj7                            1/1     Running   21 (6h11m ago)   35d
calico-node-p6bgb                            1/1     Running   20 (6h11m ago)   35d
coredns-7db6d8ff4d-dbjhb                     1/1     Running   20 (6h12m ago)   35d
coredns-7db6d8ff4d-h5vl2                     1/1     Running   20 (6h12m ago)   35d
etcd-master30.hgq.cloud                      1/1     Running   23 (6h12m ago)   35d
kube-apiserver-master30.hgq.cloud            1/1     Running   34 (6h11m ago)   35d
kube-controller-manager-master30.hgq.cloud   1/1     Running   9 (6h12m ago)    28d
kube-proxy-9gqs7                             1/1     Running   8 (6h12m ago)    28d
kube-proxy-qvg5m                             1/1     Running   10 (6h11m ago)   28d
kube-proxy-whsjf                             1/1     Running   8 (6h11m ago)    28d
kube-scheduler-master30.hgq.cloud            1/1     Running   31 (6h12m ago)   35d
metrics-server-d994c478f-78jzg               1/1     Running   16 (6h7m ago)    25d
查看资源创建过程
bash
[root@master ~]# kubectl describe pod metrics-server-d994c478f-78jzg -n kube-system使用 kubectl top 查看资源
bash
[root@master ~]# kubectl top pod kube-apiserver-master -n kube-system
NAME                   CPU(cores)   MEMORY(bytes)
kube-apiserver-master  78m          384Mi
查看节点资源:
bash
[root@master ~]# kubectl top nodes3:HPA 案例 -- 部署 Nginx 应用及服务
创建 Nginx 应用和服务
bash
[root@master hpa]# vim nginx01-svc.yaml
apiVersion: apps/v1
kind: Deployment
metadata:
  labels:
    app: nginx
  name: nginx
  namespace: default
spec:
  replicas: 2
  selector:
    matchLabels:
      app: nginx
  template:
    metadata:
      labels:
        app: nginx
    spec:
      containers:
      - name: nginx
        image: nginx:1.26-alpine
        imagePullPolicy: IfNotPresent
        resources:
          requests:
            cpu: 200m
            memory: 100Mi
---
apiVersion: v1
kind: Service
metadata:
  name: nginx
  namespace: default
spec:
  type: NodePort
  ports:
  - port: 80
    targetPort: 80
  selector:
    app: nginx
bash
[root@master hpa]# kubectl apply -f nginx01-svc.yaml
[root@master hpa]# kubectl get pods,svc
输出:
NAME                        READY   STATUS    RESTARTS   AGE
pod/nginx-85f7bbbc89-f9ql9   1/1     Running   0          2m13s
pod/nginx-85f7bbbc89-mkhsn   1/1     Running   0          2m13s

NAME                 TYPE       CLUSTER-IP     EXTERNAL-IP   PORT(S)          AGE
service/kubernetes   ClusterIP  10.96.0.1      <none>        443/TCP          5d23h
service/nginx NodePort 10.99.85.152 <none> 80:30699/TCP 2m14s创建 HPA 对象
nginx-hpa.yaml 内容:
yaml
apiVersion: autoscaling/v2
kind: HorizontalPodAutoscaler
metadata:
  name: nginx-hpa
  namespace: default
spec:
  scaleTargetRef:
    apiVersion: apps/v1
    kind: Deployment
    name: nginx           # 必须与 Deployment 名称一致
  minReplicas: 1
  maxReplicas: 10
  metrics:
  - type: Resource
    resource:
      name: cpu
      target:
        type: Utilization
        averageUtilization: 50    # 平均 CPU 利用率超过 50% 触发扩容
应用:
bash
[root@master hpa]# kubectl apply -f nginx-hpa.yaml
horizontalpodautoscaler.autoscaling/nginx-hpa created
查看 HPA 状态:
bash
[root@master hpa]# kubectl get hpa
NAME         REFERENCE           TARGETS         MINPODS   MAXPODS   REPLICAS   AGE
nginx-hpa    Deployment/nginx    0%/50%          1         10        1          62s
执行压测
安装压力测试工具:
bash
[root@master hpa]# yum install -y httpd-toolscontos安装httpd-tools,ubuntu安装apache2-utils
发起压测(并发 10000,总请求数 10 亿):
bash
[root@master hpa]# ab -c 10000 -n 1000000000 http://10.1.8.31:30699/观测 Pod 自动扩容(从 2 个变成 9 个):
bash
[root@master ~]# kubectl get pods
NAME                     READY   STATUS    RESTARTS   AGE
nginx-85f7bbbc89-cgdbk   1/1     Running   0          41s
nginx-85f7bbbc89-cvggh   1/1     Running   0          4m26s
nginx-85f7bbbc89-dbzdb   1/1     Running   0          41s
nginx-85f7bbbc89-f2hxg   1/1     Running   0          3m56s
nginx-85f7bbbc89-f9q19   1/1     Running   0          44m
nginx-85f7bbbc89-jr2n1   1/1     Running   0          4m26s
nginx-85f7bbbc89-pnqzx   1/1     Running   0          41s
nginx-85f7bbbc89-r5g1c   1/1     Running   0          26s
nginx-85f7bbbc89-rzw6s   1/1     Running   0          41s
压力降低后,约 5 分钟自动缩容回 1 个 Pod:
bash
[root@master hpa]# kubectl get pods
NAME                     READY   STATUS    RESTARTS   AGE
nginx-85f7bbbc89-f9q19   1/1     Running   0          49m
4:通过 Prometheus 及 HPA 实现基于自定义指标的水平自动伸缩
4.1 环境准备(部署metrics-server)
bash
[root@master ~]# kubectl top pods -n kube-system
NAME                                   CPU(cores)   MEMORY(bytes)
calico-kube-controllers-658d97c59c-z9sns   2m         22Mi
calico-node-6bj6w                         65m         98Mi
calico-node-mt18j                         60m         136Mi
calico-node-zmbmx                         70m         127Mi
coredns-66f779496c-qsc44                  3m          18Mi
coredns-66f779496c-zs95w                  3m          17Mi
etcd-master                               32m         153Mi
kube-apiserver-master                     78m         302Mi
kube-controller-manager-master            27m         55Mi
kube-proxy-2qt7j                          9m          21Mi
kube-proxy-szcm6                          1m          24Mi
kube-proxy-t2fww                          1m          22Mi
kube-scheduler-master                     5m          23Mi
metrics-server-57999c5cf7-k8thb           4m          24Mi
4.2 配置 kube-proxy 使用 IPVS 模式
bash
[root@master ~]# kubectl edit configmap kube-proxy -n kube-system将 strictARP: true 设置为 true,然后重启:
bash
[root@master ~]# kubectl rollout restart daemonset kube-proxy -n kube-system4.3 部署 MetalLB(用于 LoadBalancer 类型 Service)
bash
[root@master ~]# kubectl apply -f https://raw.githubusercontent.com/metallb/metallb/v0.15.2/config/manifests/metallb-native.yaml配置二层网络地址池:
ippool.yaml:
yaml
apiVersion: metallb.io/v1beta1
kind: IPAddressPool
metadata:
  name: first-pool
  namespace: metallb-system
spec:
  addresses:
  - 10.1.8.40-10.1.8.80
开启二层通告:
L2.yaml:
yaml
apiVersion: metallb.io/v1beta1
kind: L2Advertisement
metadata:
  name: example
  namespace: metallb-system
应用:
bash
[root@master demo]# kubectl apply -f ippool.yaml -f L2.yaml
ipaddresspool.metallb.io/first-pool created
l2advertisement.metallb.io/example created
查看地址池:
bash
[root@master demo]# kubectl get ipaddresspool -n metallb-system
NAME         AUTO ASSIGN   AVOID BUGGY IPS   ADDRESSES
first-pool   true          false             ["192.168.18.240-192.168.18.250"]
4.4 部署 Ingress Nginx
参考 GitHub 仓库获取部署清单(根据 Kubernetes 版本选择合适版本)。
bash
[root@master demo]# wget https://raw.githubusercontent.com/kubernetes/ingress-nginx/controller-v1.13.2/deploy/static/provider/cloud/deploy.yaml编辑yaml文件:
bash
[root@master demo]# vim deploy.yaml
...
spec:
  externalTrafficPolicy: Cluster #347行位置把Local修改为Cluster
  ipFamilies:
  - IPv4
  ipFamilyPolicy: SingleStack
...Local:严格本地转发 。外部请求只被转发到本节点上 运行的 Pod。如果该节点上没有对应的 Pod,连接将直接失败(被丢弃)。
Cluster:集群内转发 。外部请求可以被转发到集群任意节点上的 Pod。即使当前节点没有 Pod,它也会将请求路由给其他有 Pod 的节点。
bash
[root@master demo]# kubectl apply -f deploy.yaml
[root@master demo]# kubectl get ns
NAME                   STATUS   AGE
default                Active   6d1h
ingress-nginx          Active   55s
kube-node-lease        Active   6d1h
kube-public            Active   6d1h
kube-system            Active   6d1h
kubernetes-dashboard   Active   6d1h
metallb-system         Active   32m

[root@master ~]# kubectl get pods,svc -n ingress-nginx
NAME                                            READY   STATUS    RESTARTS        AGE
pod/ingress-nginx-controller-8659885ffd-nc8hs   1/1     Running   11 (7h5m ago)   26d

NAME                                         TYPE           CLUSTER-IP       EXTERNAL-IP   PORT(S)                      AGE
service/ingress-nginx-controller             LoadBalancer   10.102.232.108   10.1.8.40     80:30455/TCP,443:31350/TCP   28d
service/ingress-nginx-controller-admission   ClusterIP      10.105.57.209    <none>        443/TCP                      28d
4.5 部署 Prometheus
使用 Helm 安装 Prometheus 全家桶(kube-prometheus-stack)。
先安装 Helm,添加仓库:
bash
[root@master ~]# wget https://get.helm.sh/helm-v4.2.3-linux-amd64.tar.gz
[root@master ~]# tar zxvf helm-v4.2.3-linux-amd64.tar.gz
[root@master ~]# cd linux-amd64/
[root@master linux-amd64]# ls
LICENSE  README.md  helm
[root@master linux-amd64]# mv helm /usr/bin/
[root@master linux-amd64]# helm version
version.BuildInfo{Version:"v4.2.3", GitCommit:"43e8b7feece8beb0fcba47059ec9b522fd929a64", GitTreeState:"clean", GoVersion:"go1.26.5", KubeClientVersion:"v1.36"}
bash
[root@master linux-amd64]# helm repo add prometheus-community https://prometheus-community.github.io/helm-charts
"prometheus-community" has been added to your repositories

# 查看资源路径
[root@master linux-amd64]# helm repo list
NAME                    URL
prometheus-community    https://prometheus-community.github.io/helm-charts

# 仓库软件更新
[root@master ~]# helm repo update

# 查看helm仓库中Prometheus版本
[root@master linux-amd64]# helm search repo prometheus
使用helm安装Prometheus全家桶
bash
[root@master hpa]# mkdir promedir
[root@master hpa]# cd promedir/
[root@master promedir]# helm show values prometheus-community/kube-prometheus-stack --version 77.6.2 > kube-prometheus-stack.yaml
[root@master promedir]# ls
kube-prometheus-stack.yaml
Prometheus默认只启用对kubernetes集群组件监控,需要关闭,让它可以对所有应用进行服务发现。
bash
[root@master promedir]# vim kube-prometheus-stack.yaml安装部署Prometheus,命名为kps
bash
[root@master promedir]# helm install kps prometheus-community/kube-prometheus-stack --version 77.6.2 -f ./kube-prometheus-stack.yaml -n monitoring --create-namespace --debug检查 Pod 和服务:
bash
[root@master promedir]# kubectl --namespace monitoring get pods -l "release=kps"
NAME                                                  READY   STATUS    RESTARTS   AGE
kps-kube-prometheus-stack-operator-6cd58666dd-xzx2j   1/1     Running   0          4m12s
kps-kube-state-metrics-557468fc6c-b9q2l               1/1     Running   0          4m12s
kps-prometheus-node-exporter-d22mp                    1/1     Running   0          4m13s
kps-prometheus-node-exporter-ljlj2                    1/1     Running   0          4m12s
kps-prometheus-node-exporter-wc8t9                    1/1     Running   0          4m12s


[root@master promedir]# kubectl get svc -n monitoring
NAME                                     TYPE        CLUSTER-IP       EXTERNAL-IP   PORT(S)                      AGE
alertmanager-operated                    ClusterIP   None             <none>        9093/TCP,9094/TCP,9094/UDP   5m4s
kps-grafana                              ClusterIP   10.96.67.232     <none>        80/TCP                       5m36s
kps-kube-prometheus-stack-alertmanager   ClusterIP   10.107.225.111   <none>        9093/TCP,8080/TCP            5m36s
kps-kube-prometheus-stack-operator       ClusterIP   10.96.130.142    <none>        443/TCP                      5m36s
kps-kube-prometheus-stack-prometheus     ClusterIP   10.107.107.175   <none>        9090/TCP,8080/TCP            5m36s
kps-kube-state-metrics                   ClusterIP   10.106.51.4      <none>        8080/TCP                     5m36s
kps-prometheus-node-exporter             ClusterIP   10.111.108.192   <none>        9100/TCP                     5m36s
prometheus-operated                      ClusterIP   None             <none>        9090/TCP                     5m3s
配置 Ingress 访问 Prometheus 和 Grafana
prometheus-ingress.yaml:
yaml
apiVersion: networking.k8s.io/v1
kind: Ingress
metadata:
  name: ingress-prometheus  #自定义ingress名称
  namespace: monitoring
spec:
  ingressClassName: nginx
  rules:
  - host: prometheus.abner.com  #自定义域名
    http:
      paths:
      - backend:
          service:
            name: kps-kube-prometheus-stack-prometheus
            port:
              number: 9090
        pathType: Prefix
path: "/"grafana-ingress.yaml:
yaml
apiVersion: networking.k8s.io/v1
kind: Ingress
metadata:
  name: ingress-grafana  #自定义ingress名称
  namespace: monitoring
spec:
  ingressClassName: nginx
  rules:
  - host: grafana.abner.com  #自定义域名
    http:
      paths:
      - backend:
          service:
            name: kps-grafana
            port:
              number: 80
        pathType: Prefix
        path: "/"
应用:
bash
[root@master promedir]# kubectl apply -f prometheus-ingress.yaml -f grafana-ingress.yaml查看 Ingress:
bash
[root@master promedir]# kubectl get ingress -n monitoring
NAME                 CLASS   HOSTS                  ADDRESS     PORTS   AGE
ingress-grafana      nginx   grafana.abner.com      10.1.8.40   80      88s
ingress-prometheus   nginx   prometheus.abner.com   10.1.8.40   80      32s
在 Windows 的 C:\Windows\System32\drivers\etc\hosts 中添加域名解析:
10.1.8.40 grafana.abner.com
10.1.8.40 prometheus.abner.com
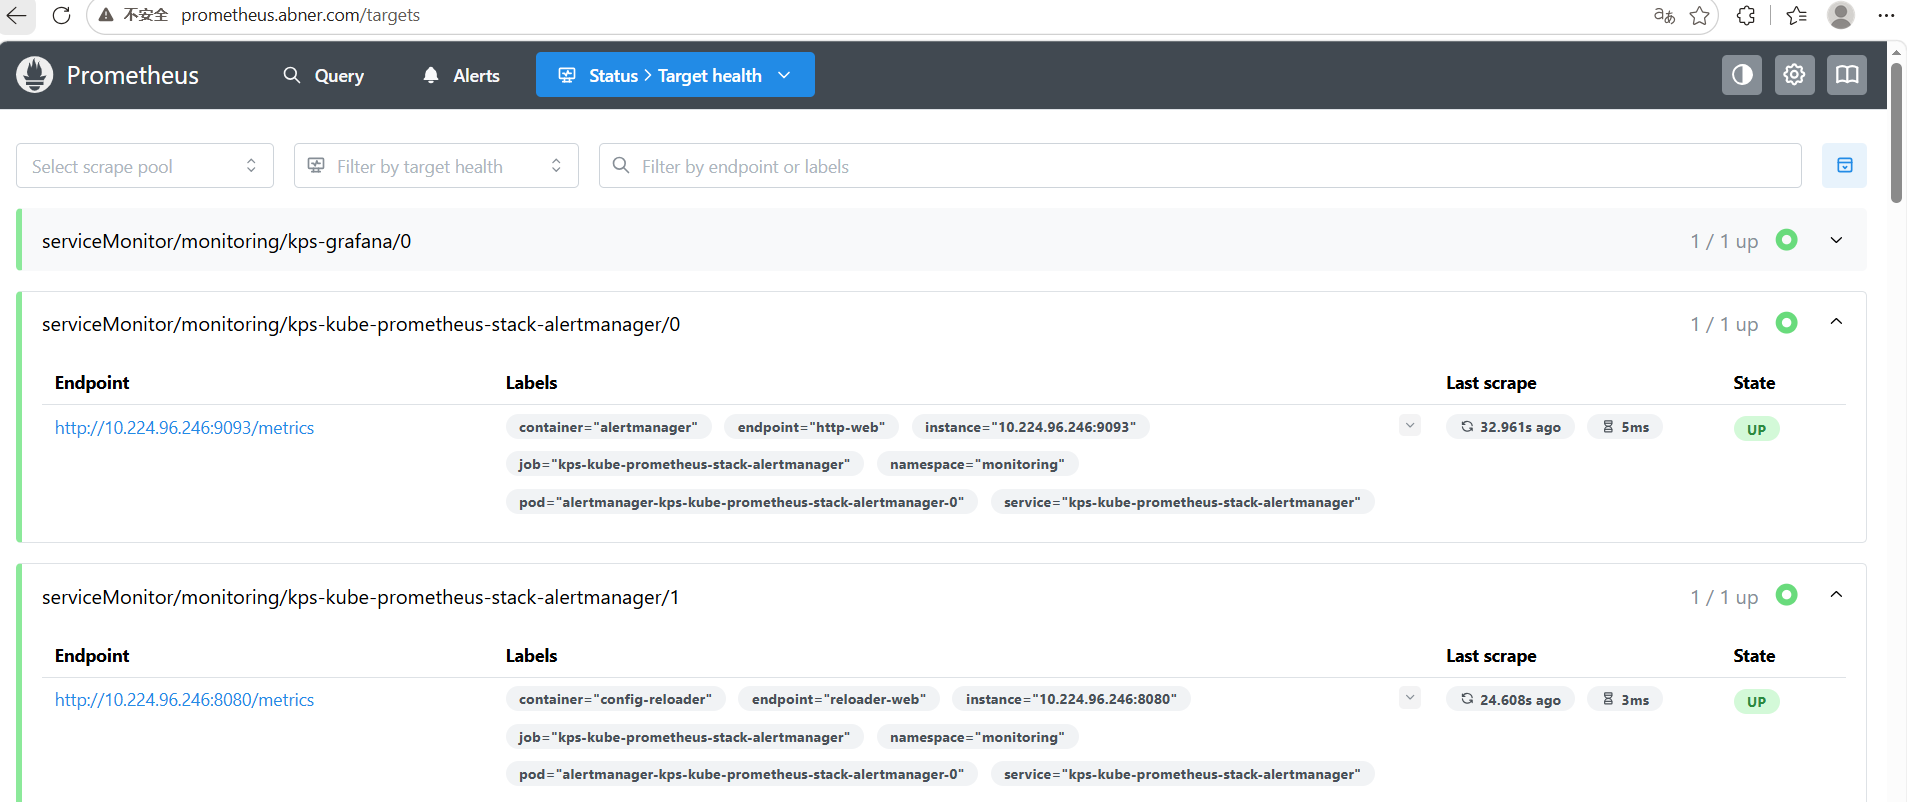
访问 http://prometheus.abner.com/ 查看 Targets 状态。
获取 Grafana 登录密码
bash
[root@master promedir]# kubectl get secret kps-grafana -n monitoring -o yaml解码:
bash
# 用户名
[root@master promedir]# echo -n "YWRtaW4=" | base64 --decode   # admin
# 密码
[root@master promedir]# echo -n "CHJvbS1vcGVyYXRvcg==" | base64 --decode   # prom-operator
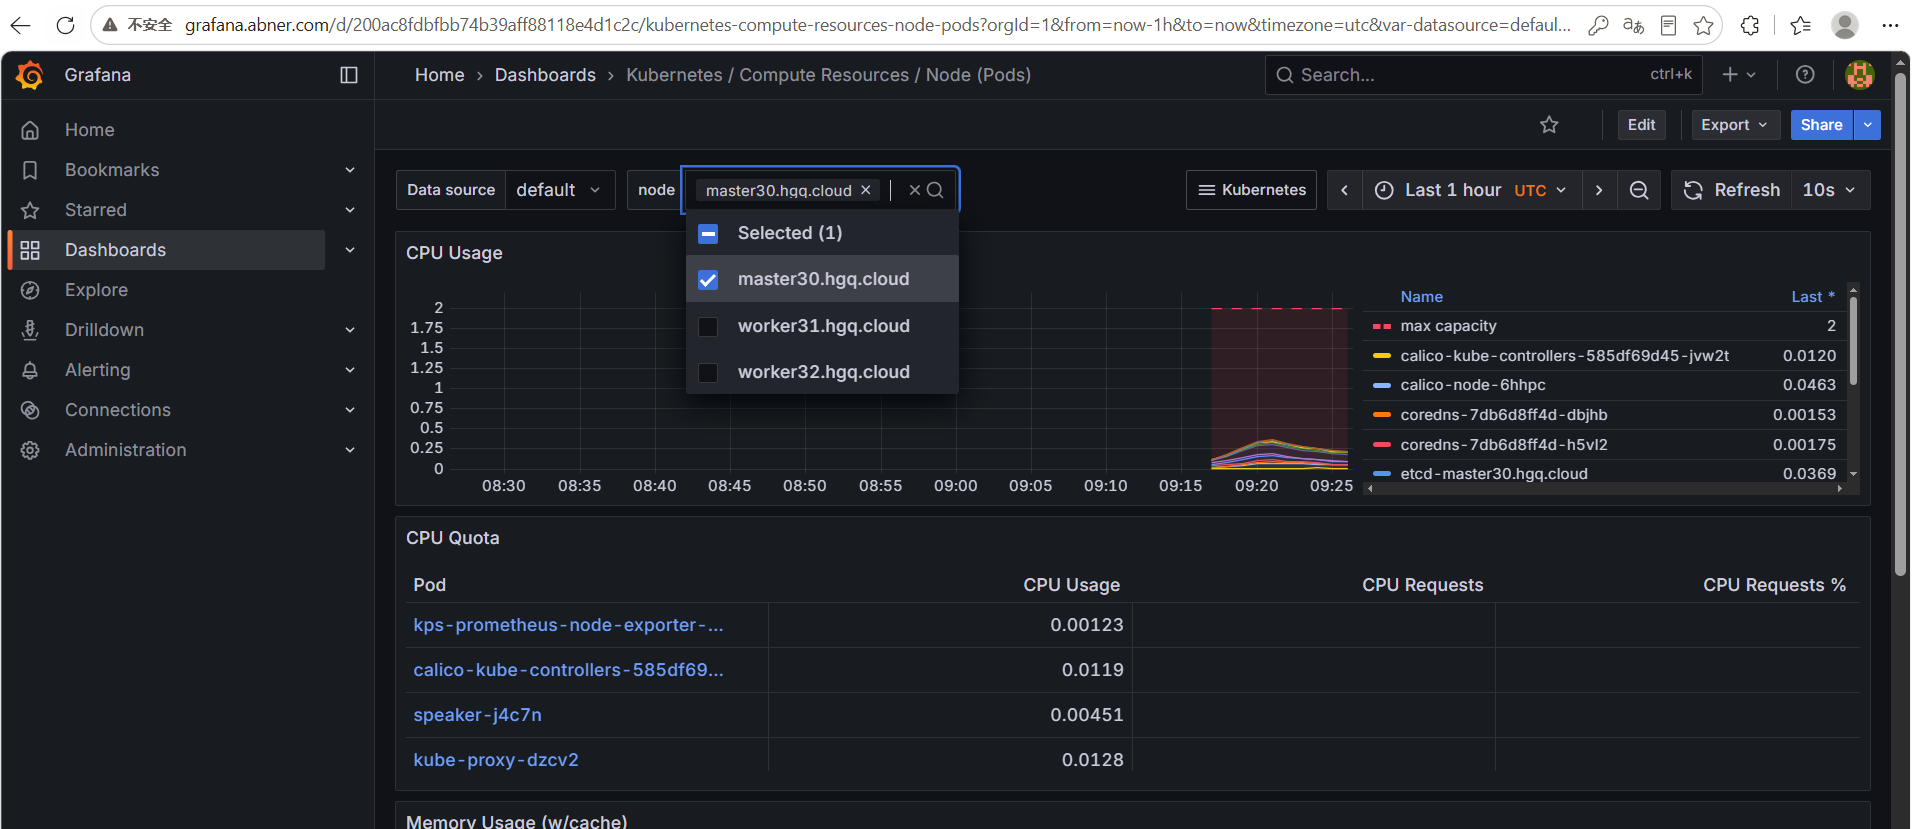
登录 Grafana(http://grafana.abner.com/)。

查看对所有node的数据监控
5:部署 Nginx 应用并暴露 Prometheus 指标
编写 Nginx 配置文件(nginx.conf)
(包含 stub_status 模块)
bash
[root@master hpa]# mkdir nginxdir
[root@master hpa]# cd nginxdir/
[root@master nginxdir]# vim nginx.conf
worker_processes 1;
events {
    worker_connections 1024;
}
http {
    server {
        listen 80;

        location / {
            root /usr/share/nginx/html;
            index index.html;
        }

        location /basic_status {
            stub_status;
            allow 127.0.0.1;
            deny all;
        }
    }
}
创建 创建nginx配置资源ConfigMap:
bash
[root@master nginxdir]# kubectl create configmap nginx-config --from-file=nginx.conf

# 查看configmap资源
[root@master nginxdir]# kubectl get cm
NAME               DATA   AGE
kube-root-ca.crt   1      36d
nginx-config       1      7s
Nginx Deployment 与 Service YAML(nginx.yaml)
bash
[root@master nginxdir]# vim nginx.yaml
yaml
apiVersion: apps/v1
kind: Deployment
metadata:
  name: nginx-with-exporter
  namespace: default
spec:
  replicas: 2
  selector:
    matchLabels:
      app: nginx
  template:
    metadata:
      labels:
        app: nginx
    spec:
      containers:
      - name: nginx
        image: nginx:1.26-alpine
        imagePullPolicy: IfNotPresent
        ports:
        - containerPort: 80
        volumeMounts:
        - mountPath: /etc/nginx/nginx.conf
          subPath: nginx.conf
          name: nginx-config-volume
        resources:
          requests:
            cpu: 100m
            memory: 100Mi
      - name: nginx-prometheus-exporter
        image: nginx/nginx-prometheus-exporter:latest
        imagePullPolicy: IfNotPresent
        args: ["-nginx.scrape-uri=http://localhost/basic_status"]
        ports:
        - containerPort: 9113
          name: exporter-port
        resources:
          requests:
            cpu: 50m
            memory: 100Mi
      volumes:
      - name: nginx-config-volume
        configMap:
          name: nginx-config
---
apiVersion: v1
kind: Service
metadata:
  name: nginx
  namespace: default
spec:
  type: NodePort
  ports:
  - port: 80
    targetPort: 80
  selector:
    app: nginx
应用:
bash
[root@master nginxdir]# kubectl apply -f nginx.yaml
deployment.apps/nginx-with-exporter created
service/nginx created
查看 Pod:
bash
[root@master nginxdir]# kubectl get pods
NAME                                   READY   STATUS    RESTARTS   AGE
nginx-with-exporter-56bf57d4dd-5rlpj   2/2     Running   0          33s
nginx-with-exporter-56bf57d4dd-rgpb8   2/2     Running   0          33s
在 Prometheus 中添加 Nginx 监控配置
编辑 kube-prometheus-stack.yaml,添加 additionalScrapeConfigs:
yaml
additionalScrapeConfigs:
  - job_name: 'nginx'
    kubernetes_sd_configs:
      - role: pod
    relabel_configs:
      - source_labels: [__meta_kubernetes_pod_container_port_name]
        action: keep
        regex: exporter-port
      - source_labels: [__meta_kubernetes_namespace]
        target_label: namespace
      - source_labels: [__meta_kubernetes_pod_name]
        target_label: pod
更新配置(Helm Release):
bash
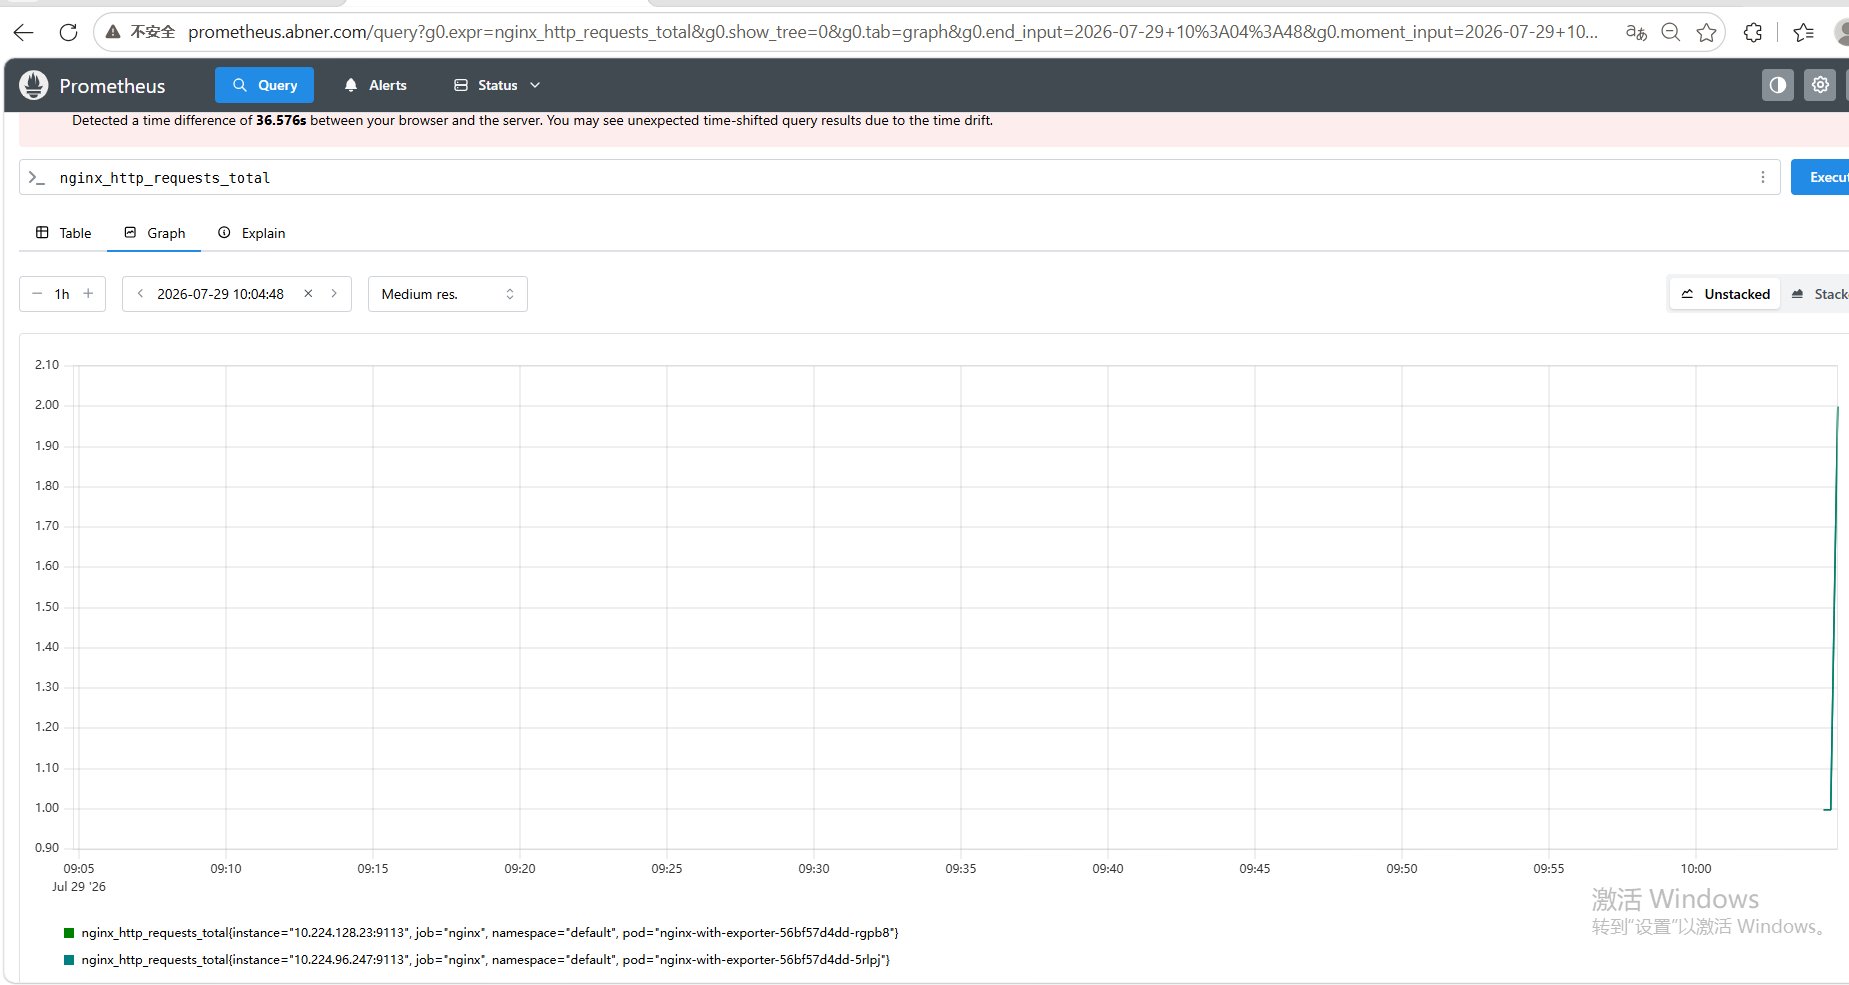
[root@master promedir]# helm upgrade kps prometheus-community/kube-prometheus-stack --version 77.6.2 -f ./kube-prometheus-stack.yaml -n monitoring等待2-3分钟刷新Prometheus网页,可以查看到监控nginx应用的状态 nginx_http_requests_total

在Prometheus中查看nginx的请求数据
6:Prometheus Adapter
Prometheus-Adapter作为一个自定义指标API 服务器,允许Kubernetes集群使用Prometheus作为后端来获取指标数据。这些数据可以用Kubernetes中的水平自动扩缩容(HPA)或者KEDA(基于事件驱动自动扩缩容)。
"Adapter"在这里可以翻译为"适配器"。
- 适配器的角色 :
- Prometheus Adapter 充当了 Prometheus和Kubernetes之间的桥梁或适配器。它使Kubernetes能够使用prometheus 中收集的指标来做出自动伸缩(如水平 Pod 自动伸缩)的决策。
- 工作原理 :
- Prometheus 本身收集和存储了大量的指标数据,但Kubernetes的HPA 或VPA 无法直接使用这些数据。
- Prometheus Adapter的作用是将Prometheus中的指标转换为Kubernetes可以理解的格式,并通过Kubernetes自定义指标API提供这些数据。
- 这样,当HPA 或VPA需要根据特定指标(如每秒 HTTP 请求的数量或特定队列的长度)来自动调整Pod 的数量时,它们可以查询这些由Prometheus Adapter提供的指标。
- 配置和使用 :
- 在Prometheus Adapter中,用户需要定义如何从Prometheus查询特定指标,以及如何将这些指标映射到Kubernetes 可理解的资源上(如 Pod、服务等)
- 一旦配置完成并且Prometheus Adapter正在运行,用户可以在Kubernetes HPA 或VPA配置中引用这些自定义指标,以实现基于更丰富指标集的自动伸缩策略。
- 实际应用 :
- Prometheus Adapter 广泛应用于需要动态伸缩资源以适应不断变化工作负载的Kubernetes集群中。
- 例如,如果某个服务在流量高峰期间需要更多的Pod 来处理请求,Prometheus Adapter 可以提供相应的流量指标给HPA,HPA 再根据这些指标来增加Pod 的数量。
把 Prometheus 里的监控指标,转换成 Kubernetes 标准 Custom Metrics API / External Metrics API 能够识别的格式,给 HPA(水平 Pod 自动扩缩容)使用。
安装 Prometheus Adapter
查看可用版本:
bash
[root@master30~] # helm search repo prometheus-adapter
NAME                                    CHART VERSION   APP VERSION     DESCRIPTION
prometheus-community/prometheus-adapter 5.3.0           v0.12.0         A Helm chart for k8s prometheus adapter
下载适配器yaml:
bash
[root@master ~]# helm show values prometheus-community/prometheus-adapter --version 5.1.0 > prometheus-adapter.yaml修改 prometheus-adapter.yaml:
-
配置 Prometheus URL(第43行):
yamlprometheus: # Value is templated url: http://kps-kube-prometheus-stack-prometheus.monitoring.svc.cluster.local. port: 9090 path: ""
http://kps-kube-prometheus-stack-prometheus.monitoring.svc.cluster.local.个地址是 Prometheus 服务在 Kubernetes 集群内部的完整域名(FQDN) ,它的构成是:<Service名称>.<命名空间>.svc.cluster.local
kps-kube-prometheus-stack-prometheus:这是你通过 Helm 安装的 Prometheus 实例对应的 K8s Service 名称。Adapter 必须通过这个 Service 的 IP 或域名才能访问到 Prometheus 的 API(端口 9090)。.monitoring:该 Service 所在的命名空间。.svc.cluster.local:Kubernetes 集群内部服务的默认本地域名后缀。
- 为什么要加末尾的点
.?(避免 DNS 解析污染)
- 不加点的域名(相对域名) :
如果你写成...cluster.local(末尾没有点),Kubernetes 的 DNS 解析器会把它当成相对域名。- 加点的域名(绝对域名 / FQDN) :
末尾带.表示这是一个完全限定域名(FQDN) 。DNS 解析器会直接从根区开始解析,不会附加任何搜索域。
-
添加自定义规则(138行):
yamlrules: default: true custom: - seriesQuery: 'nginx_http_requests_total{namespace!="",pod!=""}' resources: overrides: namespace: {resource: "namespace"} pod: {resource: "pod"} name: as: "nginx_http_requests" metricsQuery: 'sum(rate(nginx_http_requests_total{<<.LabelMatchers>>}[2m])) by (<<.GroupBy>>)'
作用:把 Prometheus 中的 nginx_http_requests_total 转换成一个可供 HPA 使用的自定义指标nginx_http_requests,表示"每个 Pod 的请求速率 (QPS)"。
安装:
bash
[root@master30~] # helm install prometheus-adapter prometheus-community/prometheus-adapter --namespace monitoring --version 5.3.0 -f ./prometheus-adapter.yaml查看 Pod:
bash
[root@master30~] # kubectl get pods -n monitoring | grep adapter
prometheus-adapter-794545cc7d-pdnrq                     1/1     Running   0              10m
验证自定义指标 API
安装 jq:
bash
[root@master ~]# yum install jq -y查看所有自定义指标:
bash
[root@master ~]# kubectl get --raw "/apis/custom.metrics.k8s.io/v1beta1" | jq查询 default 命名空间 Pod 的 nginx_http_requests 指标:
bash
[root@master ~]# kubectl get --raw "/apis/custom.metrics.k8s.io/v1beta1/namespaces/default/pods/*/nginx_http_requests" | jq输出示例:
json
{
  "kind": "MetricValueList",
  "apiVersion": "custom.metrics.k8s.io/v1beta1",
  "metadata": {},
  "items": [
    {
      "describedObject": {
        "kind": "Pod",
        "namespace": "default",
        "name": "nginx-with-exporter-56bf57d4dd-5rlpj",
        "apiVersion": "/v1"
      },
      "metricName": "nginx_http_requests",
      "timestamp": "2026-07-30T03:20:20Z",
      "value": "33m",
      "selector": null
    },
    {
      "describedObject": {
        "kind": "Pod",
        "namespace": "default",
        "name": "nginx-with-exporter-56bf57d4dd-rgpb8",
        "apiVersion": "/v1"
      },
      "metricName": "nginx_http_requests",
      "timestamp": "2026-07-30T03:20:20Z",
      "value": "33m",
      "selector": null
    }
  ]
}
7:创建 HPA 并实现基于自定义指标的自动伸缩
HPA YAML(hpa.yaml)
bash
[root@master30~] # vim hpa.yaml
yaml
apiVersion: autoscaling/v2
kind: HorizontalPodAutoscaler
metadata:
  name: nginx-hpa
  namespace: default
spec:
  maxReplicas: 5
  minReplicas: 1
  scaleTargetRef:
    apiVersion: apps/v1
    kind: Deployment
    name: nginx-with-exporter
  metrics:
  - type: Resource
    resource:
      name: cpu
      target:
        type: Utilization
        averageUtilization: 70
  - type: Resource
    resource:
      name: memory
      target:
        type: AverageValue
        averageValue: 150Mi
  - type: Pods
    pods:
      metric:
        name: nginx_http_requests
      target:
        type: AverageValue
        averageValue: 50
应用:
bash
[root@master30~] # kubectl apply -f hpa.yaml
horizontalpodautoscaler.autoscaling/nginx-hpa created
查看 HPA 状态:
bash
[root@master hpa]# kubectl get hpa
NAME         REFERENCE                       TARGETS                                    MINPODS   MAXPODS   REPLICAS   AGE
nginx-hpa    Deployment/nginx-with-exporter  0%/70%, 11583488/150Mi + 1 more...         1         5         2          2m16s
等待片刻,如果无负载,副本数将缩减为 1。
执行压测
获取 Service ClusterIP:
bash
[root@master30~] # kubectl get svc nginx
NAME    TYPE       CLUSTER-IP      EXTERNAL-IP   PORT(S)        AGE
nginx   NodePort   10.101.20.227   <none>        80:31002/TCP   18h
在另一个终端持续观察 Pod:
bash
[root@master ~]# watch kubectl get pods发起压测:
bash
[root@master30~] # ab -c 1000 -n 100000 http://10.101.20.227/观察 Pod 自动扩容至 5 个:
Every 2.0s: kubectl get pods                 master30.hgq.cloud: Thu Jul 30 12:04:35 2026

NAME                                   READY   STATUS    RESTARTS       AGE
nginx-with-exporter-56bf57d4dd-6t9zf   2/2     Running   0              42s
nginx-with-exporter-56bf57d4dd-bhldx   2/2     Running   0              23s
nginx-with-exporter-56bf57d4dd-lpczp   2/2     Running   0              42s
nginx-with-exporter-56bf57d4dd-rgpb8   2/2     Running   2 (3h6m ago)   18h
nginx-with-exporter-56bf57d4dd-w7bxn   2/2     Running   0              42s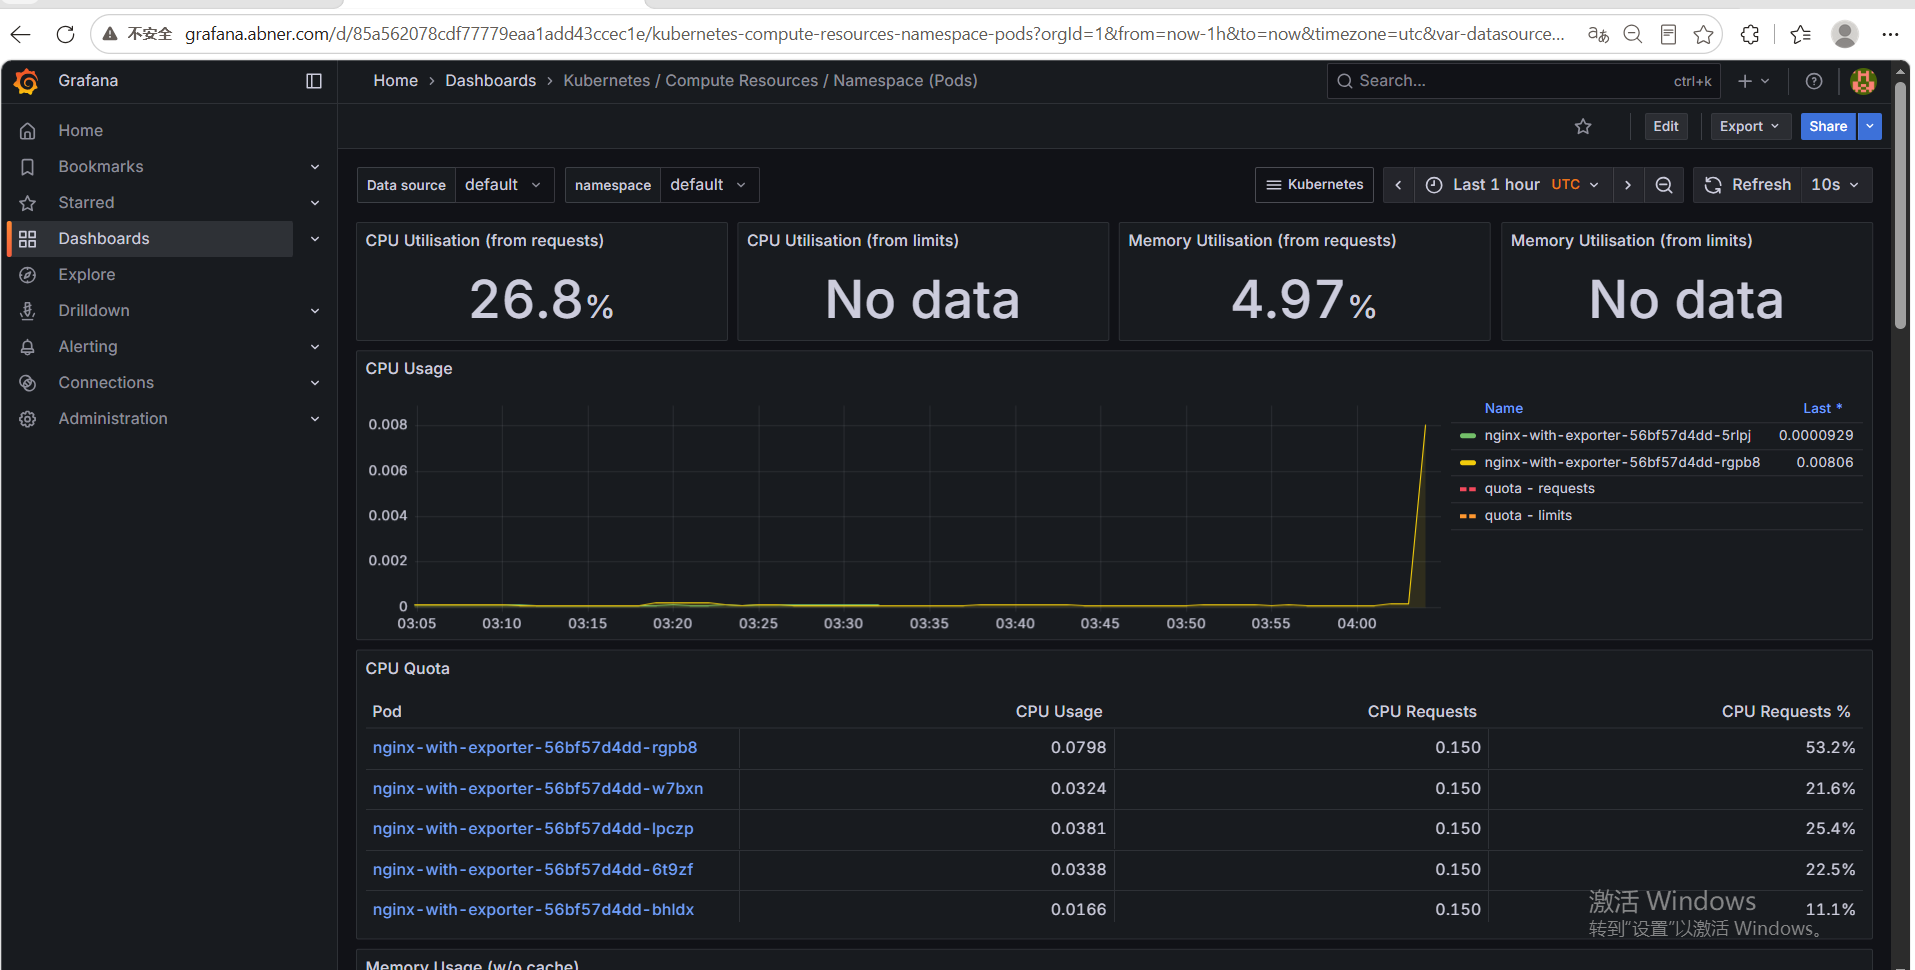
查看 HPA 事件:
bash
[root@master ~]# kubectl describe hpa nginx-hpa输出:
Events:
  Type     Reason             Age    From                       Message
  ----     ------             ----   ----                       -------
  Normal   SuccessfulRescale  35m    horizontal-pod-autoscaler  New size: 1; reason: All metrics below target
  Normal   SuccessfulRescale  3m     horizontal-pod-autoscaler  New size: 4; reason: pods metric nginx_http_requests above target
  Warning  FailedRescale      2m49s  horizontal-pod-autoscaler  New size: 5; reason: pods metric nginx_http_requests above target; error: Operation cannot be fulfilled on deployments.apps "nginx-with-exporter": the object has been modified; please apply your changes to the latest version and try again
  Normal   SuccessfulRescale  2m40s  horizontal-pod-autoscaler  New size: 5; reason: pods metric nginx_http_requests above target