2025年深圳杯数学建模
B题 LED显示屏颜色转换设计与校正
原题再现:
问题的背景
走在晚风都市,或春日田野,我们都会看到一个色彩斑斓的世界。色彩是我们对世界一种重要感知。什么是色彩,或颜色?颜色是光作用于人眼引起的视觉感知现象,它与物体的材质和光照有关,由物体反射(或发射)的电磁波特定波长决定,其本质是大脑对光刺激的神经信号处理的结果。
为了更好地复原现实世界的色彩,我们需要色彩采集设备(光谱色差仪、摄像机等)和显示设备(显示器等)。由于颜色记录设备(如:摄像机)的感知能力和颜色显示设备(如:LED显示器)的还原能力不完全一致,如何将记录设备的颜色逼真表达出来是高性能显示器的主要目标。
根据人眼视觉的特性,在彩色复现过程中,重要的是获得与原景物相同的彩色感觉,并不要求完全恢复原景物辐射光的光谱成分;而与某一颜色相同的彩色感觉,可由不同光谱分布的色光组合产生。如果适当选择三基色,将它们按不同比例进行合成,就可以引起各种不同的色彩感觉,合成彩色的亮度由这三个基色的亮度相加之和决定,而色度则由三个基色分量的比例决定。
根据三基色原理,可以采用不同的三色组合。但是在显示领域中,比较多的采用红色®、绿色(g)和蓝色(b)的光谱区域内选择三个基色。这样自然界中所能观察到的各种颜色,几乎都能由它们合成出来。
CIE 标准1,2
现代色度学采用国际照明委员会(CIE)所规定的一套颜色测量原理、数据和计算方法,称为 CIE 标准色度学系统。
1931CIE --RGB 颜色系统1
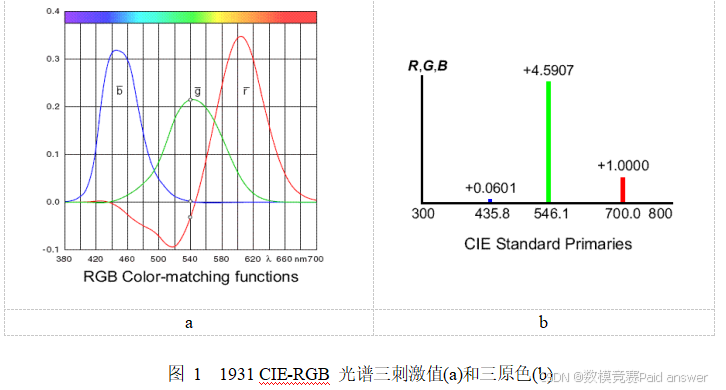
1931年CIE在 2°视场条件下,进行了专门的颜色混合匹配实验,定出匹配等能光谱色的 r (λ)、g(λ)、b (λ) (λ为光谱波长)光谱三刺激函数,这三个函数即上述中提到的大脑对光刺激神经信号的数学表达式,称为"1931 CIE-RGB 系统标准色度观察者光谱三刺激值",简称为"1931 CIE-RGB 光谱三刺激值"(图1a)。系统采用波长为700 nm的红、546.1nm的绿和435.8 nm 的蓝作为 ®、(G)、(B)三原色(图1b)。它们为色度学奠定了数学基础。
1931CIE -XYZ 颜色系统2
1931CIE-XYZ 颜色系统是在 1931CIE-RGB 颜色系统的基础上,用数学方法,选用三个理想的三原色 (X)、(Y)、(Z),将 1931CIE-RGB 系统中的光谱三刺激值r(λ)、g(λ)、b (λ) 和色度坐标 r、g、b 均变为正值。三原色 (X) 代表红原色,(Y)代表绿原色,(Z)代表蓝原色。 在(X)、(Y)、(Z) 系统上三原色x、y、z 与 1931CIE-RGB 系统的坐标r、 g、b 可以互相转换。通过线性变换成XYZ空间,再做归一化之后,最终便出现了在图2中的马蹄形的曲线。
问题: 如前面提到,在现实中颜色的显示设备的表达能力与记录设备的颜色感知能力并不完全一致,如何在现有显示能力下更好的表达记录的图像(或视频)是显示器颜色工程(如LED显示器颜色设计)的重要任务3。
问题1:颜色空间转换
图2所示为CIE1931的标准色空间,自然界中我们所观察到的所有颜色坐标都可以表示在这个马蹄形状的曲线内,每个坐标值表示的便是一种颜色。
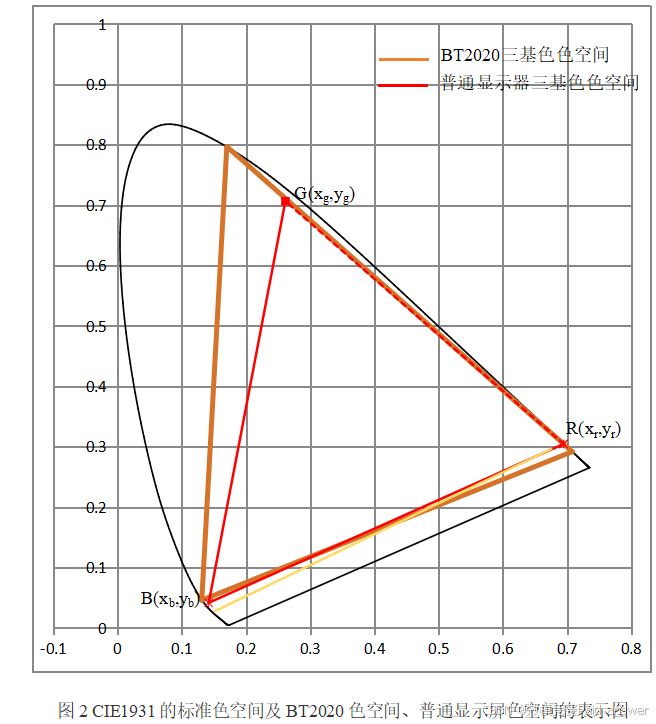
在图2中,棕色三角形表示BT20204标准的高清视频源的三基色色空间,而红色三角形表示的通常普通显示屏的RGB三基色空间,红色三角形所形成的色域比棕色的小,所表示出的颜色就比较少,显示器不能完全还原出视频源记录的颜色,从而导致色彩损失,但这是不可避免的。试定义合适的转换损失函数,设计视频源颜色空间到显示屏RGB颜色空间的转换映射,使色彩转换损失最小。
问题2:颜色空间转换(4通道到5通道)
为了最大程度的呈现大自然界的中颜色,通常将摄像机增加了一个颜色通道,即摄像机可以输出四基色视频源RGBV,从而扩大了色域空间的面积,坐标(包含亮度信号)分别为:
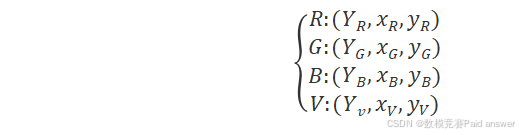
这里,YS(s表示R、G、B或V)为亮度信息。类似地,为了增强LED的显示能力,也可以设计成为五基色(通道)的显示屏RGBCX(图3 红色五边形所围起的五边形),试定义合适的颜色转换映射,将视频源4通道信号转化到五通道LED显示器上,使色颜色转换损失最小。
问题3:LED显示器颜色校正
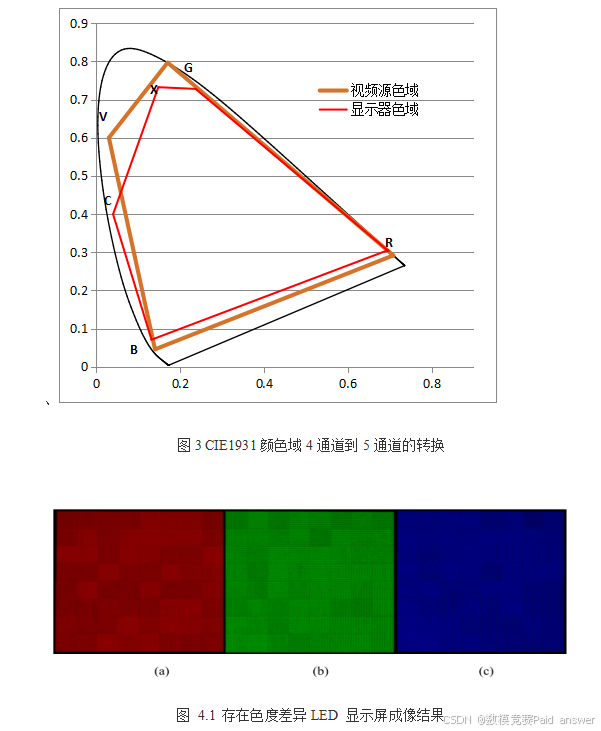
由于组成彩色LED全显示屏(如分辨率1920×1080)每个像素的发光器件内部色度存在差异,全彩LED模块显示屏的颜色即使全都在同样的标定值(220)下,呈现的色彩也会有差异。图4.1是R、G、B在标定值时显示的照片(颜色数据在附录中),可以看出显示不一致,不能满足高品质的显示需求。因此,我们需要利用颜色的合成特性将颜色进行校正,使显示器在标定值(220)下呈现如图4.2,即R、G、B的颜色输出是均匀一致的5。试根据你设计的(1)-(2) 色域转换结果应用在LED颜色校正中,将全屏颜色进行校正并运用在给的64×64的显示数据模块上。
附件:数据集:64×64x10 数据集合(注: 包括显示的目标值(每个像素设定为220)和每个受扰动的屏幕显示的R、G、B值)
整体求解过程概述(摘要)
LED显示屏的颜色复现问题本质上包含三个层级:首先是源色域与显示色域不一致引起的不可表示颜色;其次是多基色系统中同一目标颜色对应多个驱动解而产生的解不唯一性;最后是同一块屏幕不同像素的增益、串扰与稳定性不一致导致的空间不均匀性。本文把三问统一到"目标颜色---设备响应矩阵---有界驱动---感知损失"框架中,以 CIE 1931 XYZ 为线性物理空间、CIE La b* 与 CIEDE2000 色差为感知评价空间,并针对三种结构分别设计盒约束映射、正则化多通道映射和逐像素交替校正模型。
对问题一,先由题图内嵌数据精确提取 BT.2020 与普通 RGB 显示器的三基色色度坐标,计算两色域面积、交集和样本覆盖率;再建立以 ΔE00² 与亮度误差平方加权和为目标、显示驱动落在 0,1³ 内的非线性盒约束模型。求解时先在 XYZ 空间得到加权最小二乘暖启动,再用单调坐标细化直接优化感知损失。结果显示:普通屏色域面积为源色域的 79.34%,对源色域的几何覆盖率为 78.97%;与逐通道裁剪相比,所提模型使平均 ΔE00 下降 17.06%,平均复合感知损失下降 27.76%,且亮度误差同步减小。
对问题二,将 RGBV 四通道源和 RGBCX 五通道显示器均写为 XYZ 基色矩阵,并用 D65 白点约束求取非负白平衡权重。针对五通道的超定自由度,建立含颜色拟合项、功耗项和通道平滑项的严格凸二次规划,用投影梯度法求解。该模型把平均 ΔE00 从伪逆裁剪法的 0.2633 降至 0.0702,下降 73.33%;其 95% 分位色差从 1.6098 降至 0.0426,五个通道均得到稳定利用,说明额外基色不仅扩展色域,还能作为降低极端误差和改善驱动分配的冗余自由度。
对问题三,清洗附件的 9 个 64×64 实测分量矩阵,特别剔除 G_R 表中 A:I 列的 RAND 公式噪声,识别真正有效区间 J1:BU64。每个像素建立 3×3 响应矩阵 H(i,j),同时估计全屏共同可实现目标 T 与像素驱动 D(i,j),使颜色残差、目标偏移与校正码偏移的加权和最小。采用 80% 像素建模、20% 像素留出验证。全屏平均 ΔE00 下降 81.06%,RGB RMSE 由 8.7241 降至 1.7768,主分量平均变异系数下降 98.04%;留出集指标与建模集一致,噪声扰动和正则化敏感性分析也验证了模型的稳健性。
本文的特色在于:色度学量和工程码值各司其职;所有图表均由同一份代码自动生成;每幅图均给出作图依据、可读结论及其在建模链条中的作用。文末提供完整源代码、数据审计、算法伪代码和复现说明。
模型假设:
假设1:题面色度坐标与 CIE 1931 2° 标准观察者一致,色度图内嵌数据可作为精确输入,而不是从图片像素反向估读。
假设2:三问均采用 D65 参考白;每组基色的相对亮度权重由白点约束求得,从而避免任意指定各基色 Y 值。
假设3:码值在进入基色矩阵前已经线性化。若实际设备存在 gamma 或电光转换函数,应先反解 EOTF,校正后再正向编码。
假设4:问题一、二的显示基色在计算批次内稳定,基色相加满足线性叠加;光学串扰已被基色矩阵隐式吸收。
假设5:问题三附件给出的 9 个分量是驱动值 220 下的稳态响应,0---220 区间内可近似线性缩放;需要外推到更高码值时仍受 255 上限约束。
假设6:同一像素的 3×3 响应矩阵在一次校正周期内不随时间显著漂移,像素间差异大于短期测量漂移。
假设7:缺失值、公式噪声与真实测量区可通过尺寸、数值类型和连续 64×64 结构辨识;G_R 表 A:I 的 RAND 公式不属于实测数据。
假设8:80%/20% 像素随机划分能够代表整屏空间分布;固定随机种子保证留出验证可复现。
假设9:题目未给出功耗、电流和热约束的标定系数,因此问题二的功耗项使用驱动二范数作为代理量;其权重仅用于在近等色解中择优。
假设10:所有色差在同一白点和同一色适应条件下计算,不额外引入色适应变换。
问题分析:
问题一分析
对于每个源码值 s,先通过 BT.2020 基色矩阵得到目标 XYZ 向量 x。若 x 位于普通 RGB 显示器的有界平行六面体内,则理论上存在精确驱动;若在外部,则需在显示可达集合上寻找最优投影。由于 ΔE00 对 L*、C*、h* 的非线性加权更符合视觉,而亮度 Y 又直接影响高光层次,目标函数采用"感知色差平方 + 亮度误差平方"。求解上先利用 XYZ 二次项求稳定暖启动,再直接细化 ΔE00,可兼顾效率和感知质量。
问题二分析
RGBV 源经过 3×4 矩阵映射到 XYZ,RGBCX 显示端则经过 3×5 矩阵产生 XYZ。由于显示矩阵的零空间维数至少为 2,同一 XYZ 可对应一族五维驱动。颜色项决定"能否匹配",功耗正则项选择"使用多少总驱动",平滑/均衡项决定"冗余如何分配"。在 0,1⁵ 盒约束下,该问题可设计为凸二次规划,因此存在全局最优解且便于批量计算。
问题三分析
9 张响应表可在每个像素组装为 H(i,j):其列表示输入 R、G、B 的单位驱动方向,其行表示输出 R、G、B 分量。对目标向量 t,理想校正码为 H⁻¹t,但直接求逆有三项风险:测量噪声被放大、驱动可能越界、不同像素达到理论目标的可行集没有公共交集。因此采用带正则项的有界最小二乘,并把共同目标 T 也作为变量,通过交替最小化在"输出一致"和"接近220纯色"之间取得可实现平衡。
模型的建立与求解整体论文缩略图
全部论文请见下方" 只会建模 QQ名片" 点击QQ名片即可
程序代码:(代码和文档not free)
python
from __future__ import annotations
import argparse
import itertools
import json
import math
import zipfile
from pathlib import Path
from typing import Dict, Iterable, List, Mapping, Sequence, Tuple
import numpy as np
import pandas as pd
from openpyxl import load_workbook
from PIL import Image, ImageDraw, ImageFont
from lxml import etree
# ----------------------------- 参数与数据读取 -----------------------------
D65_XY = np.array([0.3127, 0.3290], dtype=float)
D65_XYZ = np.array([0.9504559271, 1.0, 1.0890577508], dtype=float)
RGB_SHEETS = ("R_R", "R_G", "R_B", "G_R", "G_G", "G_B", "B_R", "B_G", "B_B")
TARGET_CODE = 220.0
MAX_CODE = 255.0
def parse_args() -> argparse.Namespace:
p = argparse.ArgumentParser(description="LED显示屏颜色空间转换与64×64逐点校正")
p.add_argument("--input-docx", required=True, help="题目DOCX路径(用于提取内嵌色域坐标)")
p.add_argument("--input-xlsx", required=True, help="64×64 RGB测量附件路径")
p.add_argument("--output-dir", default="led_results", help="结果输出目录")
p.add_argument("--samples-q1", type=int, default=729, help="问题一颜色样本数,默认9^3=729")
p.add_argument("--samples-q2", type=int, default=1200, help="问题二Halton颜色样本数")
p.add_argument("--seed", type=int, default=20260804, help="稳健性验证随机种子")
return p.parse_args()
def _chart_series(root: etree._Element) -> List[dict]:
c = "http://schemas.openxmlformats.org/drawingml/2006/chart"
ns = {"c": c}
def values(node: etree._Element | None) -> List[float]:
if node is None:
return []
return [float(x) for x in node.xpath(".//c:numCache/c:pt/c:v/text()", namespaces=ns)]
out = []
for ser in root.xpath(".//c:ser", namespaces=ns):
title = ser.xpath("./c:tx/c:v/text()", namespaces=ns)
if not title:
title = ser.xpath("./c:tx/c:strRef/c:strCache/c:pt/c:v/text()", namespaces=ns)
xnode = ser.xpath("./c:xVal", namespaces=ns)
ynode = ser.xpath("./c:yVal", namespaces=ns)
out.append({
"title": title[0] if title else "unnamed",
"x": values(xnode[0] if xnode else None),
"y": values(ynode[0] if ynode else None),
})
return out
def extract_gamuts_from_docx(path: Path) -> dict:
"""从题目DOCX的两个散点图缓存中提取坐标,避免从截图估读。"""
with zipfile.ZipFile(path) as zf:
chart1 = etree.fromstring(zf.read("word/charts/chart1.xml"))
chart2 = etree.fromstring(zf.read("word/charts/chart2.xml"))
s1 = _chart_series(chart1)
s2 = _chart_series(chart2)
locus = np.column_stack([s1[0]["x"], s1[0]["y"]])
bt = next(s for s in s1 if s["title"] == "BT2020")
ordinary_candidates = [s for s in s1[1:] if len(s["x"]) >= 4 and s["title"] != "BT2020"]
if not ordinary_candidates:
raise ValueError("无法从chart1提取普通RGB色域")
ordinary = ordinary_candidates[0]
video = next(s for s in s2 if s["title"] == "视频源色域")
display = next(s for s in s2 if s["title"] == "显示器色域")
return {
"locus": locus,
"q1_source": np.column_stack([bt["x"][:3], bt["y"][:3]]),
"q1_display": np.column_stack([ordinary["x"][:3], ordinary["y"][:3]]),
"q2_source": np.column_stack([video["x"][:4], video["y"][:4]]),
"q2_display": np.column_stack([display["x"][:5], display["y"][:5]]),
}
def _find_64_numeric_block(ws) -> Tuple[np.ndarray, str]:
"""寻找前64行中连续64列的纯数值块;自动绕过G_R中多出的9列RAND公式。"""
row_count = 64
good_cols = []
for c in range(1, ws.max_column + 1):
vals = [ws.cell(r, c).value for r in range(1, row_count + 1)]
good_cols.append(all(isinstance(v, (int, float)) and not isinstance(v, bool) for v in vals))
runs = []
start = None
for i, good in enumerate(good_cols + [False], start=1):
if good and start is None:
start = i
elif not good and start is not None:
runs.append((start, i - 1))
start = None
candidates = [(a, b) for a, b in runs if b - a + 1 >= 64]
if not candidates:
raise ValueError(f"工作表{ws.title}中未找到64×64连续数值块")
# 优先取最长连续块;若超过64列则取其最右64列,适配G_R的J:BU有效区。
a, b = max(candidates, key=lambda x: (x[1] - x[0] + 1, x[1]))
a = b - 63
arr = np.array([[float(ws.cell(r, c).value) for c in range(a, b + 1)] for r in range(1, 65)], dtype=float)
return arr, f"{ws.cell(1, a).coordinate.split('1')[0]}1:{ws.cell(64, b).coordinate}"
def load_measurements(path: Path) -> Tuple[Dict[str, np.ndarray], dict]:
wb = load_workbook(path, data_only=False, read_only=False)
data: Dict[str, np.ndarray] = {}
ranges = {}
for name in RGB_SHEETS:
if name not in wb.sheetnames:
raise KeyError(f"附件缺少工作表:{name}")
data[name], ranges[name] = _find_64_numeric_block(wb[name])
target, target_range = _find_64_numeric_block(wb["RGB目标值"])
wb.close()
metadata = {
"valid_ranges": ranges,
"target_range": target_range,
"target_unique": np.unique(target).tolist(),
"g_r_noise_removed": ranges["G_R"].startswith("J1"),
}
return data, metadata
def build_pixel_response(data: Mapping[str, np.ndarray]) -> Tuple[np.ndarray, np.ndarray]:
"""返回原始测量A和归一化响应H;A[p,:,j]是驱动第j基色220时的三分量输出。"""
n = 64 * 64
a = np.empty((n, 3, 3), dtype=float)
for j, lead in enumerate(("R", "G", "B")):
for i, out in enumerate(("R", "G", "B")):
a[:, i, j] = data[f"{lead}_{out}"].reshape(-1)
return a, a / TARGET_CODE
# ----------------------------- 色度学与几何工具 -----------------------------
def xy_to_xyz(xy: np.ndarray, y_luminance: float | np.ndarray = 1.0) -> np.ndarray:
xy = np.asarray(xy, dtype=float)
x, y = xy[..., 0], np.maximum(xy[..., 1], 1e-12)
yy = np.asarray(y_luminance, dtype=float)
return np.stack([x * yy / y, np.broadcast_to(yy, x.shape), (1.0 - x - y) * yy / y], axis=-1)
def xyz_to_xy(xyz: np.ndarray) -> np.ndarray:
xyz = np.asarray(xyz, dtype=float)
s = np.sum(xyz, axis=-1, keepdims=True)
return np.divide(xyz[..., :2], s, out=np.zeros_like(xyz[..., :2]), where=s > 1e-12)
def primary_matrix_three(primaries_xy: np.ndarray, white_xy: np.ndarray = D65_XY) -> np.ndarray:
p = xy_to_xyz(np.asarray(primaries_xy, float), 1.0).T
white = xy_to_xyz(np.asarray(white_xy, float), 1.0)
scales = np.linalg.solve(p, white)
return p @ np.diag(scales)
def projected_nonnegative_white_weights(p: np.ndarray, white: np.ndarray, reg: float = 1e-5) -> np.ndarray:
"""为多基色系统求非负亮度权,使全通道白场逼近D65。"""
m = p.shape[1]
q = np.full(m, 1.0 / m)
h = p.T @ p + reg * np.eye(m)
g0 = p.T @ white + reg * np.full(m, 1.0 / m)
step = 0.95 / max(np.linalg.eigvalsh(h).max(), 1e-9)
for _ in range(5000):
q_new = np.maximum(0.0, q - step * (h @ q - g0))
if np.max(np.abs(q_new - q)) < 1e-13:
q = q_new
break
q = q_new
return q
def primary_matrix_multi(primaries_xy: np.ndarray, white_xy: np.ndarray = D65_XY) -> Tuple[np.ndarray, np.ndarray]:
p = xy_to_xyz(np.asarray(primaries_xy, float), 1.0).T
white = xy_to_xyz(np.asarray(white_xy, float), 1.0)
q = projected_nonnegative_white_weights(p, white)
return p @ np.diag(q), q
def polygon_area(poly: np.ndarray) -> float:
p = np.asarray(poly, float)
return 0.5 * abs(float(np.dot(p[:, 0], np.roll(p[:, 1], -1)) - np.dot(p[:, 1], np.roll(p[:, 0], -1))))
def _ccw(poly: np.ndarray) -> np.ndarray:
p = np.asarray(poly, float)
signed = 0.5 * float(np.dot(p[:, 0], np.roll(p[:, 1], -1)) - np.dot(p[:, 1], np.roll(p[:, 0], -1)))
return p if signed > 0 else p[::-1]
def convex_intersection(subject: np.ndarray, clipper: np.ndarray) -> np.ndarray:
"""Sutherland-Hodgman凸多边形裁剪。"""
output = [x.copy() for x in _ccw(subject)]
cp = _ccw(clipper)
def inside(p, a, b):
u, v = b - a, p - a
return u[0] * v[1] - u[1] * v[0] >= -1e-12
def intersect(s, e, a, b):
r, q = e - s, b - a
den = r[0] * q[1] - r[1] * q[0]
if abs(den) < 1e-14:
return e
z = a - s
t = (z[0] * q[1] - z[1] * q[0]) / den
return s + t * r
for a, b in zip(cp, np.roll(cp, -1, axis=0)):
inp = output
output = []
if not inp:
break
s = inp[-1]
for e in inp:
if inside(e, a, b):
if not inside(s, a, b):
output.append(intersect(s, e, a, b))
output.append(e)
elif inside(s, a, b):
output.append(intersect(s, e, a, b))
s = e
return np.asarray(output, float)
def halton(n: int, dim: int, start: int = 1) -> np.ndarray:
primes = [2, 3, 5, 7, 11, 13, 17]
if dim > len(primes):
raise ValueError("Halton维数过大")
def radical(i: int, base: int) -> float:
f, out = 1.0 / base, 0.0
while i:
out += f * (i % base)
i //= base
f /= base
return out
return np.array([[radical(i, primes[j]) for j in range(dim)] for i in range(start, start + n)], dtype=float)
def grid_rgb(n_samples: int) -> np.ndarray:
levels = max(3, int(round(n_samples ** (1.0 / 3.0))))
vals = np.linspace(0.0, 1.0, levels)
return np.array(list(itertools.product(vals, repeat=3)), dtype=float)
def xyz_to_lab(xyz: np.ndarray, white: np.ndarray = D65_XYZ) -> np.ndarray:
x = np.asarray(xyz, float) / np.asarray(white, float)
delta = 6.0 / 29.0
f = np.where(x > delta ** 3, np.cbrt(np.maximum(x, 0)), x / (3 * delta ** 2) + 4.0 / 29.0)
return np.stack([116 * f[..., 1] - 16, 500 * (f[..., 0] - f[..., 1]), 200 * (f[..., 1] - f[..., 2])], axis=-1)
def ciede2000(lab1: np.ndarray, lab2: np.ndarray) -> np.ndarray:
"""Sharma-Wu-Dalal版本的向量化CIEDE2000,参数因子均取1。"""
l1, a1, b1 = np.moveaxis(np.asarray(lab1, float), -1, 0)
l2, a2, b2 = np.moveaxis(np.asarray(lab2, float), -1, 0)
c1 = np.hypot(a1, b1)
c2 = np.hypot(a2, b2)
cbar = (c1 + c2) / 2
g = 0.5 * (1 - np.sqrt(cbar ** 7 / (cbar ** 7 + 25 ** 7 + 1e-30)))
ap1, ap2 = (1 + g) * a1, (1 + g) * a2
cp1, cp2 = np.hypot(ap1, b1), np.hypot(ap2, b2)
hp1 = np.mod(np.degrees(np.arctan2(b1, ap1)), 360.0)
hp2 = np.mod(np.degrees(np.arctan2(b2, ap2)), 360.0)
hp1 = np.where((ap1 == 0) & (b1 == 0), 0, hp1)
hp2 = np.where((ap2 == 0) & (b2 == 0), 0, hp2)
dl = l2 - l1
dc = cp2 - cp1
dh_deg = hp2 - hp1
dh_deg = np.where(cp1 * cp2 == 0, 0, dh_deg)
dh_deg = np.where(dh_deg > 180, dh_deg - 360, dh_deg)
dh_deg = np.where(dh_deg < -180, dh_deg + 360, dh_deg)
dh = 2 * np.sqrt(cp1 * cp2) * np.sin(np.radians(dh_deg / 2))
lbar = (l1 + l2) / 2
cpbar = (cp1 + cp2) / 2
hsum = hp1 + hp2
hdiff = np.abs(hp1 - hp2)
hpbar = np.where(cp1 * cp2 == 0, hsum, np.where(hdiff <= 180, hsum / 2, np.where(hsum < 360, (hsum + 360) / 2, (hsum - 360) / 2)))
t = 1 - 0.17 * np.cos(np.radians(hpbar - 30)) + 0.24 * np.cos(np.radians(2 * hpbar)) + 0.32 * np.cos(np.radians(3 * hpbar + 6)) - 0.20 * np.cos(np.radians(4 * hpbar - 63))
sl = 1 + 0.015 * (lbar - 50) ** 2 / np.sqrt(20 + (lbar - 50) ** 2)
sc = 1 + 0.045 * cpbar
sh = 1 + 0.015 * cpbar * t
dtheta = 30 * np.exp(-((hpbar - 275) / 25) ** 2)
rc = 2 * np.sqrt(cpbar ** 7 / (cpbar ** 7 + 25 ** 7 + 1e-30))
rt = -rc * np.sin(np.radians(2 * dtheta))
return np.sqrt(np.maximum(0, (dl / sl) ** 2 + (dc / sc) ** 2 + (dh / sh) ** 2 + rt * (dc / sc) * (dh / sh)))
SRGB_M = np.array([[0.4124564, 0.3575761, 0.1804375], [0.2126729, 0.7151522, 0.0721750], [0.0193339, 0.1191920, 0.9503041]], float)
SRGB_INV = np.linalg.inv(SRGB_M)
def linear_rgb_to_srgb(rgb: np.ndarray) -> np.ndarray:
x = np.clip(np.asarray(rgb, float), 0, 1)
return np.where(x <= 0.0031308, 12.92 * x, 1.055 * np.power(x, 1 / 2.4) - 0.055)
def xyz_to_display_rgb(xyz: np.ndarray) -> np.ndarray:
linear = np.asarray(xyz, float) @ SRGB_INV.T
return linear_rgb_to_srgb(linear)
# ----------------------------- 盒约束凸二次规划 -----------------------------
def projected_box_qp(
a: np.ndarray,
b: np.ndarray,
reg_matrix: np.ndarray | None = None,
reg_target: np.ndarray | None = None,
lower: float = 0.0,
upper: float = 1.0,
iterations: int = 600,
tol: float = 1e-11,
) -> np.ndarray:
"""批量求min ||A x-b||² + x'R x -2r'x, s.t. lower<=x<=upper。"""
a = np.asarray(a, float)
b = np.atleast_2d(np.asarray(b, float))
m = a.shape[1]
rmat = np.zeros((m, m)) if reg_matrix is None else np.asarray(reg_matrix, float)
rvec = np.zeros(m) if reg_target is None else np.asarray(reg_target, float)
h = a.T @ a + rmat
rhs = b @ a - rvec[None, :] * (-1.0) # 等价于A'b+r,采用行向量写法
# 上式整理为rhs=b A + r;reg_target按线性奖励向量r传入。
if reg_target is not None:
rhs = b @ a + np.asarray(reg_target, float)[None, :]
try:
x0 = np.linalg.solve(h + 1e-12 * np.eye(m), rhs.T).T
except np.linalg.LinAlgError:
x0 = rhs @ np.linalg.pinv(h)
x = np.clip(x0, lower, upper)
step = 0.95 / max(float(np.linalg.eigvalsh(h).max()), 1e-12)
for _ in range(iterations):
grad = x @ h - rhs
x_new = np.clip(x - step * grad, lower, upper)
if float(np.max(np.abs(x_new - x))) < tol:
x = x_new
break
x = x_new
return x
def projected_varying_qp(hmat: np.ndarray, target: np.ndarray, u0: np.ndarray, ridge: float, initial: np.ndarray | None = None, iterations: int = 300) -> np.ndarray:
"""逐像素求min ||H_p u_p-t||²+ridge||u_p-u0||², 0<=u<=255。"""
n = hmat.shape[0]
target = np.broadcast_to(np.asarray(target, float), (n, 3))
u0 = np.broadcast_to(np.asarray(u0, float), (n, 3))
u = np.clip(u0.copy() if initial is None else np.asarray(initial, float).copy(), 0, MAX_CODE)
ht = np.transpose(hmat, (0, 2, 1))
hessian = np.einsum("nij,njk->nik", ht, hmat) + ridge * np.eye(3)[None, :, :]
rhs = np.einsum("nij,nj->ni", ht, target) + ridge * u0
lips = np.linalg.eigvalsh(hessian)[:, -1]
step = 0.92 / np.maximum(lips, 1e-9)
for _ in range(iterations):
grad = np.einsum("nij,nj->ni", hessian, u) - rhs
u_new = np.clip(u - step[:, None] * grad, 0, MAX_CODE)
if float(np.max(np.abs(u_new - u))) < 2e-8:
u = u_new
break
u = u_new
return u
# ----------------------------- 三个问题的模型求解 -----------------------------
def _metric_row(name: str, xyz_ref: np.ndarray, xyz_out: np.ndarray, codes: np.ndarray) -> dict:
de = ciede2000(xyz_to_lab(xyz_ref), xyz_to_lab(xyz_out))
yerr = np.abs(xyz_out[:, 1] - xyz_ref[:, 1])
return {
"方法": name,
"平均ΔE00": float(np.mean(de)),
"ΔE00中位数": float(np.median(de)),
"ΔE00_95分位": float(np.quantile(de, 0.95)),
"最大ΔE00": float(np.max(de)),
"平均绝对亮度误差": float(np.mean(yerr)),
"95%亮度误差": float(np.quantile(yerr, 0.95)),
"平均复合感知损失": float(np.mean(de ** 2 + 0.12 * (100 * yerr) ** 2)),
"通道饱和样本率": float(np.mean(np.any((codes <= 1e-8) | (codes >= 1 - 1e-8), axis=1))),
"平均通道驱动和": float(np.mean(np.sum(codes, axis=1))),
}
def refine_q1_perceptual(x0: np.ndarray, xyz_ref: np.ndarray, m_dst: np.ndarray) -> np.ndarray:
"""以凸解为初值,盒内单调坐标搜索ΔE00²+亮度项;每次更新都不增大目标。"""
lab_ref = xyz_to_lab(xyz_ref)
def objective(codes: np.ndarray) -> np.ndarray:
xyz = codes @ m_dst.T
de = ciede2000(lab_ref if len(codes) == len(lab_ref) else np.repeat(lab_ref, len(codes) // len(lab_ref), axis=0), xyz_to_lab(xyz))
ref_y = xyz_ref[:, 1] if len(codes) == len(xyz_ref) else np.tile(xyz_ref[:, 1], len(codes) // len(xyz_ref))
return de ** 2 + 0.12 * (100 * (xyz[:, 1] - ref_y)) ** 2
x = np.clip(np.asarray(x0, float).copy(), 0, 1)
current = objective(x)
directions = np.vstack([np.zeros((1, 3)), np.eye(3), -np.eye(3)])
for step in (0.06, 0.03, 0.015, 0.0075, 0.0035, 0.0015, 0.0007, 0.0003):
for _ in range(5):
candidates = np.clip(x[None, :, :] + step * directions[:, None, :], 0, 1)
flat = candidates.reshape(-1, 3)
lab_ref_rep = np.tile(lab_ref, (len(directions), 1))
xyz_ref_rep = np.tile(xyz_ref, (len(directions), 1))
xyz_flat = flat @ m_dst.T
de = ciede2000(lab_ref_rep, xyz_to_lab(xyz_flat))
yerr = xyz_flat[:, 1] - xyz_ref_rep[:, 1]
obj = (de ** 2 + 0.12 * (100 * yerr) ** 2).reshape(len(directions), len(x))
choose = np.argmin(obj, axis=0)
best = obj[choose, np.arange(len(x))]
improved = best < current - 1e-13
if not np.any(improved):
break
x[improved] = candidates[choose[improved], np.where(improved)[0]]
current[improved] = best[improved]
return x
def solve_question1(gamuts: dict, n_samples: int) -> dict:
src_xy = gamuts["q1_source"]
dst_xy = gamuts["q1_display"]
m_src = primary_matrix_three(src_xy)
m_dst = primary_matrix_three(dst_xy)
src_codes = grid_rgb(n_samples)
xyz_src = src_codes @ m_src.T
raw = xyz_src @ np.linalg.inv(m_dst).T
baseline = np.clip(raw, 0.0, 1.0)
xyz_baseline = baseline @ m_dst.T
# Y分量权重较高,保证色域压缩时优先保持亮度;盒约束使显示码物理可实现。
w = np.diag([1.0, 2.6, 1.0])
warm = projected_box_qp(w @ m_dst, xyz_src @ w.T, reg_matrix=2e-7 * np.eye(3))
# 在直接裁剪和凸加权解之间逐样本选择较优初值,再精修复合感知损失。
def q1_obj(codes):
xyz = codes @ m_dst.T
de = ciede2000(xyz_to_lab(xyz_src), xyz_to_lab(xyz))
return de ** 2 + 0.12 * (100 * (xyz[:, 1] - xyz_src[:, 1])) ** 2
choose_warm = q1_obj(warm) < q1_obj(baseline)
start = baseline.copy()
start[choose_warm] = warm[choose_warm]
proposed = refine_q1_perceptual(start, xyz_src, m_dst)
xyz_proposed = proposed @ m_dst.T
in_gamut = np.all((raw >= -1e-9) & (raw <= 1 + 1e-9), axis=1)
inter = convex_intersection(src_xy, dst_xy)
area_src, area_dst = polygon_area(src_xy), polygon_area(dst_xy)
area_inter = polygon_area(inter) if len(inter) >= 3 else 0.0
metrics = pd.DataFrame([
_metric_row("逐通道裁剪", xyz_src, xyz_baseline, baseline),
_metric_row("ΔE00-亮度联合盒约束映射", xyz_src, xyz_proposed, proposed),
])
de_baseline = ciede2000(xyz_to_lab(xyz_src), xyz_to_lab(xyz_baseline))
de_proposed = ciede2000(xyz_to_lab(xyz_src), xyz_to_lab(xyz_proposed))
return {
"source_xy": src_xy,
"display_xy": dst_xy,
"source_matrix": m_src,
"display_matrix": m_dst,
"source_codes": src_codes,
"xyz_source": xyz_src,
"raw_display_codes": raw,
"baseline_codes": baseline,
"proposed_codes": proposed,
"xyz_baseline": xyz_baseline,
"xyz_proposed": xyz_proposed,
"de_baseline": de_baseline,
"de_proposed": de_proposed,
"in_gamut": in_gamut,
"metrics": metrics,
"gamut": {
"source_area": area_src,
"display_area": area_dst,
"intersection_area": area_inter,
"display_to_source_area_ratio": area_dst / area_src,
"source_coverage_ratio": area_inter / area_src,
"sample_in_gamut_ratio": float(np.mean(in_gamut)),
},
}
def solve_question2(gamuts: dict, n_samples: int) -> dict:
src_xy = gamuts["q2_source"]
dst_xy = gamuts["q2_display"]
a4, q4 = primary_matrix_multi(src_xy)
a5, q5 = primary_matrix_multi(dst_xy)
src_codes = halton(max(n_samples, 20), 4)
anchors = np.vstack([np.zeros((1, 4)), np.eye(4), np.ones((1, 4))])
src_codes = np.vstack([anchors, src_codes])
xyz_src = src_codes @ a4.T
pinv = np.linalg.pinv(a5)
raw = xyz_src @ pinv.T
baseline = np.clip(raw, 0.0, 1.0)
xyz_baseline = baseline @ a5.T
# 五通道冗余解中加入功耗和相邻基色驱动平滑项,减少极端码值与病态解。
l = np.zeros((5, 5))
for i in range(5):
l[i, i] = 1
l[i, (i + 1) % 5] = -1
reg_power = 2.5e-5
reg_smooth = 7.5e-5
reg = reg_power * np.eye(5) + reg_smooth * (l.T @ l)
w = np.diag([1.0, 2.6, 1.0])
proposed = projected_box_qp(w @ a5, xyz_src @ w.T, reg_matrix=reg, iterations=900)
xyz_proposed = proposed @ a5.T
inter = convex_intersection(src_xy, dst_xy)
area_src, area_dst = polygon_area(src_xy), polygon_area(dst_xy)
area_inter = polygon_area(inter) if len(inter) >= 3 else 0.0
metrics = pd.DataFrame([
_metric_row("伪逆后裁剪", xyz_src, xyz_baseline, baseline),
_metric_row("正则化五通道盒约束映射", xyz_src, xyz_proposed, proposed),
])
de_baseline = ciede2000(xyz_to_lab(xyz_src), xyz_to_lab(xyz_baseline))
de_proposed = ciede2000(xyz_to_lab(xyz_src), xyz_to_lab(xyz_proposed))
utilization = pd.DataFrame({
"通道": list("RGCXB"),
"平均驱动": proposed.mean(axis=0),
"95%分位驱动": np.quantile(proposed, 0.95, axis=0),
"非零使用率": np.mean(proposed > 1e-5, axis=0),
"满码率": np.mean(proposed >= 1 - 1e-6, axis=0),
})
return {
"source_xy": src_xy,
"display_xy": dst_xy,
"source_matrix": a4,
"display_matrix": a5,
"source_white_weights": q4,
"display_white_weights": q5,
"source_codes": src_codes,
"xyz_source": xyz_src,
"raw_display_codes": raw,
"baseline_codes": baseline,
"proposed_codes": proposed,
"xyz_baseline": xyz_baseline,
"xyz_proposed": xyz_proposed,
"de_baseline": de_baseline,
"de_proposed": de_proposed,
"metrics": metrics,
"utilization": utilization,
"regularization": {"power": reg_power, "smooth": reg_smooth},
"gamut": {
"source_area": area_src,
"display_area": area_dst,
"intersection_area": area_inter,
"display_to_source_area_ratio": area_dst / area_src,
"source_coverage_ratio": area_inter / area_src,
},
}
def _measured_rgb_to_lab(rgb_code: np.ndarray) -> np.ndarray:
# 附件未给光谱功率分布,故把相机/色差仪RGB分量视为线性相对量,用sRGB-D65矩阵作统一评价代理。
rgb = np.clip(np.asarray(rgb_code, float) / MAX_CODE, 0, 1)
xyz = rgb @ SRGB_M.T
return xyz_to_lab(xyz)
def calibrate_pixels(hmat: np.ndarray, train_mask: np.ndarray, ridge: float = 8e-4, target_anchor: float = 256.0, outer_iterations: int = 18) -> Tuple[np.ndarray, np.ndarray, np.ndarray]:
"""联合估计公共可达目标T*和每像素三组驱动码;交替最小化的是联合凸二次目标。"""
n = hmat.shape[0]
ideal = TARGET_CODE * np.eye(3) # 行为目标基色,列为输出RGB分量
target = ideal.copy()
drives = np.zeros((n, 3, 3), dtype=float) # [像素,目标基色,驱动通道]
for j in range(3):
drives[:, j, j] = TARGET_CODE
for _ in range(outer_iterations):
old = target.copy()
for j in range(3):
u0 = ideal[j]
drives[:, j, :] = projected_varying_qp(hmat, target[j], u0, ridge, initial=drives[:, j, :], iterations=220)
predicted = np.einsum("nod,ntd->nto", hmat, drives)
target = (predicted[train_mask].sum(axis=0) + target_anchor * ideal) / (int(train_mask.sum()) + target_anchor)
if float(np.max(np.abs(target - old))) < 2e-7:
break
predicted = np.einsum("nod,ntd->nto", hmat, drives)
return target, drives, predicted
def _calibration_metrics(before: np.ndarray, after: np.ndarray, target: np.ndarray, drives: np.ndarray, mask: np.ndarray, label: str) -> dict:
b = before[mask]
a = after[mask]
t = np.broadcast_to(target[None, :, :], a.shape)
de_b = ciede2000(_measured_rgb_to_lab(b.reshape(-1, 3)), _measured_rgb_to_lab(t.reshape(-1, 3)))
de_a = ciede2000(_measured_rgb_to_lab(a.reshape(-1, 3)), _measured_rgb_to_lab(t.reshape(-1, 3)))
main_b = np.stack([b[:, j, j] for j in range(3)], axis=1)
main_a = np.stack([a[:, j, j] for j in range(3)], axis=1)
return {
"数据集": label,
"校正前平均ΔE00": float(np.mean(de_b)),
"校正后平均ΔE00": float(np.mean(de_a)),
"校正前ΔE00_95分位": float(np.quantile(de_b, 0.95)),
"校正后ΔE00_95分位": float(np.quantile(de_a, 0.95)),
"校正前RGB_RMSE": float(np.sqrt(np.mean((b - t) ** 2))),
"校正后RGB_RMSE": float(np.sqrt(np.mean((a - t) ** 2))),
"校正前主分量平均CV": float(np.mean(np.std(main_b, axis=0) / np.mean(main_b, axis=0))),
"校正后主分量平均CV": float(np.mean(np.std(main_a, axis=0) / np.mean(main_a, axis=0))),
"校正码限幅率": float(np.mean((drives[mask] <= 1e-7) | (drives[mask] >= MAX_CODE - 1e-7))),
}
def solve_question3(a_raw: np.ndarray, hmat: np.ndarray, seed: int) -> dict:
n = len(hmat)
rows, cols = np.indices((64, 64))
train_mask = ((rows + 2 * cols) % 5 != 0).reshape(-1)
holdout_mask = ~train_mask
before = np.transpose(a_raw, (0, 2, 1)) # [像素,目标基色,输出分量]
ridge = 8e-4
target, drives, predicted = calibrate_pixels(hmat, train_mask, ridge=ridge)
metrics = pd.DataFrame([
_calibration_metrics(before, predicted, target, drives, train_mask, "建模像素(80%)"),
_calibration_metrics(before, predicted, target, drives, holdout_mask, "留出验证像素(20%)"),
_calibration_metrics(before, predicted, target, drives, np.ones(n, dtype=bool), "全屏"),
])
# 全屏逐基色均匀性指标。
uniformity_rows = []
for j, name in enumerate("RGB"):
for stage, arr in (("校正前", before), ("校正后", predicted)):
main = arr[:, j, j]
uniformity_rows.append({
"基色": name,
"阶段": stage,
"均值": float(np.mean(main)),
"标准差": float(np.std(main)),
"变异系数": float(np.std(main) / np.mean(main)),
"极差": float(np.ptp(main)),
"5%-95%跨度": float(np.quantile(main, 0.95) - np.quantile(main, 0.05)),
"最小/最大均匀度": float(np.min(main) / np.max(main)),
})
uniformity = pd.DataFrame(uniformity_rows)
condition = np.linalg.cond(hmat)
mean_matrix = np.mean(a_raw, axis=0)
std_matrix = np.std(a_raw, axis=0)
# 稳健性:测量矩阵加入标准差0.5、1.0、2.0码的扰动,保持已求驱动码不变。
rng = np.random.default_rng(seed)
robustness = []
target_full = np.broadcast_to(target[None, :, :], predicted.shape)
for sigma in (0.0, 0.5, 1.0, 2.0):
des = hmat + rng.normal(0.0, sigma / TARGET_CODE, hmat.shape)
des = np.maximum(des, 0.0)
out = np.einsum("nod,ntd->nto", des, drives)
de = ciede2000(_measured_rgb_to_lab(out.reshape(-1, 3)), _measured_rgb_to_lab(target_full.reshape(-1, 3)))
robustness.append({"测量扰动标准差/码值": sigma, "平均ΔE00": float(np.mean(de)), "95%分位ΔE00": float(np.quantile(de, 0.95)), "RGB_RMSE": float(np.sqrt(np.mean((out - target_full) ** 2)))})
robustness = pd.DataFrame(robustness)
# 正则化灵敏度:固定公共目标,重新计算留出集驱动。
sensitivity = []
for lam in (0.0, 1e-4, 8e-4, 3e-3, 1e-2):
d = np.zeros_like(drives)
for j in range(3):
d[:, j, :] = projected_varying_qp(hmat, target[j], TARGET_CODE * np.eye(3)[j], lam, iterations=220)
out = np.einsum("nod,ntd->nto", hmat, d)
de = ciede2000(_measured_rgb_to_lab(out[holdout_mask].reshape(-1, 3)), _measured_rgb_to_lab(target_full[holdout_mask].reshape(-1, 3)))
sensitivity.append({"正则化系数": lam, "留出集平均ΔE00": float(np.mean(de)), "校正码限幅率": float(np.mean((d <= 1e-7) | (d >= MAX_CODE - 1e-7))), "相对220平均改变量": float(np.mean(np.abs(d - TARGET_CODE * np.eye(3)[None, :, :])))})
sensitivity = pd.DataFrame(sensitivity)
de_before = ciede2000(_measured_rgb_to_lab(before.reshape(-1, 3)), _measured_rgb_to_lab(target_full.reshape(-1, 3))).reshape(n, 3)
de_after = ciede2000(_measured_rgb_to_lab(predicted.reshape(-1, 3)), _measured_rgb_to_lab(target_full.reshape(-1, 3))).reshape(n, 3)
return {
"target": target,
"drives": drives,
"before": before,
"after": predicted,
"de_before": de_before,
"de_after": de_after,
"condition": condition,
"mean_matrix": mean_matrix,
"std_matrix": std_matrix,
"metrics": metrics,
"uniformity": uniformity,
"robustness": robustness,
"sensitivity": sensitivity,
"train_mask": train_mask,
"ridge": ridge,
}
# ----------------------------- 轻量数据可视化(Pillow) -----------------------------
PALETTE = ["#2673B8", "#E58A2B", "#2E9B74", "#C64E52", "#8065A8", "#4AA3A2", "#D5A31A"]
INK = "#17212B"
GRID = "#D9E2EA"
MUTED = "#687785"
def font(size: int, bold: bool = False) -> ImageFont.FreeTypeFont:
candidates = [
Path("C:/Windows/Fonts/msyhbd.ttc" if bold else "C:/Windows/Fonts/msyh.ttc"),
Path("C:/Windows/Fonts/simhei.ttf" if bold else "C:/Windows/Fonts/simsun.ttc"),
Path("C:/Windows/Fonts/arialbd.ttf" if bold else "C:/Windows/Fonts/arial.ttf"),
]
for p in candidates:
if p.exists():
return ImageFont.truetype(str(p), size=size)
return ImageFont.load_default()
def canvas(title: str, width: int = 1800, height: int = 1050) -> Tuple[Image.Image, ImageDraw.ImageDraw]:
img = Image.new("RGB", (width, height), "white")
d = ImageDraw.Draw(img)
d.text((width // 2, 45), title, fill=INK, font=font(42, True), anchor="ma")
return img, d
def save_img(img: Image.Image, path: Path) -> None:
path.parent.mkdir(parents=True, exist_ok=True)
img.save(path, "PNG", dpi=(180, 180))
def vertical_text(img: Image.Image, text: str, x: int, y: int, size: int = 27) -> None:
f = font(size, True)
box = ImageDraw.Draw(img).textbbox((0, 0), text, font=f)
layer = Image.new("RGBA", (box[2] - box[0] + 16, box[3] - box[1] + 16), (255, 255, 255, 0))
ImageDraw.Draw(layer).text((8, 8), text, fill=INK, font=f)
layer = layer.rotate(90, expand=True)
img.paste(layer, (int(x - layer.width / 2), int(y - layer.height / 2)), layer)
def line_chart(path: Path, x: Sequence[float], series: Mapping[str, Sequence[float]], title: str, x_label: str, y_label: str, percent: bool = False, log_x: bool = False) -> None:
img, d = canvas(title)
w, h = img.size
left, top, right, bottom = 165, 150, w - 85, h - 155
xx = np.asarray(x, float)
xplot = np.log10(np.maximum(xx, 1e-12)) if log_x else xx
all_y = np.concatenate([np.asarray(v, float) for v in series.values()])
ymin, ymax = float(all_y.min()), float(all_y.max())
pad = max((ymax - ymin) * 0.10, 1e-8)
ymin = min(0.0, ymin - pad) if ymin >= 0 else ymin - pad
ymax += pad
for k in range(6):
yv = ymin + k * (ymax - ymin) / 5
py = bottom - k * (bottom - top) / 5
d.line((left, py, right, py), fill=GRID, width=2)
label = f"{100*yv:.0f}%" if percent else (f"{yv:.3g}" if abs(yv) < 1 else f"{yv:.2f}")
d.text((left - 16, py), label, fill=INK, font=font(23), anchor="rm")
ticks = np.linspace(0, len(xx) - 1, min(len(xx), 7), dtype=int)
for i in np.unique(ticks):
px = left + (xplot[i] - xplot.min()) / max(xplot.max() - xplot.min(), 1e-12) * (right - left)
lab = f"{xx[i]:.0e}" if log_x and xx[i] < 0.01 else f"{xx[i]:g}"
d.text((px, bottom + 22), lab, fill=INK, font=font(22), anchor="ma")
d.line((left, top, left, bottom), fill=INK, width=3)
d.line((left, bottom, right, bottom), fill=INK, width=3)
legend_x = left
for j, (name, vals) in enumerate(series.items()):
yy = np.asarray(vals, float)
pts = []
for xv, yv in zip(xplot, yy):
px = left + (xv - xplot.min()) / max(xplot.max() - xplot.min(), 1e-12) * (right - left)
py = bottom - (yv - ymin) / max(ymax - ymin, 1e-12) * (bottom - top)
pts.append((px, py))
d.line(pts, fill=PALETTE[j], width=6, joint="curve")
for px, py in pts[:: max(1, len(pts) // 20)]:
d.ellipse((px - 5, py - 5, px + 5, py + 5), fill=PALETTE[j])
d.line((legend_x, 112, legend_x + 42, 112), fill=PALETTE[j], width=6)
d.text((legend_x + 52, 112), name, fill=INK, font=font(23), anchor="lm")
legend_x += 75 + d.textbbox((0, 0), name, font=font(23))[2]
d.text(((left + right) / 2, h - 55), x_label, fill=INK, font=font(28, True), anchor="ma")
vertical_text(img, y_label, 48, (top + bottom) // 2)
save_img(img, path)
def xy_line_chart(path: Path, series: Mapping[str, Tuple[np.ndarray, np.ndarray]], title: str, x_label: str, y_label: str) -> None:
img, d = canvas(title)
w, h = img.size
left, top, right, bottom = 165, 150, w - 85, h - 155
all_x = np.concatenate([v[0] for v in series.values()])
all_y = np.concatenate([v[1] for v in series.values()])
xmin, xmax = float(all_x.min()), float(all_x.max())
ymin, ymax = min(0.0, float(all_y.min())), float(all_y.max()) * 1.03
for k in range(6):
yv = ymin + k * (ymax - ymin) / 5
py = bottom - k * (bottom - top) / 5
d.line((left, py, right, py), fill=GRID, width=2)
d.text((left - 15, py), f"{yv:.2f}", fill=INK, font=font(23), anchor="rm")
for k in range(7):
xv = xmin + k * (xmax - xmin) / 6
px = left + k * (right - left) / 6
d.text((px, bottom + 22), f"{xv:.2f}", fill=INK, font=font(22), anchor="ma")
d.line((left, top, left, bottom), fill=INK, width=3)
d.line((left, bottom, right, bottom), fill=INK, width=3)
lx = left
for j, (name, (xx, yy)) in enumerate(series.items()):
pts = [(left + (x - xmin) / max(xmax - xmin, 1e-12) * (right - left), bottom - (y - ymin) / max(ymax - ymin, 1e-12) * (bottom - top)) for x, y in zip(xx, yy)]
d.line(pts, fill=PALETTE[j], width=6, joint="curve")
d.line((lx, 112, lx + 42, 112), fill=PALETTE[j], width=6)
d.text((lx + 52, 112), name, fill=INK, font=font(23), anchor="lm")
lx += 75 + d.textbbox((0, 0), name, font=font(23))[2]
d.text(((left + right) / 2, h - 55), x_label, fill=INK, font=font(28, True), anchor="ma")
vertical_text(img, y_label, 48, (top + bottom) // 2)
save_img(img, path)
def grouped_bar(path: Path, labels: Sequence[str], series: Mapping[str, Sequence[float]], title: str, y_label: str, value_fmt: str = "{:.2f}") -> None:
img, d = canvas(title)
w, h = img.size
left, top, right, bottom = 155, 155, w - 75, h - 180
arrays = {k: np.asarray(v, float) for k, v in series.items()}
vmax = max(float(np.max(v)) for v in arrays.values())
vmax = max(vmax * 1.22, 1e-9)
for k in range(6):
yv = k * vmax / 5
py = bottom - k * (bottom - top) / 5
d.line((left, py, right, py), fill=GRID, width=2)
d.text((left - 15, py), f"{yv:.3g}", fill=INK, font=font(22), anchor="rm")
n, m = len(labels), len(series)
group = (right - left) / n
bw = group * 0.74 / m
for i, label in enumerate(labels):
center = left + (i + 0.5) * group
d.text((center, bottom + 20), str(label), fill=INK, font=font(22), anchor="ma")
for j, (_, vals) in enumerate(arrays.items()):
v = float(vals[i])
x0 = center - group * 0.37 + j * bw
x1 = x0 + 0.88 * bw
y0 = bottom - v / vmax * (bottom - top)
d.rectangle((x0, y0, x1, bottom), fill=PALETTE[j], outline="white")
d.text(((x0 + x1) / 2, y0 - 8), value_fmt.format(v), fill=INK, font=font(17), anchor="ms")
lx = left
for j, name in enumerate(series):
d.rectangle((lx, 108, lx + 28, 132), fill=PALETTE[j])
d.text((lx + 38, 120), name, fill=INK, font=font(22), anchor="lm")
lx += 70 + d.textbbox((0, 0), name, font=font(22))[2]
d.line((left, top, left, bottom), fill=INK, width=3)
d.line((left, bottom, right, bottom), fill=INK, width=3)
vertical_text(img, y_label, 48, (top + bottom) // 2)
save_img(img, path)
def heatmap(path: Path, matrix: np.ndarray, row_labels: Sequence[str], col_labels: Sequence[str], title: str, value_fmt: str = "{:.2f}") -> None:
img, d = canvas(title)
w, h = img.size
left, top, right, bottom = 280, 170, w - 170, h - 170
mat = np.asarray(matrix, float)
nr, nc = mat.shape
cw, ch = (right - left) / nc, (bottom - top) / nr
vmin, vmax = float(np.min(mat)), float(np.max(mat))
for r in range(nr):
for c in range(nc):
t = (mat[r, c] - vmin) / max(vmax - vmin, 1e-12)
color = (int(242 - 166 * t), int(247 - 104 * t), int(251 - 48 * t))
x0, y0 = left + c * cw, top + r * ch
d.rectangle((x0, y0, x0 + cw, y0 + ch), fill=color, outline="white", width=3)
d.text((x0 + cw / 2, y0 + ch / 2), value_fmt.format(mat[r, c]), fill=INK, font=font(25, True), anchor="mm")
for r, lab in enumerate(row_labels):
d.text((left - 18, top + (r + 0.5) * ch), lab, fill=INK, font=font(25), anchor="rm")
for c, lab in enumerate(col_labels):
d.text((left + (c + 0.5) * cw, bottom + 20), lab, fill=INK, font=font(25), anchor="ma")
save_img(img, path)
def field_panels(path: Path, fields: Sequence[np.ndarray], labels: Sequence[str], title: str, shared_scale: bool = True, fmt: str = "{:.1f}") -> None:
img, d = canvas(title, 1900, 780)
top, gap, panel = 150, 55, 520
left = int((1900 - (len(fields) * panel + (len(fields) - 1) * gap)) / 2)
all_vals = np.concatenate([np.ravel(x) for x in fields])
global_min, global_max = float(all_vals.min()), float(all_vals.max())
for i, (arr, label) in enumerate(zip(fields, labels)):
arr = np.asarray(arr, float)
vmin, vmax = (global_min, global_max) if shared_scale else (float(arr.min()), float(arr.max()))
t = np.clip((arr - vmin) / max(vmax - vmin, 1e-12), 0, 1)
rgb = np.stack([32 + 220 * t, 60 + 145 * (1 - np.abs(t - 0.55) * 1.6), 210 - 165 * t], axis=-1).clip(0, 255).astype(np.uint8)
small = Image.fromarray(rgb, "RGB").resize((panel, panel), Image.Resampling.NEAREST)
x0 = left + i * (panel + gap)
img.paste(small, (x0, top))
d.rectangle((x0, top, x0 + panel, top + panel), outline=INK, width=3)
d.text((x0 + panel / 2, top - 18), label, fill=INK, font=font(28, True), anchor="ms")
d.text((x0, top + panel + 18), f"min={fmt.format(vmin)}", fill=INK, font=font(20), anchor="la")
d.text((x0 + panel, top + panel + 18), f"max={fmt.format(vmax)}", fill=INK, font=font(20), anchor="ra")
save_img(img, path)
def gamut_plot(path: Path, locus: np.ndarray, src: np.ndarray, dst: np.ndarray, title: str, src_label: str, dst_label: str, mapping: Tuple[np.ndarray, np.ndarray] | None = None) -> None:
img, d = canvas(title, 1500, 1250)
left, top, right, bottom = 170, 150, 1330, 1080
xmin, xmax, ymin, ymax = 0.0, 0.80, 0.0, 0.90
def pt(xy):
return (left + (xy[0] - xmin) / (xmax - xmin) * (right - left), bottom - (xy[1] - ymin) / (ymax - ymin) * (bottom - top))
for k in range(9):
xv = k * 0.1
px = pt((xv, 0))[0]
d.line((px, top, px, bottom), fill=GRID, width=1)
d.text((px, bottom + 18), f"{xv:.1f}", fill=INK, font=font(20), anchor="ma")
for k in range(10):
yv = k * 0.1
py = pt((0, yv))[1]
d.line((left, py, right, py), fill=GRID, width=1)
d.text((left - 15, py), f"{yv:.1f}", fill=INK, font=font(20), anchor="rm")
locus_pts = [pt(x) for x in locus if np.isfinite(x).all()]
d.line(locus_pts, fill="#3E4650", width=4, joint="curve")
overlay = Image.new("RGBA", img.size, (255, 255, 255, 0))
od = ImageDraw.Draw(overlay)
sp = [pt(x) for x in src]
dp = [pt(x) for x in dst]
od.polygon(sp, fill=(196, 128, 50, 48), outline=(166, 93, 32, 255))
od.polygon(dp, fill=(40, 115, 185, 54), outline=(33, 97, 160, 255))
img = Image.alpha_composite(img.convert("RGBA"), overlay).convert("RGB")
d = ImageDraw.Draw(img)
d.line(sp + [sp[0]], fill="#A45D20", width=6)
d.line(dp + [dp[0]], fill="#2167A9", width=6)
for i, (x, y) in enumerate(sp):
d.ellipse((x - 7, y - 7, x + 7, y + 7), fill="#A45D20")
for i, (x, y) in enumerate(dp):
d.ellipse((x - 7, y - 7, x + 7, y + 7), fill="#2167A9")
if mapping is not None:
a, b = mapping
stride = max(1, len(a) // 35)
for u, v in zip(a[::stride], b[::stride]):
x0, y0 = pt(u)
x1, y1 = pt(v)
d.line((x0, y0, x1, y1), fill="#C84D4F", width=2)
d.ellipse((x1 - 3, y1 - 3, x1 + 3, y1 + 3), fill="#C84D4F")
d.line((left, top, left, bottom), fill=INK, width=3)
d.line((left, bottom, right, bottom), fill=INK, width=3)
d.line((220, 112, 270, 112), fill="#A45D20", width=6)
d.text((285, 112), src_label, fill=INK, font=font(24), anchor="lm")
d.line((620, 112, 670, 112), fill="#2167A9", width=6)
d.text((685, 112), dst_label, fill=INK, font=font(24), anchor="lm")
if mapping is not None:
d.line((1010, 112, 1060, 112), fill="#C84D4F", width=3)
d.text((1075, 112), "映射向量", fill=INK, font=font(24), anchor="lm")
d.text(((left + right) / 2, 1195), "CIE 1931 色度坐标 x", fill=INK, font=font(28, True), anchor="ma")
vertical_text(img, "CIE 1931 色度坐标 y", 48, (top + bottom) // 2)
save_img(img, path)
def patch_mosaic(path: Path, rows: Sequence[np.ndarray], row_labels: Sequence[str], title: str, indices: Sequence[int]) -> None:
img, d = canvas(title, 1900, 720)
left, top, size, gap = 280, 160, 105, 18
for r, (xyz, label) in enumerate(zip(rows, row_labels)):
y = top + r * (size + 48)
d.text((left - 25, y + size / 2), label, fill=INK, font=font(25, True), anchor="rm")
colors = (255 * xyz_to_display_rgb(xyz[np.asarray(indices)])).round().astype(np.uint8)
for c, color in enumerate(colors):
x = left + c * (size + gap)
d.rectangle((x, y, x + size, y + size), fill=tuple(map(int, color)), outline="#555555", width=2)
if r == len(rows) - 1:
d.text((x + size / 2, y + size + 11), str(c + 1), fill=INK, font=font(17), anchor="ma")
d.text((950, 660), "列号对应高色差代表样本;颜色仅作相对视觉比较,数值评价以ΔE00为准。", fill=MUTED, font=font(22), anchor="ma")
save_img(img, path)
def image_comparison(path: Path, before: np.ndarray, after: np.ndarray, title: str) -> None:
img, d = canvas(title, 1900, 1080)
panel = 350
left, top, xgap, ygap = 210, 175, 210, 75
for stage, arr in enumerate((before, after)):
y0 = top + stage * (panel + ygap)
d.text((left - 25, y0 + panel / 2), "校正前" if stage == 0 else "校正后", fill=INK, font=font(29, True), anchor="rm")
for j, name in enumerate("RGB"):
raw = np.clip(arr[:, j, :].reshape(64, 64, 3), 0, 255).astype(np.uint8)
tile = Image.fromarray(raw, "RGB").resize((panel, panel), Image.Resampling.NEAREST)
x0 = left + j * (panel + xgap)
img.paste(tile, (x0, y0))
d.rectangle((x0, y0, x0 + panel, y0 + panel), outline=INK, width=4)
if stage == 0:
d.text((x0 + panel / 2, y0 - 18), f"{name}标定场", fill=INK, font=font(26, True), anchor="ms")
save_img(img, path)
def cdf_pair(values_a: np.ndarray, values_b: np.ndarray) -> Dict[str, Tuple[np.ndarray, np.ndarray]]:
def one(v):
x = np.sort(np.asarray(v, float))
y = np.arange(1, len(x) + 1) / len(x)
return x, y
return {"基准方法": one(values_a), "本文方法": one(values_b)}
def generate_figures(fig: Path, gamuts: dict, q1: dict, q2: dict, q3: dict) -> None:
fig.mkdir(parents=True, exist_ok=True)
# 问题一:色域几何、映射方向、色差与亮度保持。
out_idx = np.where(~q1["in_gamut"])[0]
src_xy = xyz_to_xy(q1["xyz_source"][out_idx])
dst_xy = xyz_to_xy(q1["xyz_proposed"][out_idx])
gamut_plot(fig / "fig01_q1_gamut_mapping.png", gamuts["locus"], q1["source_xy"], q1["display_xy"], "问题一:BT.2020到普通RGB的色域压缩", "BT.2020源色域", "普通RGB显示色域", (src_xy, dst_xy))
grouped_bar(fig / "fig02_q1_gamut_area.png", ["BT.2020", "普通RGB", "交集"], {"xy平面面积": [q1["gamut"]["source_area"], q1["gamut"]["display_area"], q1["gamut"]["intersection_area"]]}, "问题一:源、目标与交集色域面积", "CIE xy几何面积", "{:.3f}")
xy_line_chart(fig / "fig03_q1_deltae_cdf.png", cdf_pair(q1["de_baseline"], q1["de_proposed"]), "问题一:两种映射方法的ΔE00经验分布", "CIEDE2000色差", "累计概率")
worst = np.argsort(q1["de_baseline"])[-12:][::-1]
patch_mosaic(fig / "fig04_q1_patch_comparison.png", [q1["xyz_source"], q1["xyz_baseline"], q1["xyz_proposed"]], ["源颜色", "逐通道裁剪", "本文盒约束映射"], "问题一:高色差代表色块映射比较", worst)
yref = q1["xyz_source"][:, 1]
bins = np.linspace(float(yref.min()), float(yref.max()), 9)
centers, e0, e1 = [], [], []
for a, b in zip(bins[:-1], bins[1:]):
mask = (yref >= a) & (yref <= b if b == bins[-1] else yref < b)
if mask.any():
centers.append((a + b) / 2)
e0.append(float(np.mean(np.abs(q1["xyz_baseline"][mask, 1] - yref[mask]))))
e1.append(float(np.mean(np.abs(q1["xyz_proposed"][mask, 1] - yref[mask]))))
line_chart(fig / "fig05_q1_luminance_error.png", centers, {"逐通道裁剪": e0, "本文方法": e1}, "问题一:不同亮度区间的平均亮度误差", "源颜色相对亮度Y", "平均绝对Y误差")
# 问题二:多基色色域、误差和通道利用。
raw5 = q2["raw_display_codes"]
mask2 = np.any((raw5 < -1e-9) | (raw5 > 1 + 1e-9), axis=1)
sxy2 = xyz_to_xy(q2["xyz_source"][mask2])
dxy2 = xyz_to_xy(q2["xyz_proposed"][mask2])
gamut_plot(fig / "fig06_q2_gamut_mapping.png", gamuts["locus"], q2["source_xy"], q2["display_xy"], "问题二:RGBV四通道到RGBCX五通道映射", "RGBV视频源色域", "RGBCX显示色域", (sxy2, dxy2))
xy_line_chart(fig / "fig07_q2_deltae_cdf.png", cdf_pair(q2["de_baseline"], q2["de_proposed"]), "问题二:五通道映射ΔE00经验分布", "CIEDE2000色差", "累计概率")
q2m = q2["metrics"]
grouped_bar(fig / "fig08_q2_error_metrics.png", q2m["方法"].tolist(), {"平均ΔE00": q2m["平均ΔE00"], "95%分位ΔE00": q2m["ΔE00_95分位"]}, "问题二:基准与正则化映射的色差指标", "色差", "{:.2f}")
util = q2["utilization"]
grouped_bar(fig / "fig09_q2_channel_utilization.png", util["通道"].tolist(), {"平均驱动/%": 100 * util["平均驱动"], "95%分位/%": 100 * util["95%分位驱动"]}, "问题二:RGBCX五个显示通道的利用水平", "归一化驱动/%", "{:.1f}")
ex = np.argsort(q2["de_baseline"])[-8:][::-1]
grouped_bar(fig / "fig10_q2_example_codes.png", [f"样本{i+1}" for i in range(len(ex))], {name: 100 * q2["proposed_codes"][ex, j] for j, name in enumerate(list("RGCXB"))}, "问题二:高难度样本的五通道最优驱动分解", "通道驱动/%", "{:.0f}")
# 问题三:原始场、响应矩阵、校正系数、色差和验证。
before, after = q3["before"], q3["after"]
field_panels(fig / "fig11_q3_raw_main_channels.png", [before[:, j, j].reshape(64, 64) for j in range(3)], ["R场的R主分量", "G场的G主分量", "B场的B主分量"], "问题三:校正前三个主分量的空间非均匀性", True)
heatmap(fig / "fig12_q3_mean_response_matrix.png", q3["mean_matrix"], ["输出R", "输出G", "输出B"], ["驱动R", "驱动G", "驱动B"], "问题三:全屏平均3×3颜色响应矩阵(驱动码220)", "{:.2f}")
field_panels(fig / "fig13_q3_condition_map.png", [q3["condition"].reshape(64, 64)], ["局部响应矩阵条件数"], "问题三:逐像素响应矩阵的数值稳定性", False, "{:.2f}")
image_comparison(fig / "fig14_q3_visual_before_after.png", before, after, "问题三:64×64三基色标定场校正前后模拟显示")
gains = [q3["drives"][:, j, j].reshape(64, 64) / TARGET_CODE for j in range(3)]
field_panels(fig / "fig15_q3_gain_maps.png", gains, ["R主驱动增益", "G主驱动增益", "B主驱动增益"], "问题三:逐点主通道校正增益图", True, "{:.3f}")
field_panels(fig / "fig16_q3_deltae_maps.png", [q3["de_before"].mean(axis=1).reshape(64, 64), q3["de_after"].mean(axis=1).reshape(64, 64)], ["校正前平均ΔE00", "校正后平均ΔE00"], "问题三:逐像素平均色差校正前后对比", True, "{:.2f}")
xy_line_chart(fig / "fig17_q3_deltae_cdf.png", cdf_pair(q3["de_before"].ravel(), q3["de_after"].ravel()), "问题三:全屏三基色ΔE00累计分布", "CIEDE2000色差", "累计概率")
uni = q3["uniformity"]
pre = uni[uni["阶段"] == "校正前"].set_index("基色")
post = uni[uni["阶段"] == "校正后"].set_index("基色")
grouped_bar(fig / "fig18_q3_uniformity.png", list("RGB"), {"校正前CV/%": 100 * pre.loc[list("RGB"), "变异系数"], "校正后CV/%": 100 * post.loc[list("RGB"), "变异系数"]}, "问题三:三个基色主分量变异系数", "变异系数/%", "{:.2f}")
sen = q3["sensitivity"]
sx = sen["正则化系数"].to_numpy(float).copy()
sx[0] = 1e-6
line_chart(fig / "fig19_q3_regularization_sensitivity.png", sx, {"留出集平均ΔE00": sen["留出集平均ΔE00"], "校正码限幅率": sen["校正码限幅率"]}, "问题三:正则化系数灵敏度", "正则化系数λ(首点代表λ=0)", "评价指标", log_x=True)
rob = q3["robustness"]
line_chart(fig / "fig20_q3_robustness.png", rob["测量扰动标准差/码值"], {"平均ΔE00": rob["平均ΔE00"], "95%分位ΔE00": rob["95%分位ΔE00"]}, "问题三:测量噪声扰动下的校正稳健性", "响应矩阵扰动标准差/码值", "色差")
def _native(value):
if isinstance(value, dict):
return {str(k): _native(v) for k, v in value.items()}
if isinstance(value, (list, tuple)):
return [_native(v) for v in value]
if isinstance(value, np.ndarray):
return value.tolist()
if isinstance(value, (np.floating, np.integer)):
return value.item()
return value
def write_outputs(out: Path, gamuts: dict, clean_meta: dict, q1: dict, q2: dict, q3: dict, args: argparse.Namespace) -> None:
out.mkdir(parents=True, exist_ok=True)
q1["metrics"].to_csv(out / "question1_metrics.csv", index=False, encoding="utf-8-sig")
q2["metrics"].to_csv(out / "question2_metrics.csv", index=False, encoding="utf-8-sig")
q2["utilization"].to_csv(out / "question2_channel_utilization.csv", index=False, encoding="utf-8-sig")
q3["metrics"].to_csv(out / "question3_metrics.csv", index=False, encoding="utf-8-sig")
q3["uniformity"].to_csv(out / "question3_uniformity.csv", index=False, encoding="utf-8-sig")
q3["robustness"].to_csv(out / "question3_robustness.csv", index=False, encoding="utf-8-sig")
q3["sensitivity"].to_csv(out / "question3_regularization_sensitivity.csv", index=False, encoding="utf-8-sig")
pd.DataFrame(q3["target"], index=["目标R", "目标G", "目标B"], columns=["输出R", "输出G", "输出B"]).to_csv(out / "question3_common_target.csv", encoding="utf-8-sig")
rows, cols = np.indices((64, 64))
calibration_rows = []
for j, target_name in enumerate("RGB"):
for p in range(64 * 64):
calibration_rows.append({
"row": int(rows.reshape(-1)[p] + 1),
"col": int(cols.reshape(-1)[p] + 1),
"target_primary": target_name,
"drive_R": float(q3["drives"][p, j, 0]),
"drive_G": float(q3["drives"][p, j, 1]),
"drive_B": float(q3["drives"][p, j, 2]),
"predicted_R": float(q3["after"][p, j, 0]),
"predicted_G": float(q3["after"][p, j, 1]),
"predicted_B": float(q3["after"][p, j, 2]),
})
pd.DataFrame(calibration_rows).to_csv(out / "question3_pixel_calibration_codes.csv", index=False, encoding="utf-8-sig")
pd.DataFrame([{"工作表": k, "有效64×64范围": v, "说明": "剔除非数值或公式噪声后使用的原始测量块"} for k, v in clean_meta["valid_ranges"].items()]).to_csv(out / "input_data_cleaning.csv", index=False, encoding="utf-8-sig")
q1m = q1["metrics"].set_index("方法")
q2m = q2["metrics"].set_index("方法")
q3m = q3["metrics"].set_index("数据集")
summary = {
"metadata": {
"seed": args.seed,
"q1_samples": len(q1["source_codes"]),
"q2_samples": len(q2["source_codes"]),
"pixel_count": 4096,
"source_docx": str(Path(args.input_docx)),
"source_xlsx": str(Path(args.input_xlsx)),
"cleaning": clean_meta,
},
"extracted_gamuts": {
"q1_bt2020": gamuts["q1_source"],
"q1_ordinary_rgb": gamuts["q1_display"],
"q2_rgbv": gamuts["q2_source"],
"q2_rgbcx": gamuts["q2_display"],
},
"question1": {
"gamut": q1["gamut"],
"source_matrix": q1["source_matrix"],
"display_matrix": q1["display_matrix"],
"metrics": q1["metrics"].to_dict(orient="records"),
"mean_deltae_reduction": 1 - q1m.loc["ΔE00-亮度联合盒约束映射", "平均ΔE00"] / q1m.loc["逐通道裁剪", "平均ΔE00"],
},
"question2": {
"gamut": q2["gamut"],
"source_matrix": q2["source_matrix"],
"display_matrix": q2["display_matrix"],
"source_white_weights": q2["source_white_weights"],
"display_white_weights": q2["display_white_weights"],
"regularization": q2["regularization"],
"metrics": q2["metrics"].to_dict(orient="records"),
"utilization": q2["utilization"].to_dict(orient="records"),
"mean_deltae_reduction": 1 - q2m.loc["正则化五通道盒约束映射", "平均ΔE00"] / q2m.loc["伪逆后裁剪", "平均ΔE00"],
},
"question3": {
"common_achievable_target": q3["target"],
"mean_raw_response_matrix": q3["mean_matrix"],
"std_raw_response_matrix": q3["std_matrix"],
"condition_number": {"mean": float(np.mean(q3["condition"])), "p95": float(np.quantile(q3["condition"], 0.95)), "max": float(np.max(q3["condition"]))},
"metrics": q3["metrics"].to_dict(orient="records"),
"uniformity": q3["uniformity"].to_dict(orient="records"),
"robustness": q3["robustness"].to_dict(orient="records"),
"sensitivity": q3["sensitivity"].to_dict(orient="records"),
"full_screen_deltae_reduction": 1 - q3m.loc["全屏", "校正后平均ΔE00"] / q3m.loc["全屏", "校正前平均ΔE00"],
},
}
(out / "summary.json").write_text(json.dumps(_native(summary), ensure_ascii=False, indent=2), encoding="utf-8")
generate_figures(out / "figures", gamuts, q1, q2, q3)
def main() -> None:
args = parse_args()
out = Path(args.output_dir)
gamuts = extract_gamuts_from_docx(Path(args.input_docx))
data, clean_meta = load_measurements(Path(args.input_xlsx))
a_raw, hmat = build_pixel_response(data)
q1 = solve_question1(gamuts, args.samples_q1)
q2 = solve_question2(gamuts, args.samples_q2)
q3 = solve_question3(a_raw, hmat, args.seed)
write_outputs(out, gamuts, clean_meta, q1, q2, q3, args)
print(json.dumps({
"status": "ok",
"output_dir": str(out.resolve()),
"q1_samples": len(q1["source_codes"]),
"q2_samples": len(q2["source_codes"]),
"pixels": len(a_raw),
"figures": len(list((out / "figures").glob("*.png"))),
}, ensure_ascii=False))
if __name__ == "__main__":
main()