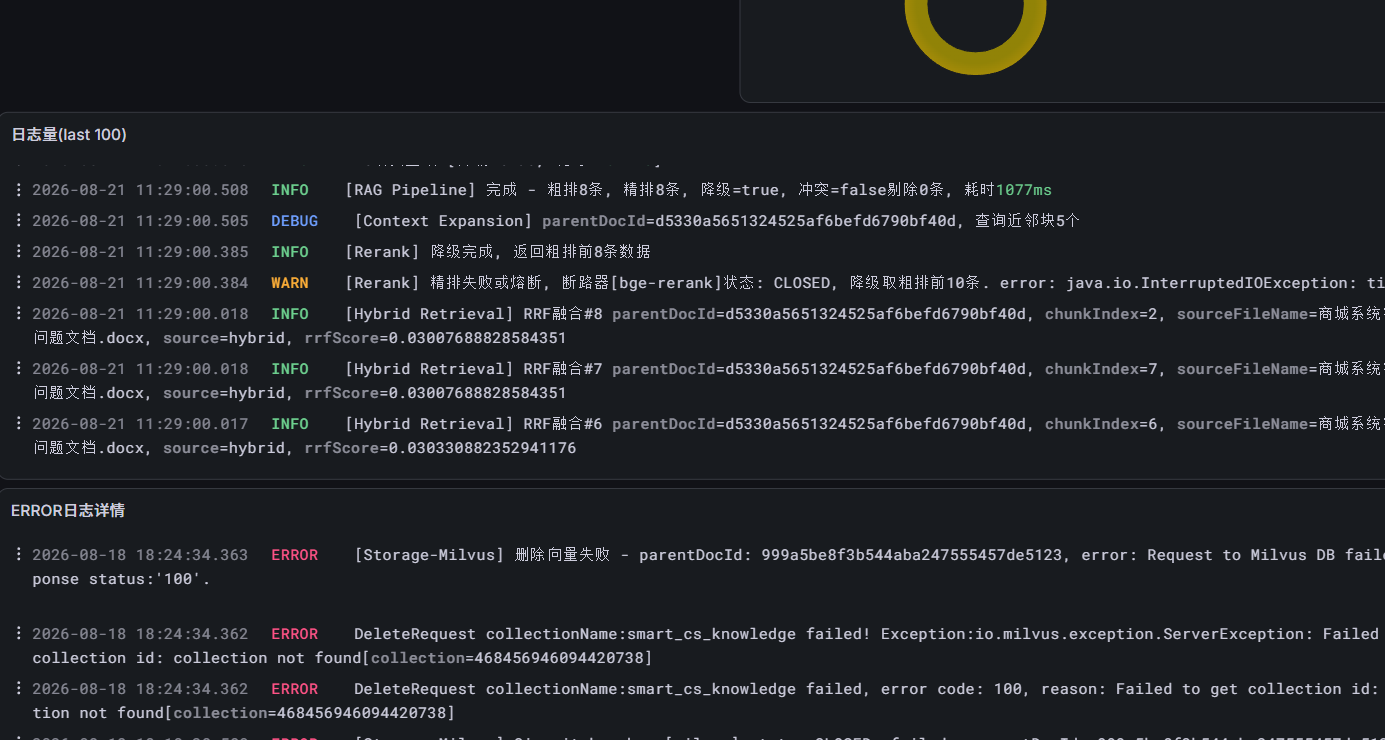
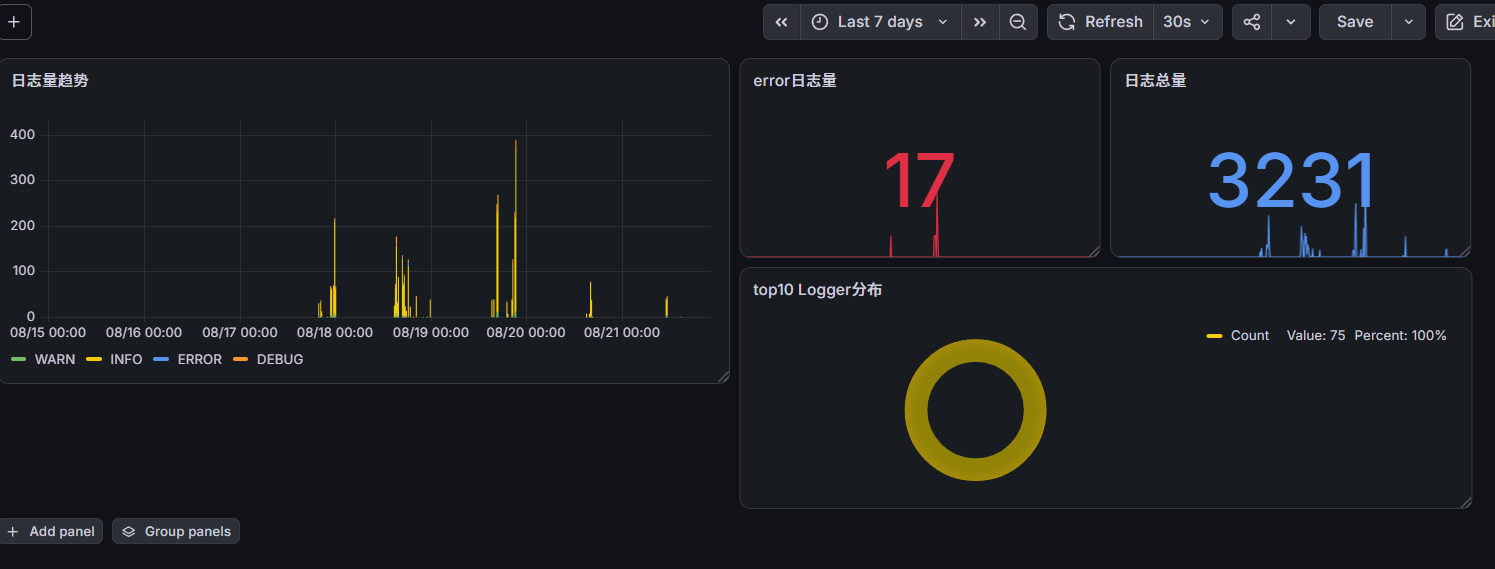
我们需要在grafana中实现如图所示的日志监控,首先你自己得把elastic search的数据源已经引入到grafana中
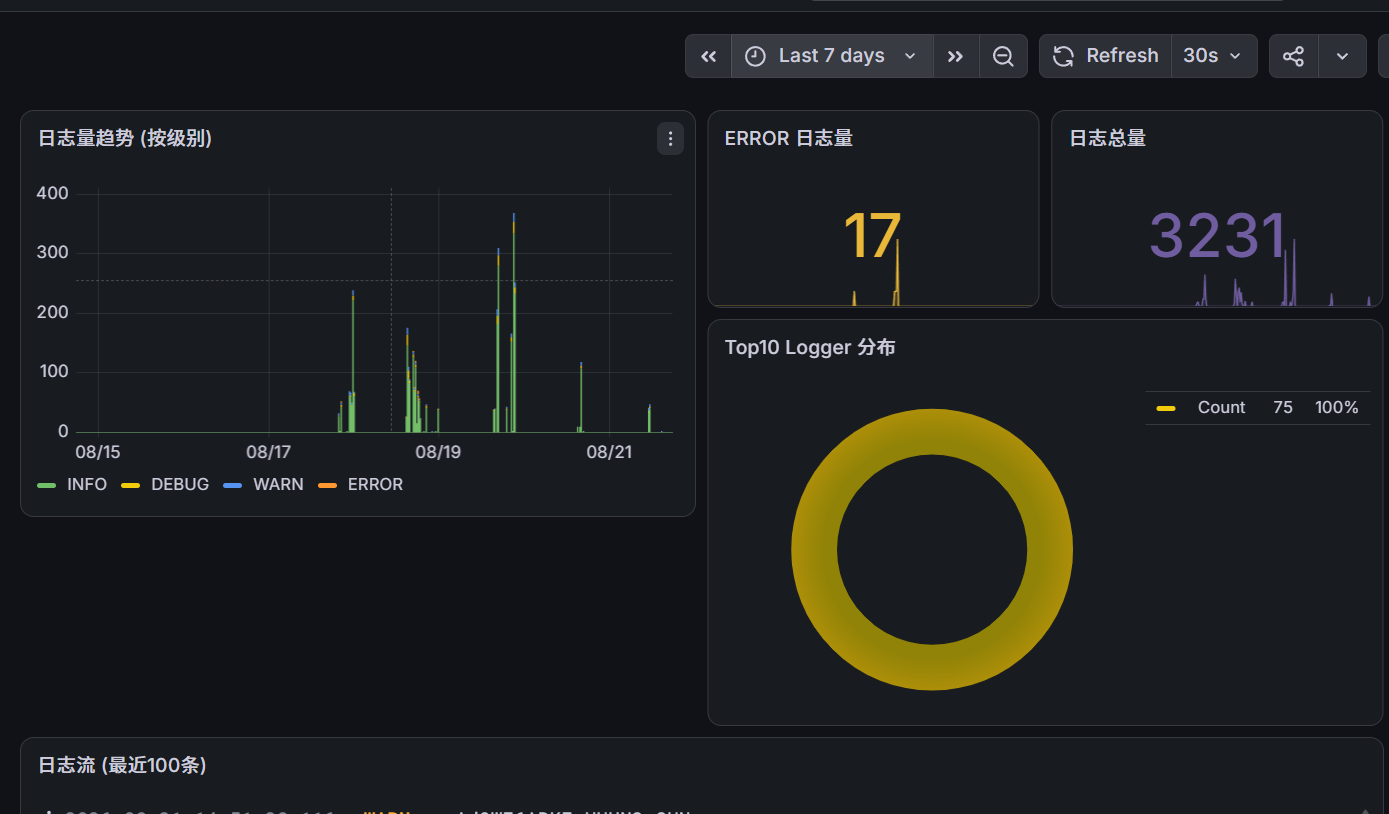
我们先看下已经实现的这个监控的json文件内容:
java
{
  "uid": "app-logs",
  "title": "应用日志 (Elasticsearch)",
  "tags": ["smartcs", "logs"],
  "timezone": "browser",
  "schemaVersion": 39,
  "refresh": "30s",
  "time": { "from": "now-1h", "to": "now" },
  "panels": [
    {
      "id": 1,
      "title": "日志量趋势 (按级别)",
      "type": "timeseries",
      "gridPos": { "x": 0, "y": 0, "w": 12, "h": 8 },
      "datasource": { "type": "elasticsearch", "uid": "ffvsw8nkbherka" },
      "fieldConfig": {
        "defaults": {
          "color": { "mode": "palette-classic" },
          "custom": { "drawStyle": "bars", "stacking": { "mode": "normal" }, "fillOpacity": 80 }
        },
        "overrides": []
      },
      "targets": [
        {
          "refId": "A",
          "datasource": { "type": "elasticsearch", "uid": "ffvsw8nkbherka" },
          "bucketAggs": [
            {
              "id": "3",
              "type": "terms",
              "field": "level.keyword",
              "settings": { "size": "10", "order": "desc", "orderBy": "_count" }
            },
            {
              "id": "2",
              "type": "date_histogram",
              "field": "@timestamp",
              "settings": { "interval": "auto" }
            }
          ],
          "metrics": [
            { "id": "1", "type": "count" }
          ],
          "query": "*",
          "timeField": "@timestamp"
        }
      ]
    },
    {
      "id": 2,
      "title": "ERROR 日志量",
      "type": "stat",
      "gridPos": { "x": 12, "y": 0, "w": 6, "h": 4 },
      "datasource": { "type": "elasticsearch", "uid": "ffvsw8nkbherka" },
      "fieldConfig": {
        "defaults": {
          "thresholds": { "steps": [{ "color": "#705da0", "value": null }, { "color": "#eab839", "value": 5 }, { "color": "#bf1b00", "value": 20 }] },
          "color": { "mode": "thresholds" }
        },
        "overrides": []
      },
      "options": {
        "reduceOptions": { "calcs": ["sum"] }
      },
      "targets": [
        {
          "refId": "A",
          "datasource": { "type": "elasticsearch", "uid": "ffvsw8nkbherka" },
          "bucketAggs": [
            { "id": "2", "type": "date_histogram", "field": "@timestamp", "settings": { "interval": "auto" } }
          ],
          "metrics": [
            { "id": "1", "type": "count" }
          ],
          "query": "level:ERROR",
          "timeField": "@timestamp"
        }
      ]
    },
    {
      "id": 3,
      "title": "日志总量",
      "type": "stat",
      "gridPos": { "x": 18, "y": 0, "w": 6, "h": 4 },
      "datasource": { "type": "elasticsearch", "uid": "ffvsw8nkbherka" },
      "fieldConfig": {
        "defaults": {
          "thresholds": { "steps": [{ "color": "#705da0", "value": null }] },
          "color": { "mode": "thresholds" }
        },
        "overrides": []
      },
      "options": {
        "reduceOptions": { "calcs": ["sum"] }
      },
      "targets": [
        {
          "refId": "A",
          "datasource": { "type": "elasticsearch", "uid": "ffvsw8nkbherka" },
          "bucketAggs": [
            { "id": "2", "type": "date_histogram", "field": "@timestamp", "settings": { "interval": "auto" } }
          ],
          "metrics": [
            { "id": "1", "type": "count" }
          ],
          "query": "*",
          "timeField": "@timestamp"
        }
      ]
    },
    {
      "id": 4,
      "title": "Top10 Logger 分布",
      "type": "piechart",
      "gridPos": { "x": 12, "y": 4, "w": 12, "h": 8 },
      "datasource": { "type": "elasticsearch", "uid": "ffvsw8nkbherka" },
      "fieldConfig": {
        "defaults": { "color": { "mode": "palette-classic" } },
        "overrides": []
      },
      "options": {
        "pieType": "donut",
        "legend": { "displayMode": "table", "placement": "right", "values": ["value", "percent"] }
      },
      "targets": [
        {
          "refId": "A",
          "datasource": { "type": "elasticsearch", "uid": "ffvsw8nkbherka" },
          "bucketAggs": [
            {
              "id": "2",
              "type": "terms",
              "field": "logger.keyword",
              "settings": { "size": "10", "order": "desc", "orderBy": "_count" }
            }
          ],
          "metrics": [
            { "id": "1", "type": "count" }
          ],
          "query": "*",
          "timeField": "@timestamp"
        }
      ]
    },
    {
      "id": 5,
      "title": "日志流 (最近100条)",
      "type": "logs",
      "gridPos": { "x": 0, "y": 12, "w": 24, "h": 12 },
      "datasource": { "type": "elasticsearch", "uid": "ffvsw8nkbherka" },
      "options": {
        "showTime": true,
        "showLabels": true,
        "showCommonLabels": false,
        "wrapLogMessage": true,
        "prettifyLogMessage": false,
        "enableLogDetails": true,
        "sortOrder": "Descending",
        "dedupStrategy": "none"
      },
      "targets": [
        {
          "refId": "A",
          "datasource": { "type": "elasticsearch", "uid": "ffvsw8nkbherka" },
          "bucketAggs": [],
          "metrics": [
            { "id": "1", "type": "raw_data", "settings": { "size": "100" } }
          ],
          "query": "*",
          "timeField": "@timestamp"
        }
      ]
    },
    {
      "id": 6,
      "title": "ERROR 日志详情",
      "type": "logs",
      "gridPos": { "x": 0, "y": 24, "w": 24, "h": 10 },
      "datasource": { "type": "elasticsearch", "uid": "ffvsw8nkbherka" },
      "options": {
        "showTime": true,
        "showLabels": true,
        "showCommonLabels": false,
        "wrapLogMessage": true,
        "prettifyLogMessage": false,
        "enableLogDetails": true,
        "sortOrder": "Descending",
        "dedupStrategy": "none"
      },
      "targets": [
        {
          "refId": "A",
          "datasource": { "type": "elasticsearch", "uid": "ffvsw8nkbherka" },
          "bucketAggs": [],
          "metrics": [
            { "id": "1", "type": "raw_data", "settings": { "size": "50" } }
          ],
          "query": "level:ERROR",
          "timeField": "@timestamp"
        }
      ]
    }
  ]
}
一、现在我们先看日志量趋势panel的实现:
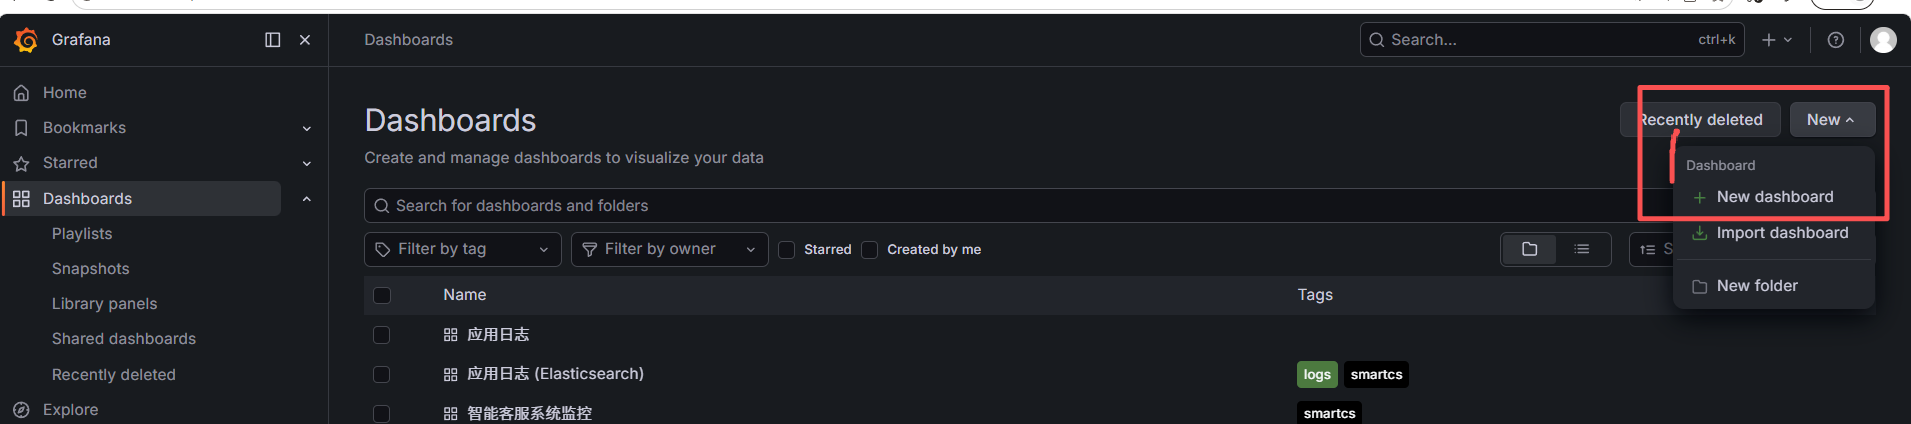
1.新建dashboard
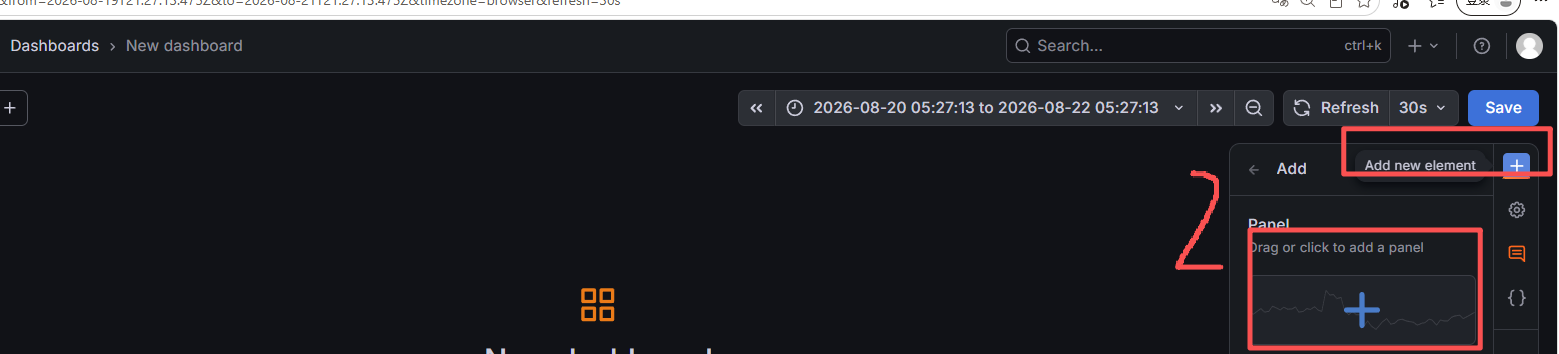
2.选择panel新建一个面板
3.在面板里面选择configure visualization
4.进入后选择数据源--->All visualization--->Query type选择metric
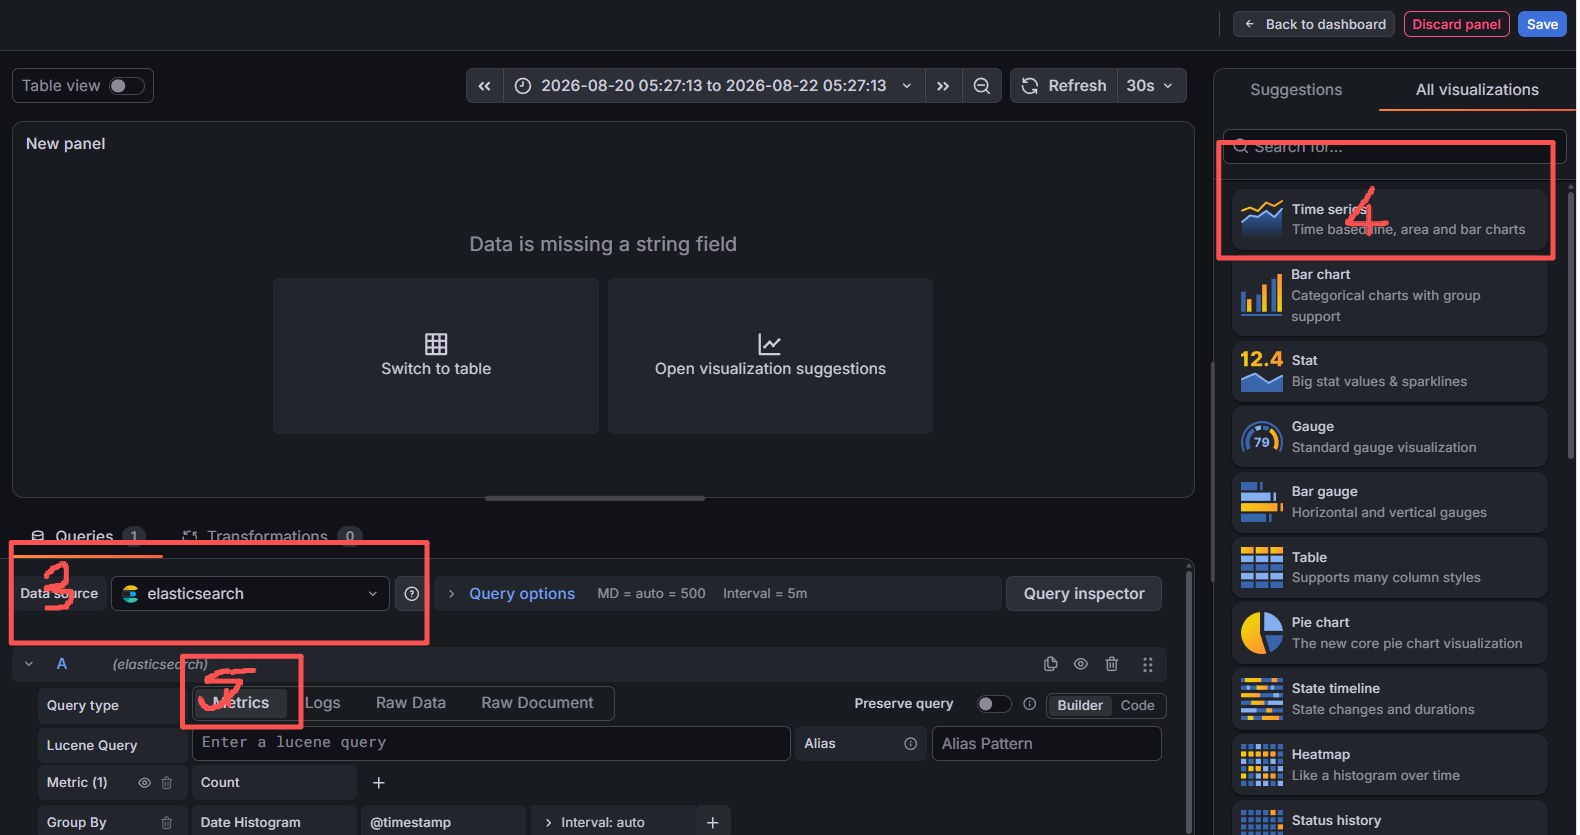
5.配置数据按照日志级别进行统计
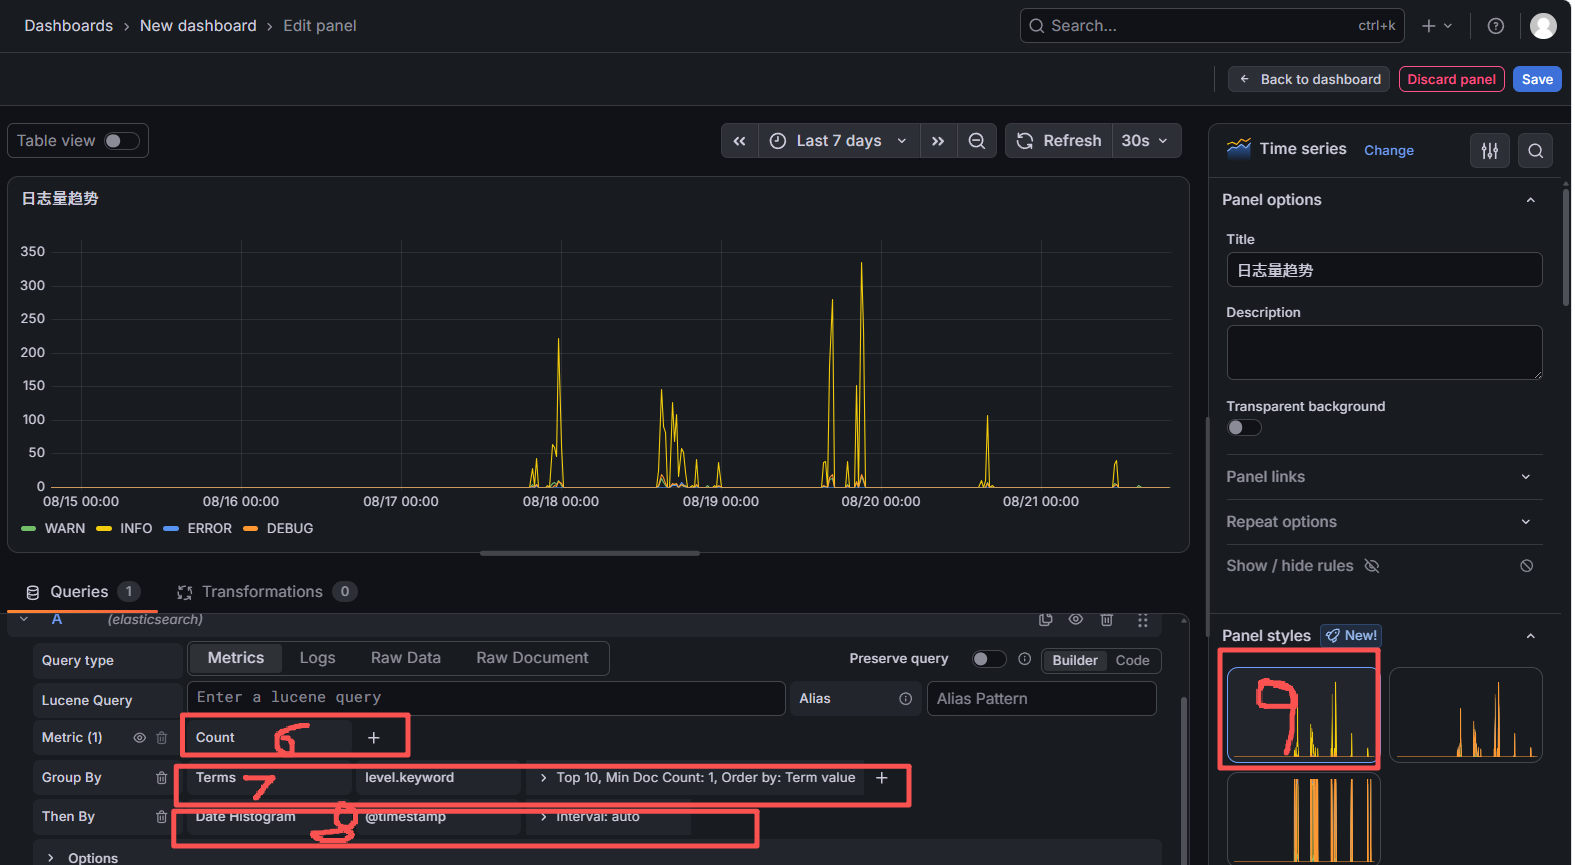
7.进行其他参数的设置
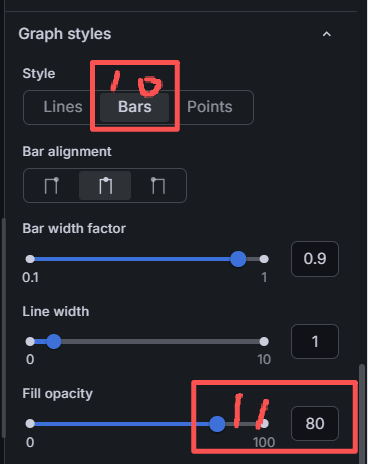
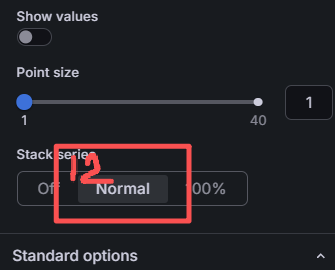
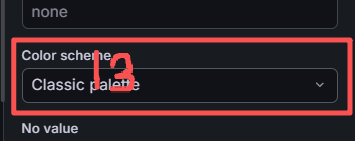
8.修改完成后点击右上侧的save按钮,根据最后的提示完成就可以了,效果如下:
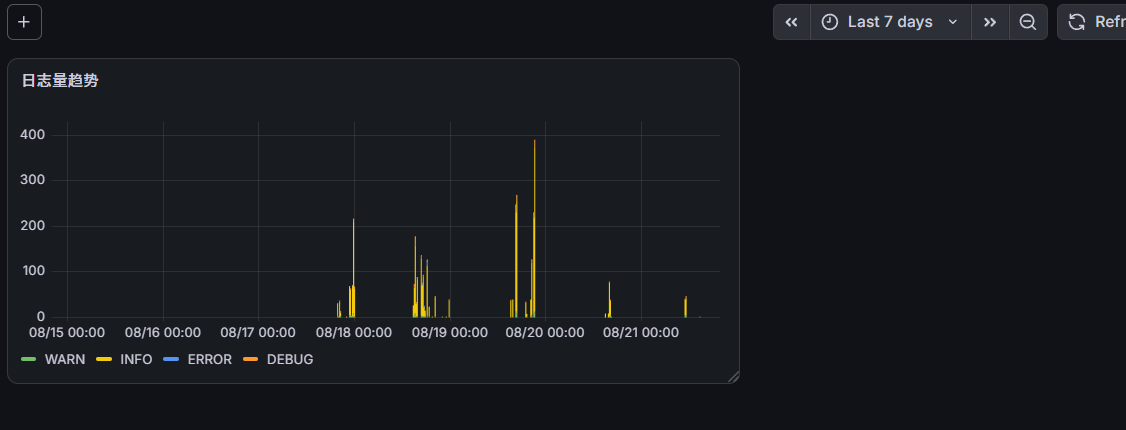
需要注意的是,如下图所示的两个时间设置,分别代表采集的数据是离当前的时间差和多久刷新一次

二、实现ERROR日志量的panel
1.新增一个panel以及选择数据源为elasticsearch,操作步骤如上
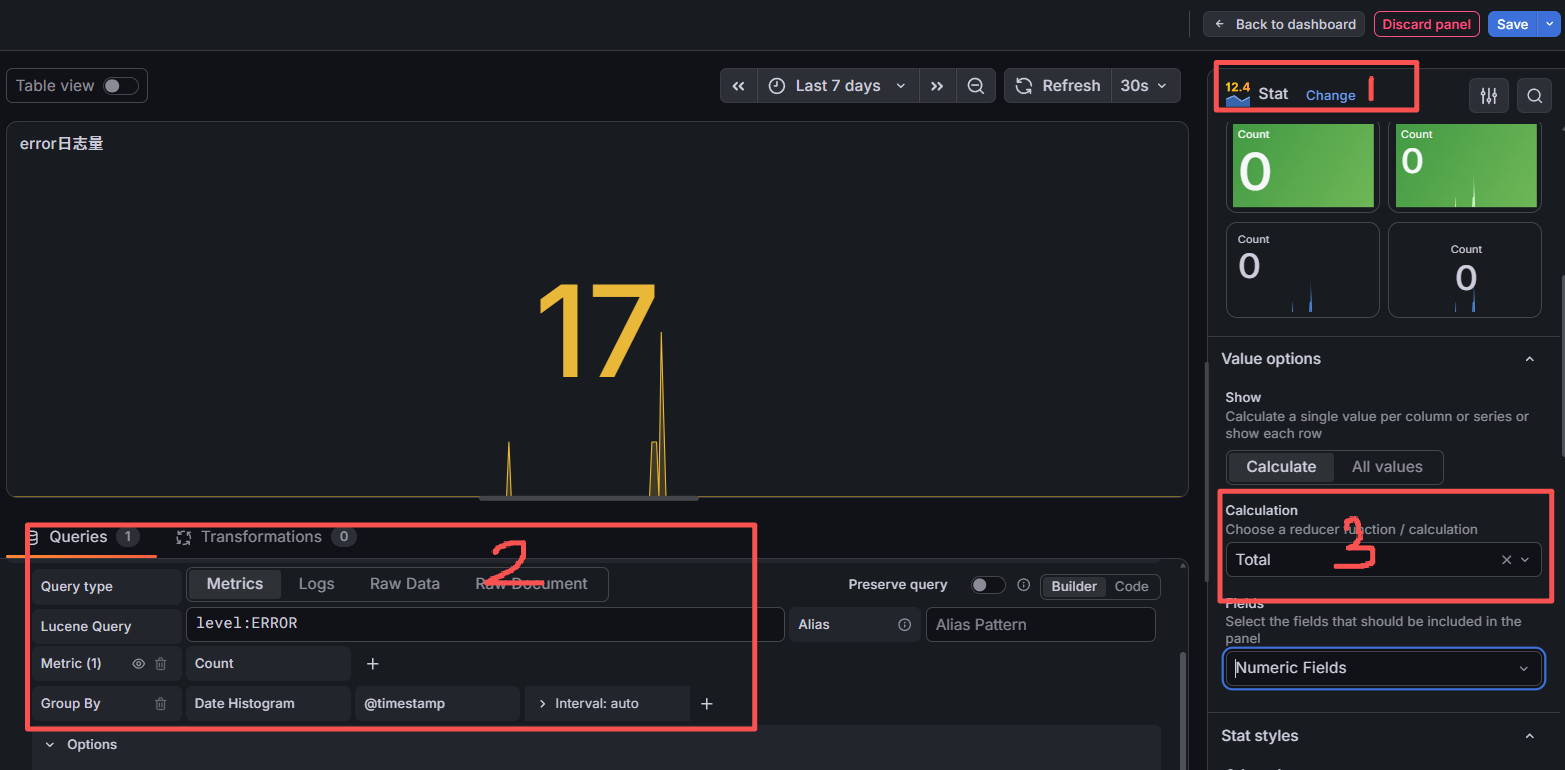
其中第三步是用来做计算操作的,把获取出来的数据做相应的操作,我目前这里是同求和的操作
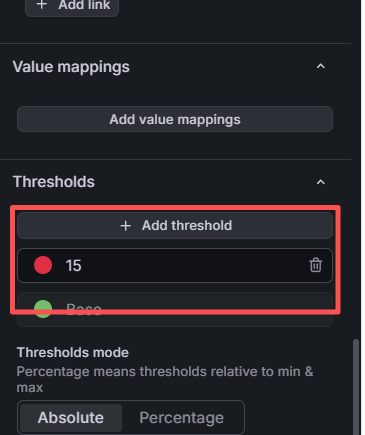
2.改变颜色通过如下图片
3.现在的效果如下图:
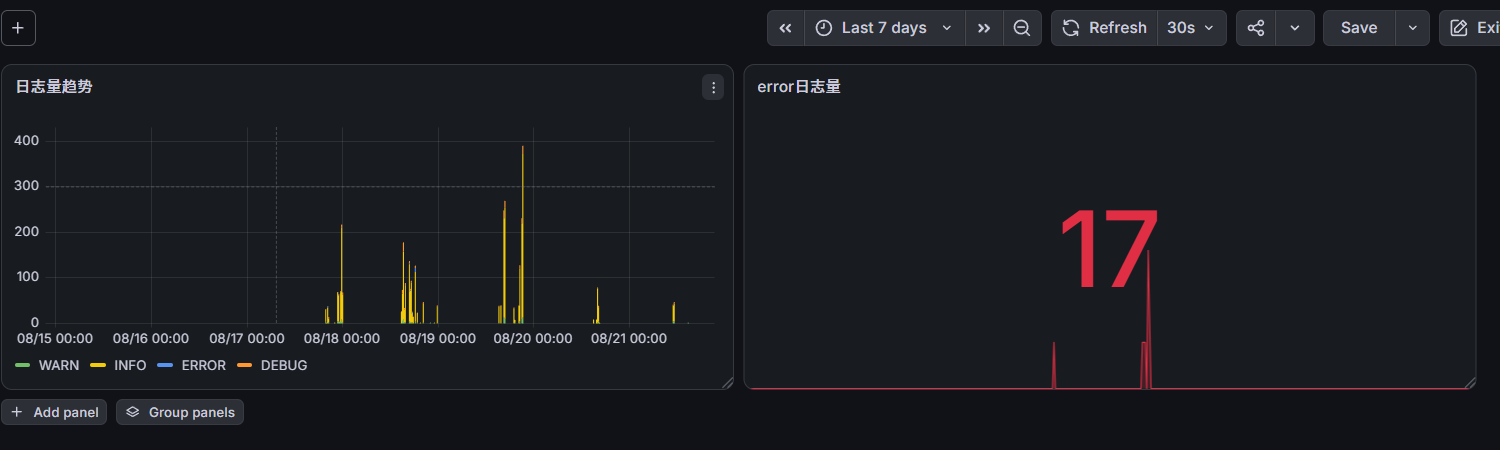
三、实现日志总量
1.选择方式都和ERROR日志量差不多,唯一的区别如图
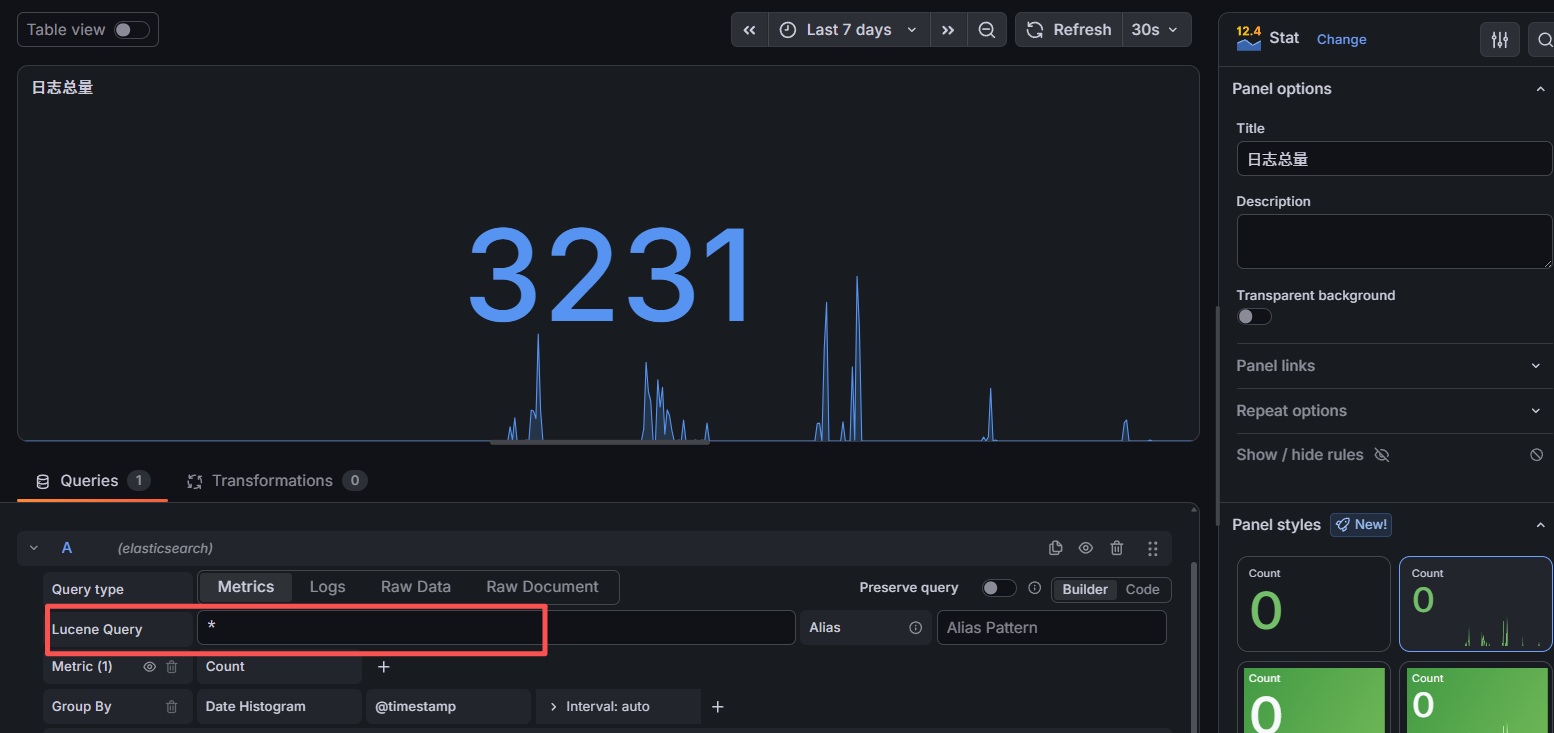
2.现在的总的效果如下图
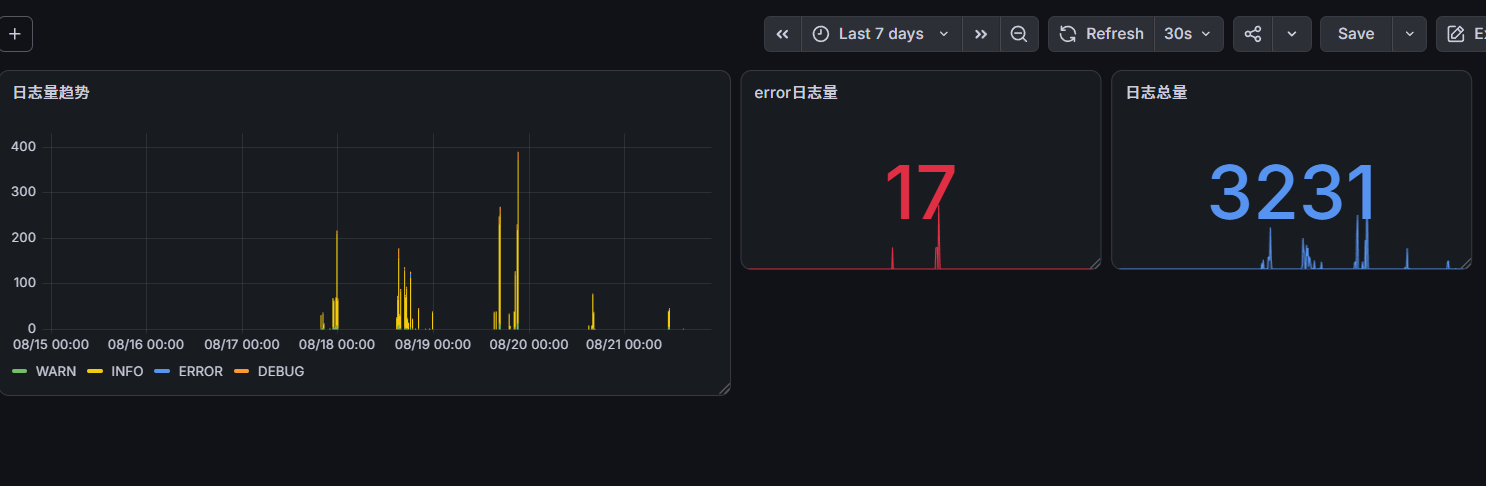
在编辑状态下可以改变panel大小和位置
四、实现top10 logger分布
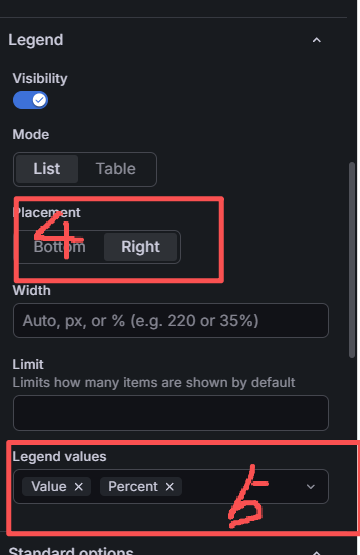
1.数据源的选择方式和前面一样,这次选择的panel类型是pie chart,如下图
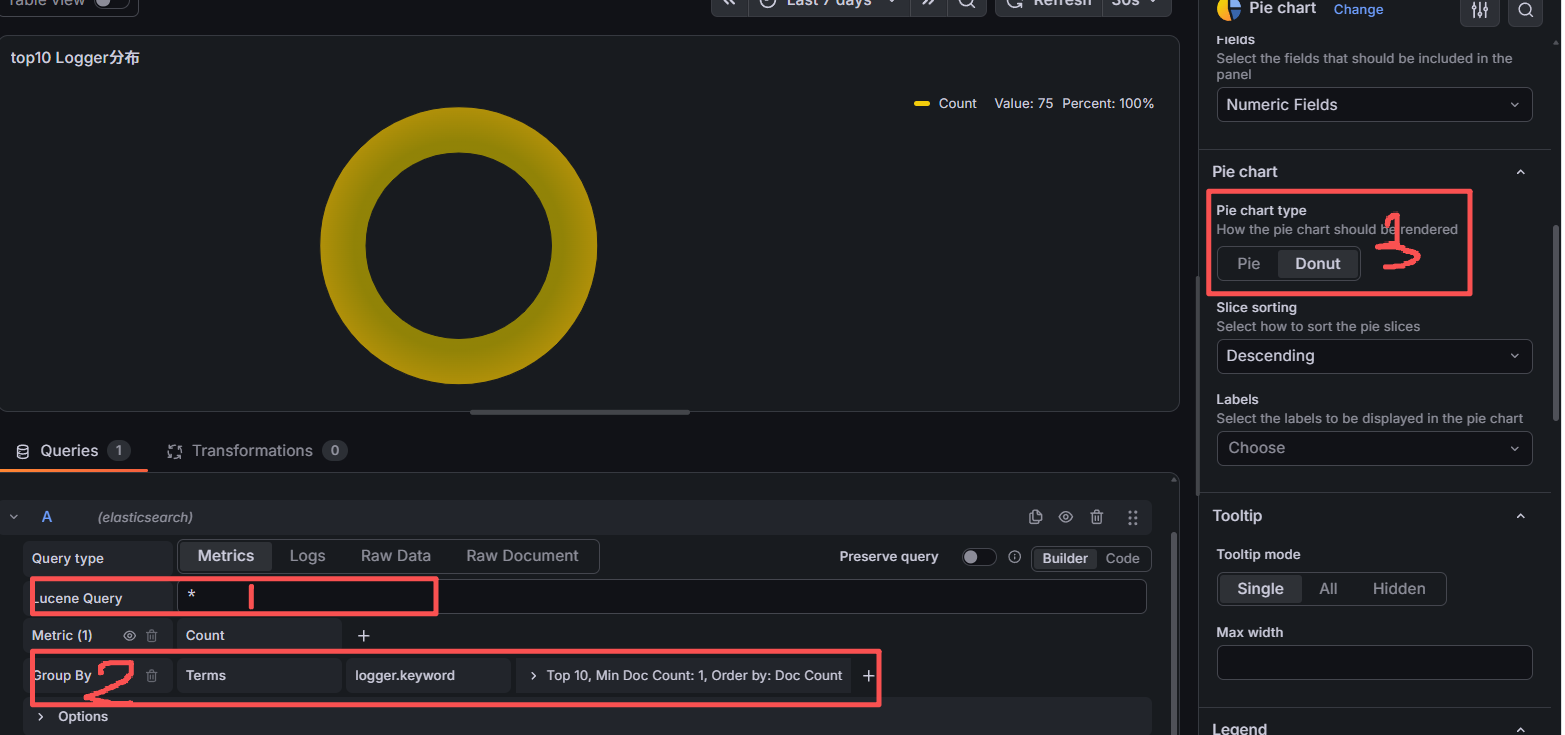
2.最终效果如下:
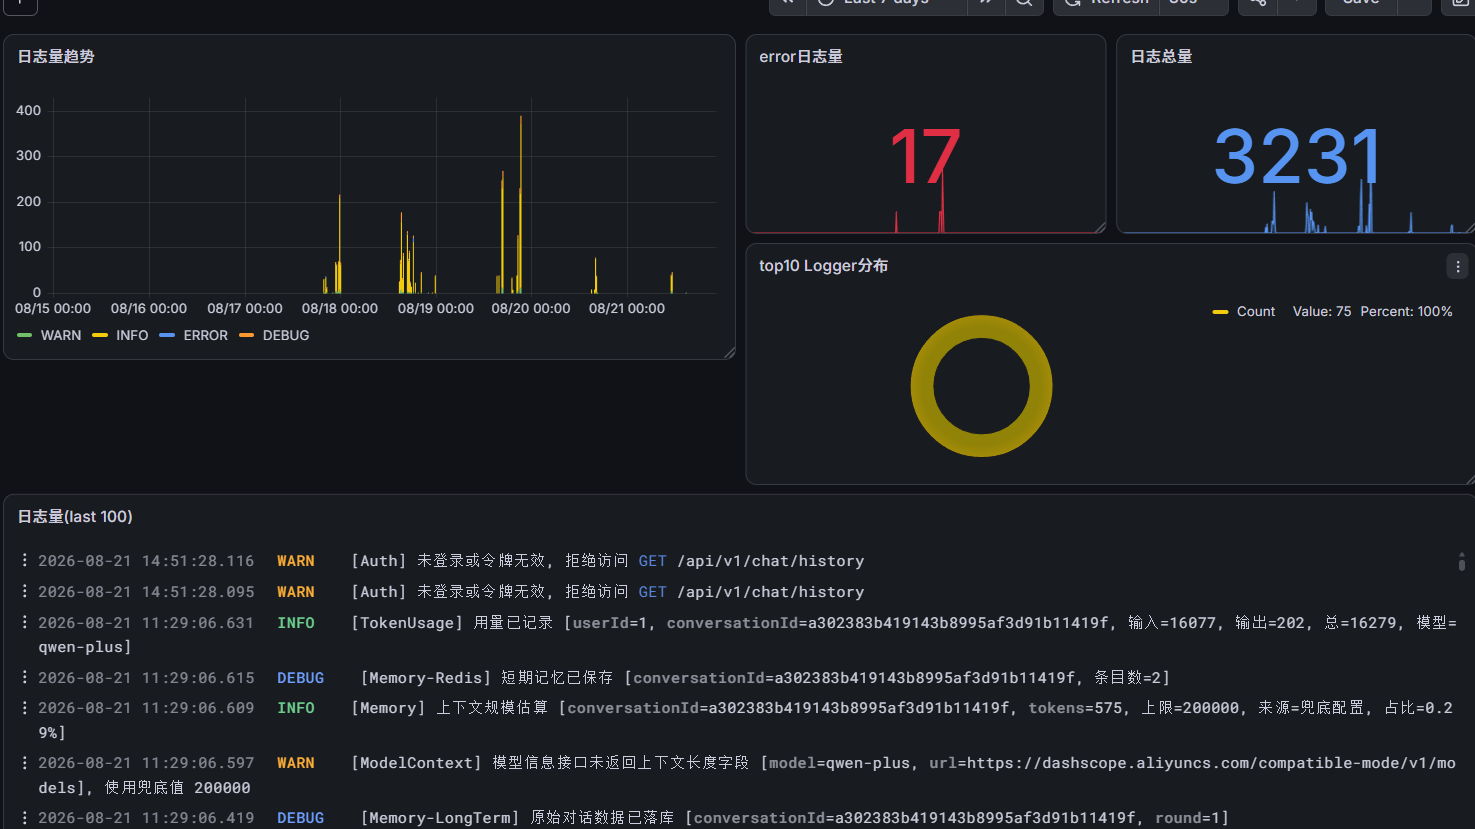
五、实现前100日志查询
1.数据源一样的配置elastic search,panel选择为logs,具体配置如下:
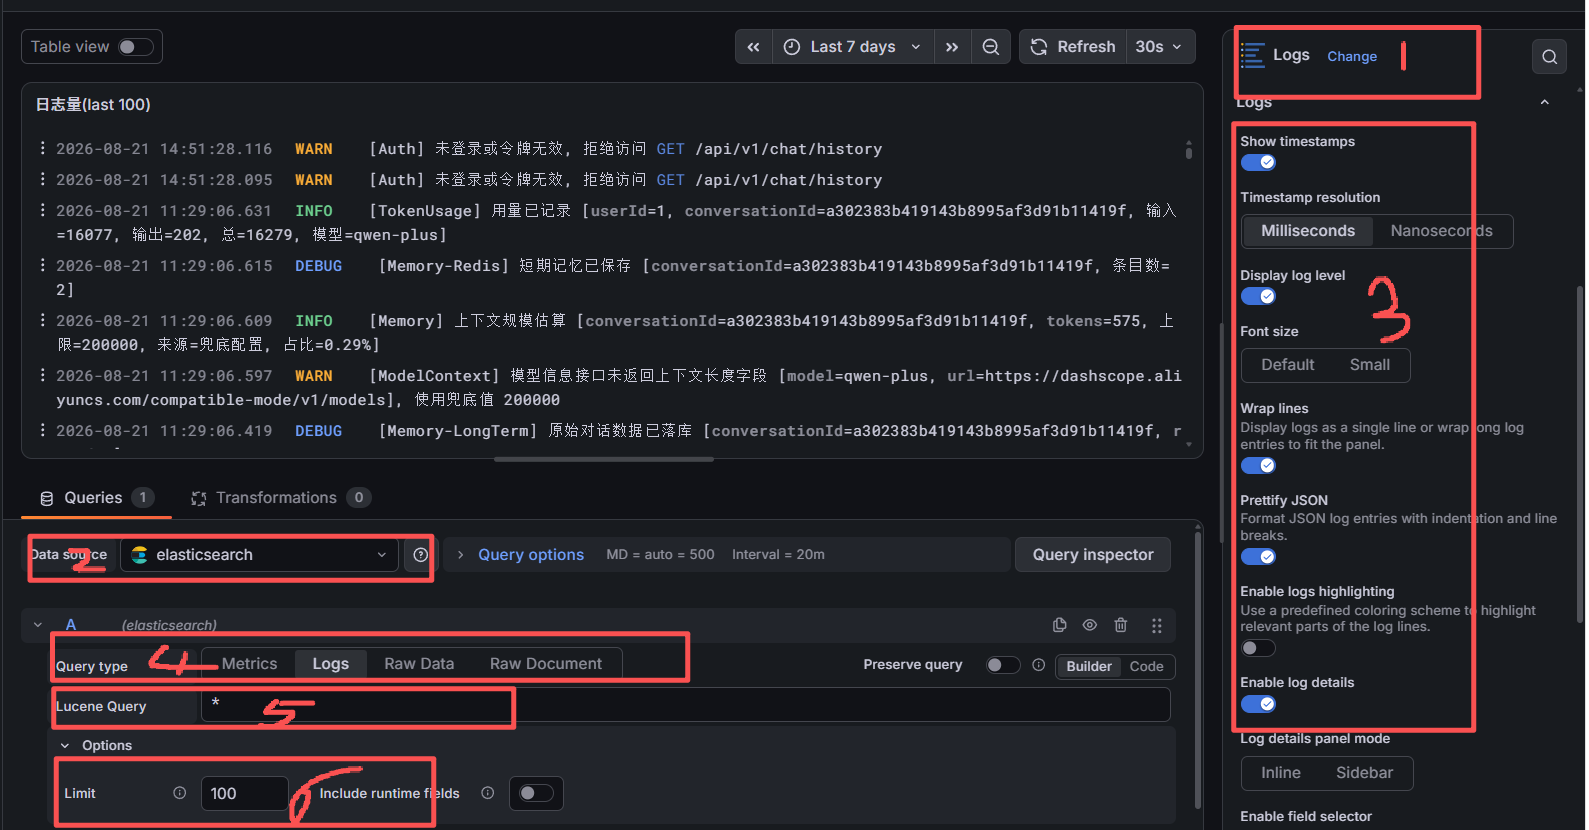
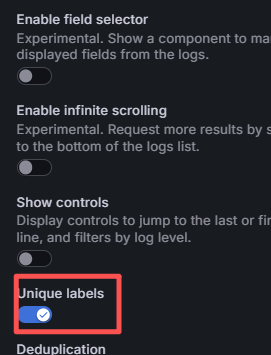
2.最新效果如下:
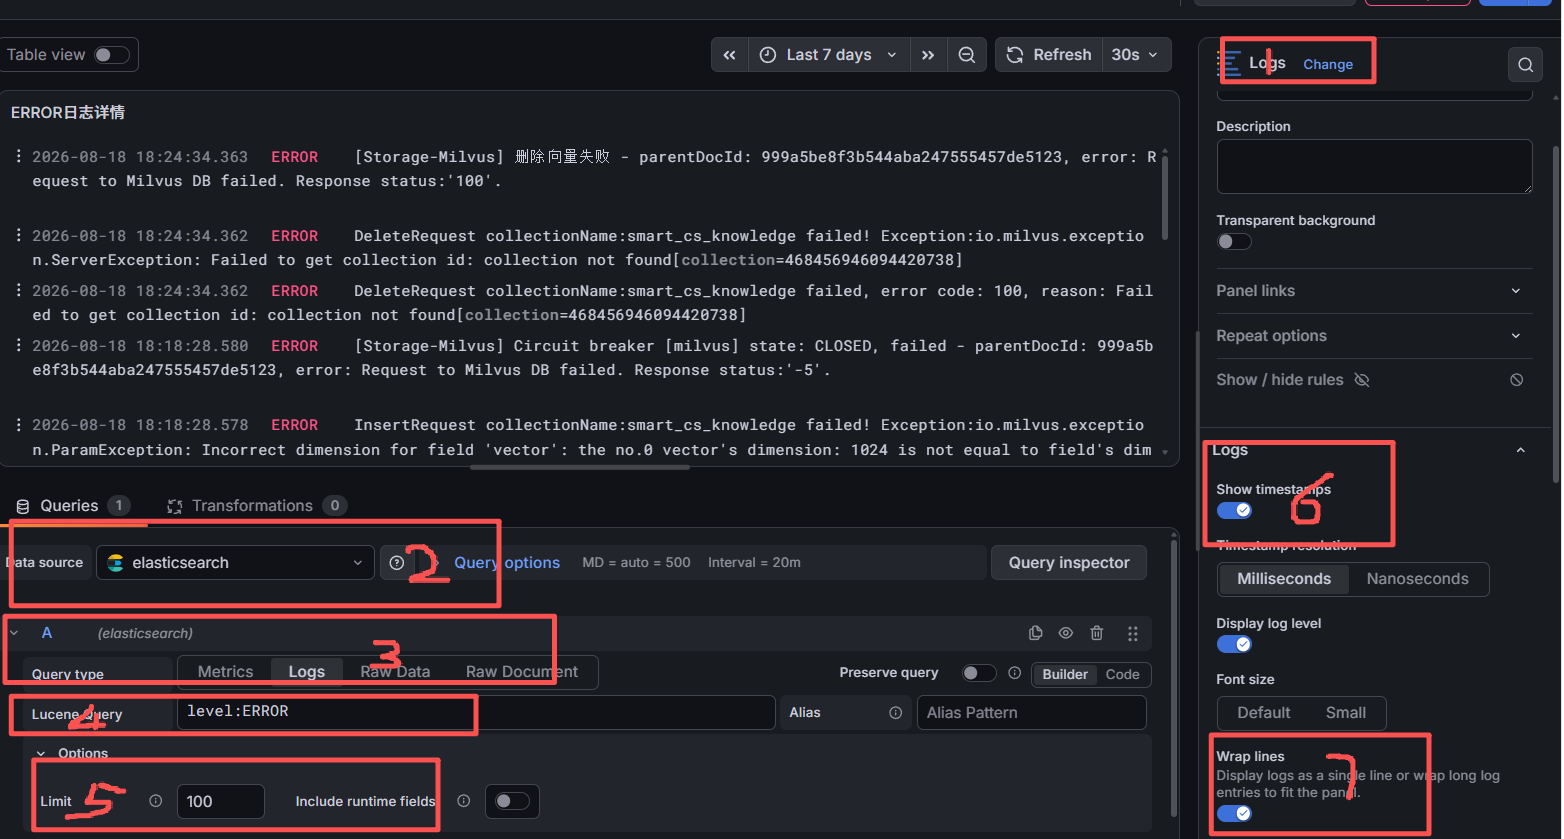
六、实现ERROR日志详情
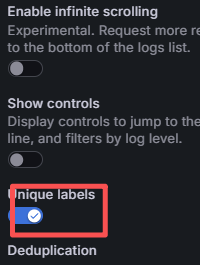
1.同样配置elastic search数据源,panel选择logs,具体如下:
3.最后的效果如下: