前言
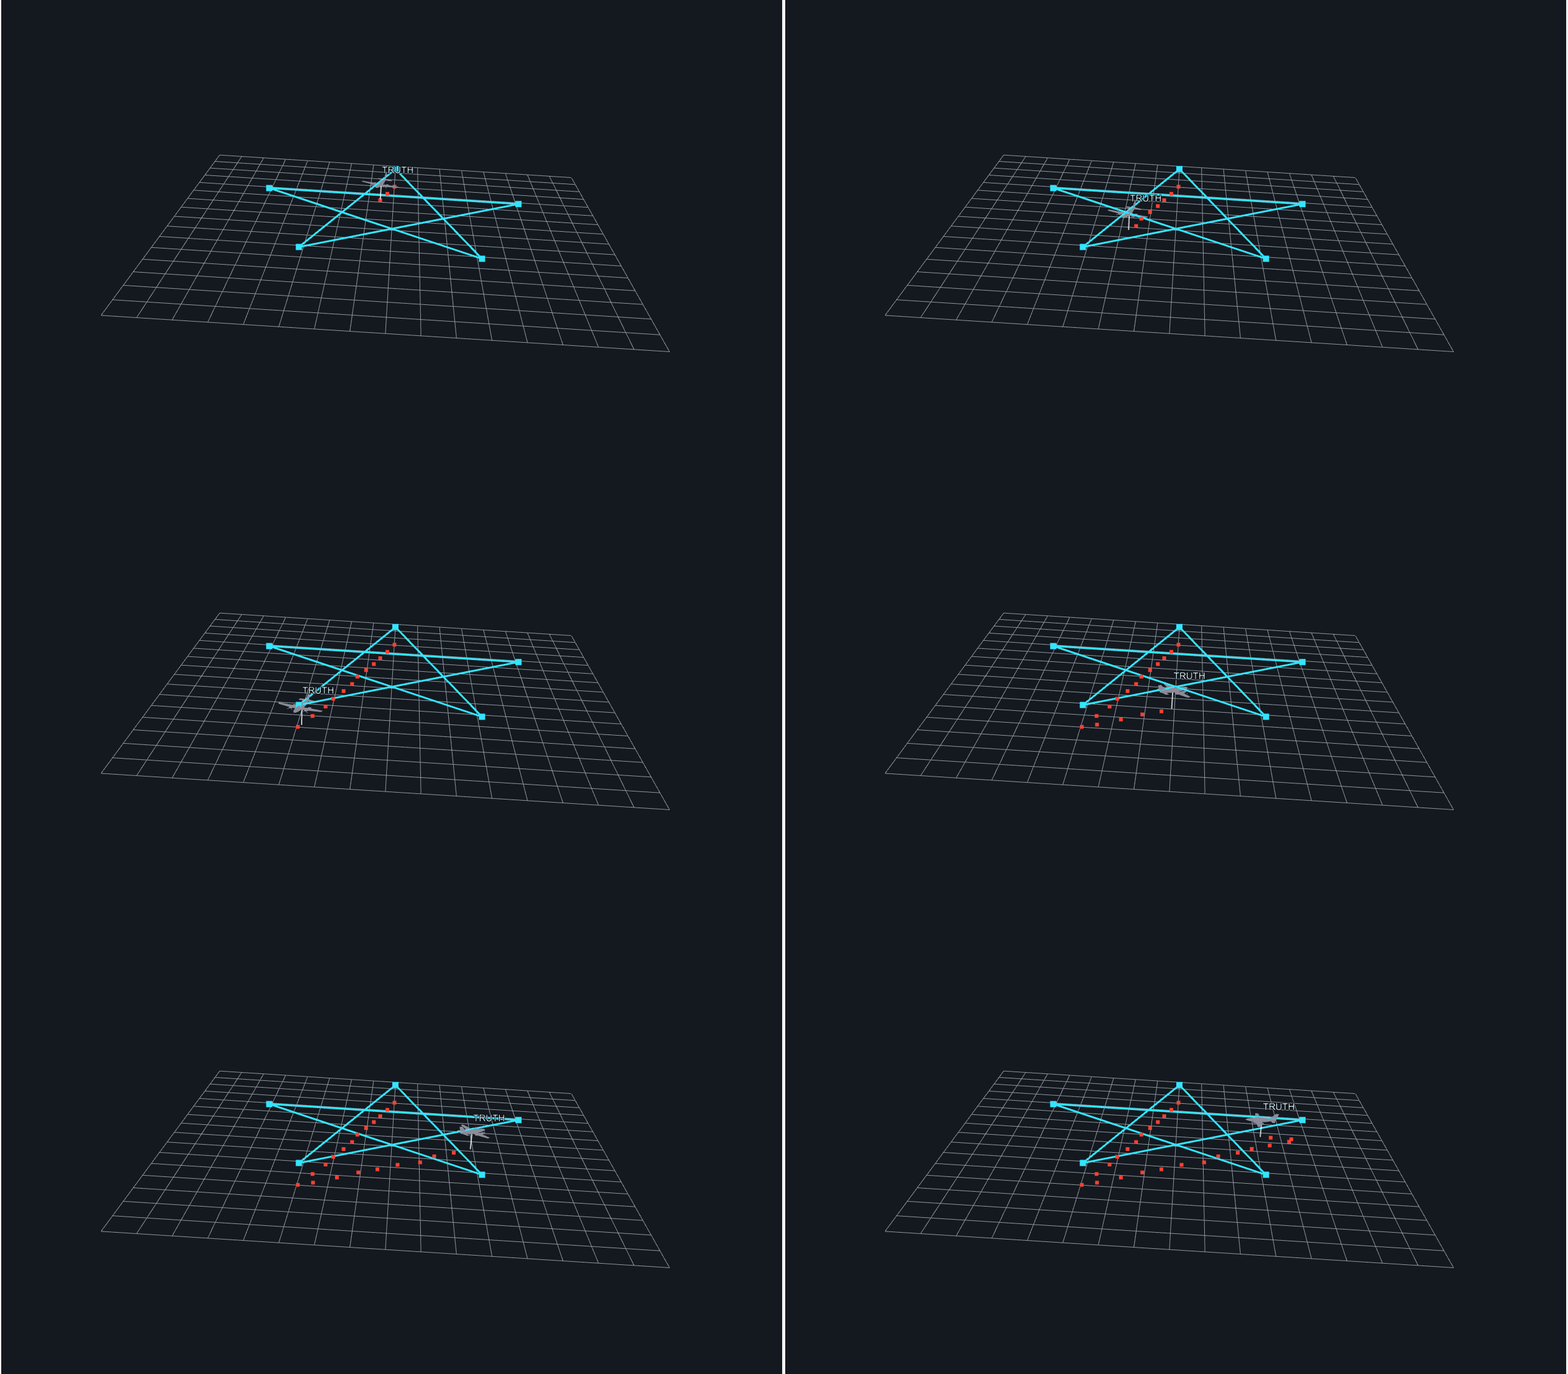
在上一篇【qt openGL入门笔记】OSG实现飞机模型在网格图上飞行(一)-CSDN博客的基础上增加点迹显示功能,点迹显示在地图上。
效果图
代码结构变化
新增SituationCore
新增一个文件SituationCore.h,用于管理数据,当前包含五角星航线数据和雷达数据,其中五角星航线数据是从负责3D 态势图层的SituationScene的构造函数中挪出来。
| 成员 | 类型 | 一句话职责 | 谁调用 | 调用频率 |
|---|---|---|---|---|
starVertex(i) |
函数 | 算第 i 个五角星顶点坐标 | truthPos/truthVel/画航线 SituationScene画航线折线 SituationScene画顶点标记 | 初始化+每帧 |
starSeq(k) |
函数 | 查星形飞行顺序表 | truthPos/truthVel/画航线 SituationScene画航线折线 | 同上 |
truthPos(t) |
函数 | 真值位置 = 时间→坐标 | 显示层、RadarSim | 每帧30Hz |
truthVel(t) |
函数 | 真值方向 = 时间→单位向量 | 显示层(对机头) | 每帧30Hz |
gaussRand() |
函数 | 产生一个高斯随机数 | RadarSim | 每个点迹2次 |
Plot |
结构体 | 一次雷达测量的结果 | 全链路传递 | 每0.5s一个 |
polarToWorld(p) |
函数 | 极坐标→直角坐标 | 显示层 | 每个点迹1次 |
RadarSim::step() |
类方法 | 按节拍产生带噪测量 | MainWindow | 每帧调用 |
SceneUtil.h
增加了4个与点迹相关的函数:
// ------------------------------------------------------------
// setupDynamic:让 Geometry 可以每帧更新的"三件套"。
// OSG 默认用显示列表缓存 GPU 命令------CPU 侧改了顶点,缓存不知道,
// 表现为"加了点但屏幕没反应"。三件套 = 改用实时 VBO 提交。
// ------------------------------------------------------------
inline void setupDynamic(osg::Geometry* g)
{
    g->setDataVariance(osg::Object::DYNAMIC);   // ① 声明:数据每帧会变
    g->setUseDisplayList(false);                // ② 关闭显示列表缓存
    g->setUseVertexBufferObjects(true);         // ③ 用 VBO,dirty() 即上传
}

// ------------------------------------------------------------
// makePoints:点迹图层(动态点集)
//   cap = 最多保留多少个点。点迹会无限到来,不设上限内存和顶点数
//   无限涨------行业做法是只留最近 N 个(FIFO),即"航迹余辉"长度。
// ------------------------------------------------------------
inline osg::Geometry* makePoints(float pixelSize, const osg::Vec4& color, unsigned cap)
{
    osg::ref_ptr<osg::Geometry> g = new osg::Geometry;
    setupDynamic(g.get());

    osg::ref_ptr<osg::Vec3Array> v = new osg::Vec3Array;
    v->reserve(cap + 1);                        // 预分配,避免频繁扩容
    g->setVertexArray(v.get());
    g->addPrimitiveSet(new osg::DrawArrays(GL_POINTS, 0, 0));  // 初始 0 个点

    osg::ref_ptr<osg::Vec4Array> c = new osg::Vec4Array;
    c->push_back(color);                        // 所有点共用一个颜色
    g->setColorArray(c.get(), osg::Array::BIND_OVERALL);

    osg::StateSet* ss = g->getOrCreateStateSet();
    ss->setMode(GL_LIGHTING, osg::StateAttribute::OFF);
    ss->setAttributeAndModes(new osg::Point(pixelSize));          // 点直径(像素)
    ss->setAttributeAndModes(new osg::Depth(osg::Depth::ALWAYS)); // 信息层不被遮挡
    return g.release();
}

// ------------------------------------------------------------
// appendPoint:尾部加点,超 cap 从头部淘汰(FIFO)。
//   改完必须 dirty(),否则数据只在 CPU 内存里,GPU 看不见。
// ------------------------------------------------------------
inline void appendPoint(osg::Geometry* g, const osg::Vec3& p, unsigned cap)
{
    auto* v = static_cast<osg::Vec3Array*>(g->getVertexArray());
    if (v->size() >= cap)
        v->erase(v->begin());                   // 淘汰最老的点

    v->push_back(p);

    // 顶点数量变了 → 图元描述同步更新
    if (auto* da = dynamic_cast<osg::DrawArrays*>(g->getPrimitiveSet(0)))
        da->set(GL_POINTS, 0, GLsizei(v->size()));

    v->dirty();                                 // ★ 通知 OSG 重新上传
}

// ------------------------------------------------------------
// rewritePoint:就地改第 i 个顶点(过程3航迹线的预热------
//   航迹线是"顶点数固定、位置每帧更新",正是它的用武之地)
// ------------------------------------------------------------
inline void rewritePoint(osg::Geometry* g, unsigned i, const osg::Vec3& p)
{
    auto* v = static_cast<osg::Vec3Array*>(g->getVertexArray());
    if (i < v->size()) { (*v)[i] = p; v->dirty(); }
}
SituationScene变更
增加点迹图层,把五角星数据移出,新增与点迹有关的buildPlots、addPlot、updateTruth
#include "SituationCore.h"   // ★ 视图层依赖数据层:addPlot 需要 Plot 类型


    // ★ 喂给态势一个雷达点迹(MainWindow 调用)
    void addPlot(const situ::Plot& plot);
    void buildPlots();      // ★ 点迹图层
    osg::ref_ptr<osg::Geometry> m_plotGeom;       // 点迹动态几何体
    unsigned                    m_plotCap = 240;  // 内存上限:240点≈2分钟历史

SituationScene::SituationScene(osg::Group* root, osg::Node* model)
    : m_root(root)
{
    ... ...
    buildPlots();      // ★ 新增图层
    ... ...
}

由调用本地函数,改成调用SituationCore的starVertex和starSeq
void SituationScene::buildStarRoute(){
    // a) 航线折线
    for (int i = 0; i < 5; ++i)              // LOOP 模式自动回到起点闭合
            //v->push_back(osg::Vec3(m_star[m_seq[i]]));
            v->push_back(osg::Vec3(situ::starVertex(situ::starSeq(i))));

    // b) 顶点标记
    for (int i = 0; i < 5; ++i)//绘制五角星
            //v->push_back(osg::Vec3(m_star[i]));
            v->push_back(osg::Vec3(situ::starVertex(i)));
}

// ------------------------------------------------------------
// 图层3: ★ 新增点迹
// ------------------------------------------------------------
void SituationScene::buildPlots()
{
    // 6 像素红点,上限 240 个。返回的 Geometry 是"活的":
    // 之后每来一个点迹就 appendPoint 一次,图形自动增长
    m_plotGeom = su::makePoints(6.f, osg::Vec4(1.f, 0.25f, 0.2f, 1.f), m_plotCap);

    osg::ref_ptr<osg::Geode> geode = new osg::Geode;
    geode->addDrawable(m_plotGeom.get());
    m_root->addChild(geode.get());
}

void SituationScene::addPlot(const situ::Plot& plot)
{
    // 极坐标 → 直角坐标(数据层的换算函数,z=0)
    const osg::Vec3d p = situ::polarToWorld(plot);

    // z 强制 0.6:二坐标雷达测不到高度,点迹只能落在地面。
    // 所以红点云贴地、飞机在 800m 高空------两者之间靠白色垂线联系。
    su::appendPoint(m_plotGeom.get(),
                    osg::Vec3(float(p.x()), float(p.y()), 0.6f),
                    m_plotCap);
}

// ------------------------------------------------------------
// ★★ 本过程核心算法★★
// 每帧驱动:"调数据层 + 摆矩阵"。
// ------------------------------------------------------------
void SituationScene::updateTruth(double t)
{
    const osg::Vec3d pos = situ::truthPos(t);
    const osg::Vec3d dir = situ::truthVel(t);
    osg::Quat rot;  rot.makeRotate(osg::Vec3d(0, -1, 0), dir);
    m_airMt->setMatrix(osg::Matrix::rotate(rot) * osg::Matrix::translate(pos));
}
MainWindow更新
situ::RadarSim  m_radar;      // ★ 雷达模拟器(过程2新增)

    m_radar.setNoise(80.0, 0.004);      // 测量误差:距离±80m,方位±0.23°(可调,见实验)

// 仿真节拍:唯一的职责是"推时钟 + 驱动场景"。
// 注意数据循环(30Hz)与渲染循环(60Hz)是两条独立的线,
// 渲染线程每帧画的都是当前最新的场景状态------这就是"数据与显示解耦"。
void MainWindow::onTick()
{
    m_simTime += m_dt;                  // 暂停时不进这里,时钟冻结
    // ① 雷达节拍:本拍可能出 0 个或 1 个点迹(扫描周期限制)
    situ::Plot plot;
    if (m_radar.step(m_simTime, plot)) {
        // qDebug("plot t=%.1f R=%.0f", plot.t, plot.range);  // 调雷达时打开
        m_scene->addPlot(plot);        // 数据层 → 显示层,只传"测量结果"
    }

    // ② 飞机按真值飞
    m_scene->updateTruth(m_simTime);
}
数据流全图
MainWindow::onTick(30Hz 仿真时钟)
│
├─① m_radar.step(t, plot) 【数据层】
│ truthPos(t) 取真值
│ → 算 R/θ → 叠加高斯噪声 → 填 Plot
│ (没到 0.5s 间隔就返回 false,本拍没有点迹)
│
├─② m_scene->addPlot(plot) 【场景层】
│ polarToWorld 极→直角
│ → appendPoint 追加顶点 + FIFO
│ → dirty() → 下一帧 GPU 画出红点
│
└─③ m_scene->updateTruth(t) 【场景层调数据层函数】
situ::truthPos → m_airMt->setMatrix