1、查看慢sql的配置信息
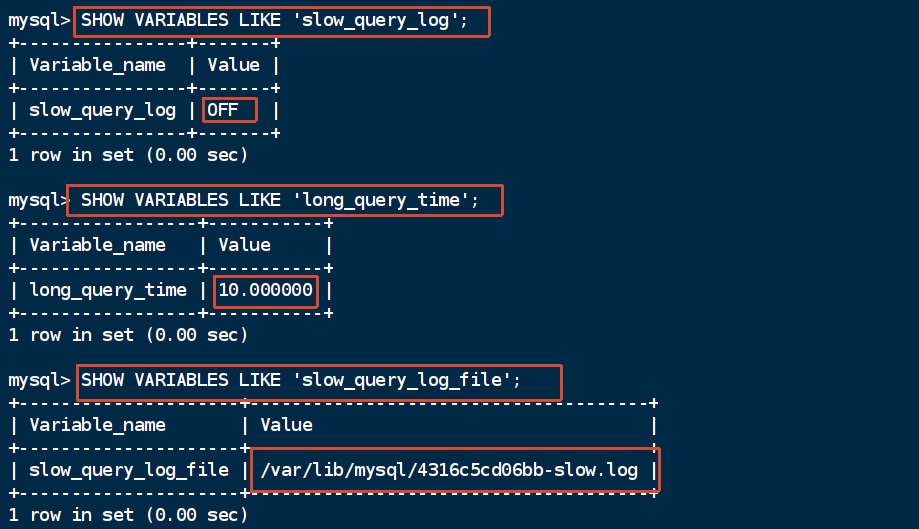
在mysql命令行中分别执行下面的三行语句。
sql
SHOW VARIABLES LIKE 'slow_query_log';
SHOW VARIABLES LIKE 'long_query_time';
SHOW VARIABLES LIKE 'slow_query_log_file';
参数的含义:
| 参数 | 含义 |
|---|---|
slow_query_log |
慢查询日志是否开启 |
slow_query_log_file |
慢查询日志文件路径 |
long_query_time |
超过多少秒算慢 SQL,默认 10 秒 |
2、开启慢sql并设置阈值
sql
SET GLOBAL slow_query_log = ON;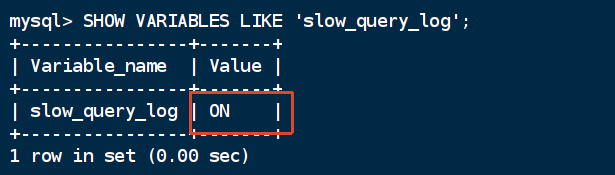
sql
-- 这里把阈值设为 1 秒,方便后面模拟慢 SQL,修改后断开当前连接后重新连接下
SET GLOBAL long_query_time = 1;
3、模拟一条慢 SQL
回到 MySQL,执行:
sql
SELECT SLEEP(2);这条语句会休眠 2 秒,超过我们设置的 long_query_time = 1,所以理论上会被记录到慢查询日志里。
4、查看慢查询日志是否生成
先在 MySQL 里确认日志文件路径:
sql
SHOW VARIABLES LIKE 'slow_query_log_file';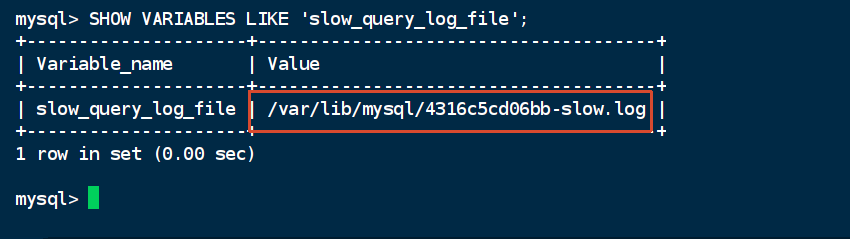
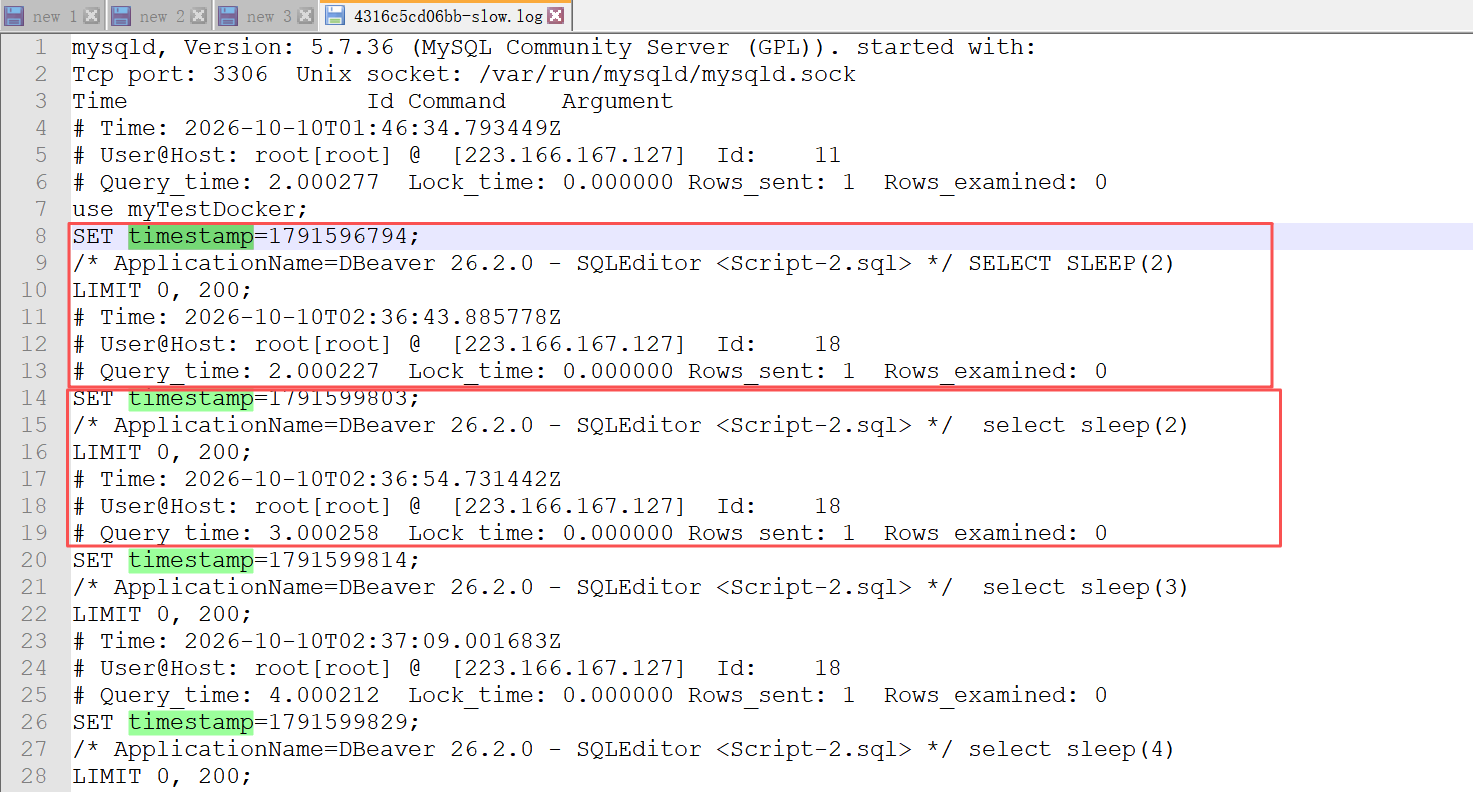
5、打开slow慢文件
bash
mysqld, Version: 5.7.36 (MySQL Community Server (GPL)). started with:
Tcp port: 3306  Unix socket: /var/run/mysqld/mysqld.sock
Time                 Id Command    Argument
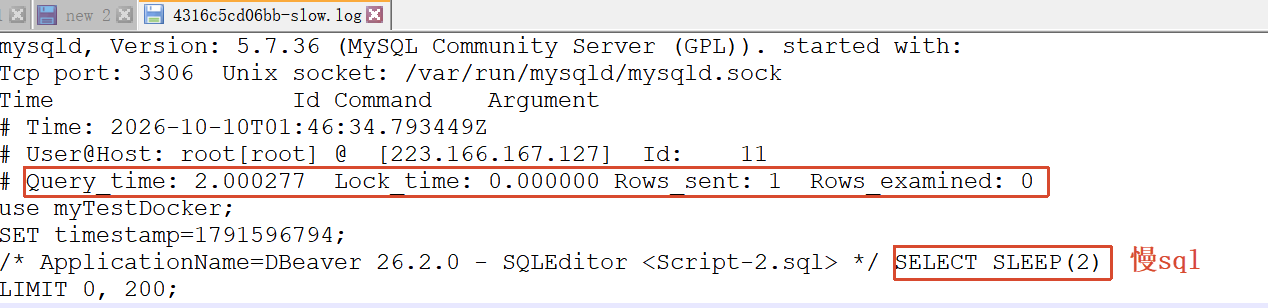
# Time: 2026-10-10T01:46:34.793449Z
# User@Host: root[root] @  [223.166.167.127]  Id:    11
# Query_time: 2.000277  Lock_time: 0.000000 Rows_sent: 1  Rows_examined: 0
use myTestDocker;
SET timestamp=1791596794;
/* ApplicationName=DBeaver 26.2.0 - SQLEditor <Script-2.sql> */ SELECT SLEEP(2)
LIMIT 0, 200;
6、slow慢文件含义
其中几个字段很重要:
- Query_time:SQL 执行耗时
- Lock_time:锁等待时间
- Rows_sent:返回给客户端的行数
- Rows_examined:实际扫描的行数
| 字段 | 值 | 含义 |
|---|---|---|
Query_time |
2.000277 | SQL 执行耗时约 2 秒 |
Lock_time |
0.000000 | 没有锁等待 |
Rows_sent |
1 | 返回了 1 行数据 |
Rows_examined |
0 | 扫描了 0 行(因为 SLEEP() 不查表) |
7、实际排查慢 SQL 时怎么定位问题
真正排查时,不要只看 Query_time,还要重点看:
当你在线上环境抓到真正的慢 SQL 时(比如一条 SELECT * FROM orders WHERE user_id = 123),分析步骤如下:
7.1、看 Rows_examined vs Rows_sent
如果 Rows_examined 远大于 Rows_sent,说明扫描了很多行但只返回少量数据,大概率缺索引或索引失效。
例如:
text
Query_time: 3.2s
Rows_sent: 10
Rows_examined: 500000
Rows_examined: 500000,Rows_sent: 10 → 扫描 50 万行只返回 10 行,问题很明显。
这说明扫描了 50 万行,只返回 10 行,大概率是 缺少索引、索引失效或全表扫描。
7.2、用 EXPLAIN 分析 SQL
把慢日志里的 SQL 拿出来,在 MySQL 里看执行计划,具体分析。
8、用 mysqldumpslow 分析慢 SQL
如果日志里记录了很多慢 SQL,直接看文件会很乱。可以用 MySQL 自带的 mysqldumpslow 分析。
先看最慢的前 10 条:
bash
sudo mysqldumpslow -s t -t 10 /var/log/mysql/mysql-slow.log| 命令 | 含义 |
|---|---|
-s t |
按总耗时排序 |
-s at |
按平均耗时排序 |
-s c |
按出现次数排序 |
-s r |
按返回行数排序 |
-t 10 |
只看前 10 条 |
N 是 mysqldumpslow 把数字替换成的占位符,表示这类 SQL 的模式
bash
root@4316c5cd06bb:/var/lib/mysql# ls
4316c5cd06bb-slow.log  ca-key.pem  client-cert.pem  ib_buffer_pool  ib_logfile1  ibtmp1        mysql               private_key.pem  server-cert.pem  sys
auto.cnf               ca.pem      client-key.pem   ib_logfile0     ibdata1      myTestDocker  performance_schema  public_key.pem   server-key.pem
root@4316c5cd06bb:/var/lib/mysql#  mysqldumpslow -s t -t 10 4316c5cd06bb-slow.log

Reading mysql slow query log from 4316c5cd06bb-slow.log
Count: 2  Time=2.50s (5s)  Lock=0.00s (0s)  Rows=1.0 (2), root[root]@[223.166.167.127]
  /* ApplicationName=DBeaver N.N.N - SQLEditor <Script-N.sql> */  select sleep(N)
  LIMIT N, N

Count: 1  Time=4.00s (4s)  Lock=0.00s (0s)  Rows=1.0 (1), root[root]@[223.166.167.127]
  /* ApplicationName=DBeaver N.N.N - SQLEditor <Script-N.sql> */ select sleep(N)
  LIMIT N, N

Count: 1  Time=0.00s (0s)  Lock=0.00s (0s)  Rows=0.0 (0), 0users@0hosts
  mysqld, Version: N.N.N (MySQL Community Server (GPL)). started with:
  # Time: N-N-10T01:N:N.793449Z
  # User@Host: root[root] @  [N.N.N.N]  Id:    N
  # Query_time: N.N  Lock_time: N.N Rows_sent: N  Rows_examined: N
  use myTestDocker;
  SET timestamp=N;
  /* ApplicationName=DBeaver N.N.N - SQLEditor <Script-N.sql> */ SELECT SLEEP(N)
  LIMIT N, N

Died at /usr/bin/mysqldumpslow line 167, <> chunk 4.
root@4316c5cd06bb:/var/lib/mysql# 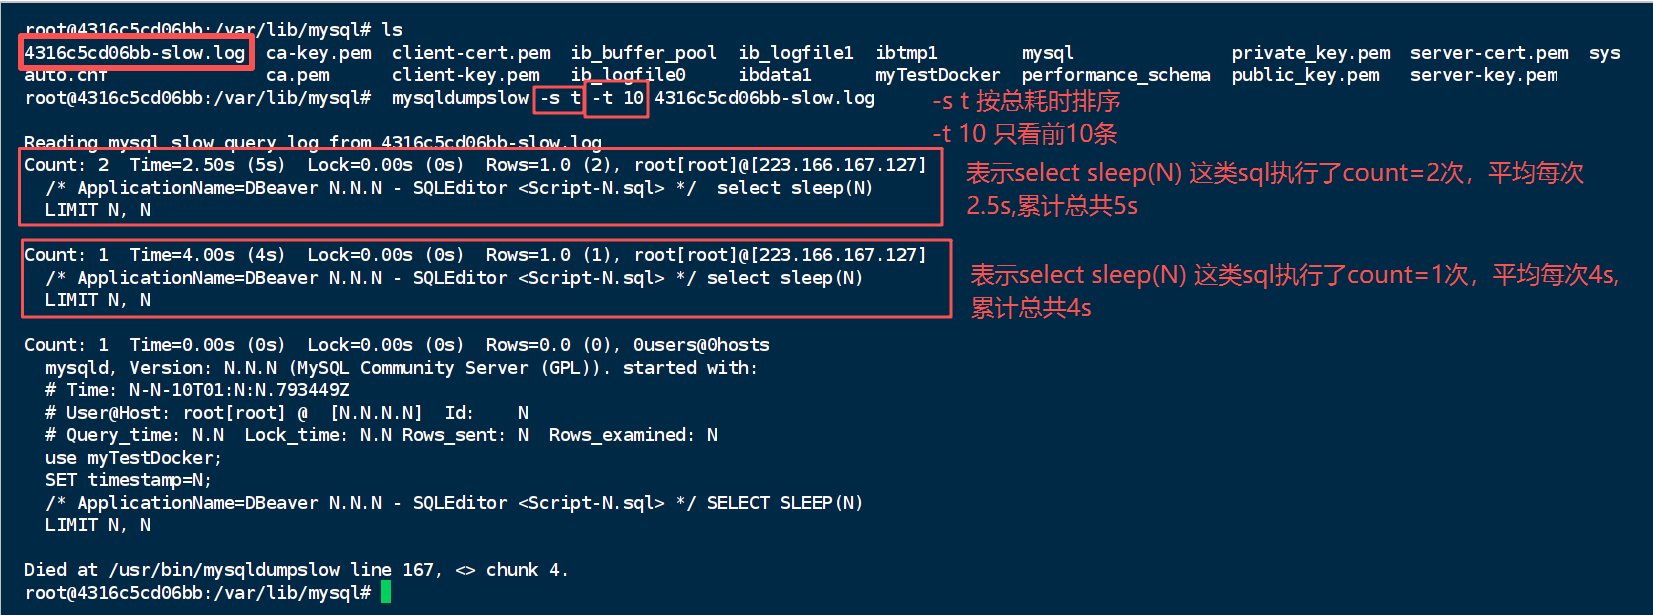
9、如果想永久生效慢sql的配置
临时配置重启 MySQL 后会失效。永久生效需要改配置文件,通常是:
在 mysqld 下面添加:
ini
[mysqld]
slow_query_log = ON
slow_query_log_file = /var/log/mysql/mysql-slow.log
long_query_time = 1
保存后重启 MySQL:
bash
sudo systemctl restart mysql