一个后台泵、两次探数,和那些被漏采的小块
你大概写过这样的两行:pprof.StartCPUProfile(f) 开录,隔一会儿 pprof.StopCPUProfile() 收工,然后拿 go tool pprof cpu.pprof 看火焰图。奇怪的是,StartCPUProfile 几乎立刻就返回了,真正把文件一点点写满的是谁?而当你顺手 curl /debug/pprof/goroutine?debug=2 想在几十万 goroutine 的进程上看一眼全量栈,终端却明显卡了一下------同样是「抓一份剖析」,一个在后台慢慢写,一个却像把整个世界按了暂停,差别从哪儿来?
答案都落在 runtime/pprof 的写侧:pprof.go 第 579~998 行,再加一个只有 94 行的 protomem.go。柜台怎么摆、工单怎么查、标签怎么贴,那是另一层的事;本文只盯住「数据已经抓到手之后」------怎么把一份快照完整地捞出来、怎么把一段 CPU 流边攒边写成文件、怎么把被抽样漏掉的小块按概率放大回去,以及为什么这些写侧函数宁可走 //go:linkname 后门,也不肯用 runtime 的导出 API。
读法上先说好三件事:代码块右侧的 // ← 是逐行注释,行号都是 go1.24.0 的实际行号(protomem.go 单独标注);每一节先给一张数据流画面,再上源码,末尾把这一节最容易卡住的问题拆成「难点」;文中 §2.4 这类写法只是本文自己的小节号 (第 2 节第 4 小节),「难点 A~H」是八个最容易卡住的问题的代号,每一个都做成带问题标题的小节、挂在讲它的那一节末尾------按名字找就行,不需要对照任何别的资料。源码里的逐行注释一行不删,只补白话和过渡。
读完之后,你应该能解释清楚两件初看很别扭的事:为什么 Go 宁可让 StopCPUProfile 阻塞在一个光秃秃的 <-cpu.done 上,也不肯关掉信号就返回;以及为什么文本格式的 heap 头要把采样率报成两倍,proto 里却又老老实实给准确值。这两个「别扭」背后是同一条朴素原则------写出去的文件必须完整,且数字必须能被工具正确还原。
本文会讲什么
文章按源码从上往下走,但可以记成四条线索:
- 快照:heap、goroutine、threadcreate、block、mutex 怎么靠「先问有多少、再多留一点、装不下就重来」把数据一次捞全(§1、§2、§4)
- 录像 :CPU 的
StartCPUProfile/profileWriter/StopCPUProfile三件套,100Hz 与 100ms 各管什么,以及 Stop 为什么必须等cpu.done(§3) - 后门与换算 :七个
//go:linkname声明绕开了什么,cycles 又是怎么除以 GHz 变成纳秒的(§4、§5) - 还债与收束 :
protomem.go的四列样本、泊松补偿公式,以及八条不变量、八个易错点、一张五分钟复述卡(§6~§10)
卡住时翻「黑话速查表」(§0.4)或「行号对照表」(§0.5);想快速复习,直接翻「一页纸速查」(§8)和「五分钟复述卡」(§10)。
0 导读:先把画面立起来
0.1 先说结论:一句话、三句话、先给你半句答案
一句话 本文是「抄账员」真正动手抄账的一页:CPU 靠「开信号 + 后台泵 + 等收工」三件套把账本里的流抄成文件,其余快照靠「先问有多少、再多留一点、装不下就重来」的两段式抓取;最后 heap 还要按泊松采样概率把漏掉的小块放大回去,才能还原真实的内存总量。
拆成三句话:
- CPU 是录像,不是快照 :
StartCPUProfile打开 100Hz 信号并起一个后台泵profileWriter,泵每 100ms 拉一次readProfile()、增量喂给构建器;StopCPUProfile关掉信号后必须等cpu.done,才能保证尾部数据不丢。 - 其余剖析都是「问两次」 :runtime 侧的
*Internal函数有个硬契约------「给的切片装不下,就一个字都不写,只告诉你真实条数 n」。所以writeHeapInternal/writeRuntimeProfile/writeProfileInternal都先 nil 探数、再多留一点余量实取、ok=false就拿新 n 重来。 - 数字要还债 :heap 是抽样统计,小块大多没被采到。
scaleHeapSample按p = 1−e^(−S/R)把观测值除以采中概率放大回期望总量;文本头那个2×rate和allocBytes++则是两个迁就老工具的「善意谎言」。
读到这里,你可能会冒出下面几个疑问。别急着弄懂------先把每问的半句答案摆在这儿,知道后面要解开什么就够了;每一问在后文都有同名的小标题,会把它拆开讲透。
| 你可能会问 | 先给你半句答案 |
|---|---|
| 「多留 50 条 + 重试」到底在防什么竞态?是哪条契约让它可行? | 防的是探数与实取之间条数又变多;*Internal 契约保证切片装不下就一个字不写、只报真实条数,所以能按新条数放心重来。 |
文本头 heap/2*rate 的 2× 与 proto 里 Period=rate 的 1× 为什么不一致? |
不是算错:文本头的 2× 是迁就老版 pprof 的「礼貌值」,proto 的准确值要拿去算泊松补偿,读者不同、口径自然不同。 |
debug=2 抓 goroutine 栈为什么在大进程上会明显卡一下? |
因为它短路到 runtime.Stack 直接倒全文本栈,全程停世界(STW),几十万 goroutine 时自然明显卡顿;大进程改用 debug=1。 |
profileWriter 为什么睡 100ms 再拉,而不是一返回就立刻再读? |
100ms 是泵的搬运周期,让账本攒一小批再搬;一返回就立刻读会退化成忙轮询、拉满系统调用,readProfile 本身阻塞、不会丢数据。 |
StopCPUProfile 里那行 <-cpu.done 删了会出什么事? |
关信号只是停产、账本里还有没搬完的;删掉它 Stop 会提前返回,defer f.Close() 抢在泵前面关文件,尾部样本写不进去或写坏 gzip 包。 |
| block / mutex 的 proto 两列值分别叫什么?第二列怎么从 cycles 变纳秒? | 两列叫 contentions(次数)和 delay(纳秒);runtime 给的是 cycles,第二列把它除以 cyclesPerSecond()/1e9 换算成纳秒。 |
| 那些 linkname 后门到底绕开了哪些限制?代价是什么? | 绕开内部类型过不了导出 ABI、导出 API 砍到 32 帧、还要多拷一次这三件事;代价是 runtime 与 pprof 必须同版本编译,混用会对不上符号。 |
scaleHeapSample 为什么小块要放大十倍、大块几乎不放大? |
采样是泊松的,小块大多漏网、大块基本跑不掉;把观测值除以采中概率 p=1−e^(−S/R) 放大回期望,小块系数大、大块趋近 1。 |
关于「难点 A~H」 :它们不是另附的习题,就是后文八个小节的标题,例如「难点 H|泊松补偿:小块为什么要放大十倍」。上面每一问都能按标题直接找到;像
§2.4这样的写法也只是本文自己的小节号(第 2 节第 4 小节),翻到那一节即可。
0.2 站在流水线的哪一段:抄账员动手的那一页,以及为什么难
先用四个角色给整条 CPU 剖析流水线对号入座,看看本文的舞台在哪儿:
text
   ① 闹钟(内核定时器,每 10ms 一响)
           │
           ▼
   ② 被拍肩的工人(sigprof 抓下调用栈)
           │
           ▼
   ③ 环形账本 profBuf(无锁,先摆货再翻牌)
           │
           ▼  readProfile() 把账借走
   ┌───────────────────────────────────────────────┐
   │  ④ 抄账员 · runtime/pprof(本文的舞台)        │
   │                                               │
   │    写侧层:                                    │
   │    writeHeapInternal 两段式 / MemStats         │
   │    StartCPUProfile / profileWriter / Stop      │
   │    writeRuntimeProfile / block / mutex         │
   │    writeHeapProto / scaleHeapSample 泊松补偿   │
   │    七个 linkname 声明                          │
   └───────────────────────────────────────────────┘
           │
           ▼
   cpu.pprof / heap.pprof → go tool pprof
那个「普通 goroutine、可以用锁、可以分配内存」的 ④ 抄账员,源码真身就是 §3 的 profileWriter:一个 go 出来的普通 goroutine,里面 time.Sleep(100 * time.Millisecond) 醒一次,调 readProfile() 从 ③ 账本借账,再交给 profileBuilder 编码。账本怎么被安全地借出是底层的事,本文讲的是借出来之后怎么变成文件。把范围钉死:本文只讲写侧这一层------两段式、流式、单位换算、采样补偿、后门声明;抓栈和环形缓冲这些底层动作,只在需要时提一句。
为什么这段读起来不直观,四条,都是源码的客观结构造成的:
| 不直观在哪 | 具体表现 |
|---|---|
| 同一个模式出现三遍还各带不同余量 | 两段式 + 重试在 615~631(heap,余量 50)、782~802(goroutine,余量 10)、929~937(block / mutex,余量 50)三处 |
| 「历史兼容」混在正经公式里 | 文本头 rate := 2 * runtime.MemProfileRate 与 proto Period=rate 不一致(654~656 行注释),allocBytes++ 也是为了骗 pprof |
| 单位换算藏在输出函数里 | cpuGHz := float64(pprof_cyclesPerSecond()) / 1e9 之后 cycles / cpuGHz 才是纳秒(448 行) |
| 统计补偿需要概率论直觉 | scaleHeapSample 一行 1 / (1 - math.Exp(-avgSize/float64(rate))),不解释根本看不出在除什么 |
一句话记住 :这里不再讲「怎么抓样本」,讲的是抓完之后怎么把账抄完整、抄准确、抄成工具能读的格式。难的不是并发,是「数字背后欠了谁一笔债」。
0.3 全局地图:四条出口,一套两段式
这几个函数看着散,其实只有「四条出口」和「一套公共手法」。先看出口------每个内置窗口的 write 最终落到哪:
text
   Profile.write(w, debug)
        │
        ├── heap / allocs ──► writeHeapInternal ──┬─ debug=0 → writeHeapProto(§6)
        │                                        └─ debug>0 → legacy 文本头 + MemStats
        │
        ├── goroutine ──────► debug>=2 → writeGoroutineStacks(全文本栈)
        │                └─ 否则 → writeRuntimeProfile → 通用打印漏斗
        │
        ├── threadcreate ──► writeRuntimeProfile → 通用打印漏斗
        │
        ├── block / mutex ─► writeProfileInternal ─┬─ debug<=0 → printCountCycleProfile
        │                                          └─ debug>0  → 文本(cycles/second 等)
        │
        └── CPU ──► StartCPUProfile / profileWriter / StopCPUProfile
└─ 流式,边攒边写,不进上面任何漏斗再看那套公共手法,两段式 + 重试 (pprof.go 里 615~631、782~802、929~937 三处都是它):
text
   ① fetch(nil, ...)  ──► 只问「现在有 n 条」,一个字都不写
           │
           ▼
   ② make(切片, n + 余量)  ──► 多留一点,防两次调用之间又长出新桶
           │
           ▼
   ③ fetch(p, ...)  ──► 实取
           │
           ├── ok=true  → p = p[0:n],收工
           └── ok=false → 期间条数变多了,拿返回的**新 n** 回到 ② 重来
这套动作能成立,全靠 runtime 侧
*Internal的契约:「p 装不下就一个字都不写,只告诉你 n」。若 runtime 改成「能装多少装多少」,第二阶段就得自己拼半截数据,代码完全两样。把它想成「先问食堂还有几个位子,再按人数多拿几副碗筷,回来说不够就再数一遍」------问两次、多拿一点、不够就重数,三处代码都是同一套动作。
0.4 黑话速查表(读不下去时先翻这里)
用法:遇到不认识的词,先查「通俗解释」那一列,能继续读就不必深究;想追根问底再按第三列跳。
| 黑话 | 通俗解释 | 本文位置 |
|---|---|---|
| WriteHeapProfile | 老 API,直接调 writeHeap 少查一次表 |
§1 |
| countHeap | heap 有多少条记录,靠 runtime.MemProfile(nil, true) 问 |
§1 |
| writeHeap / writeAlloc | 落到 writeHeapInternal,只差默认视图字符串 |
§1 |
| defaultSampleType | 传给 proto 的「默认看哪一列」,"" 或 alloc_space |
§1、§6 |
| writeHeapInternal | heap 文本 / proto 两条出口的总入口 | §1 |
| 两段式抓取 | 先 nil 探数,再按 n 加余量实取 | §1 |
| nil 探数 | 传 nil 切片只为问「有多少条」 | §1 |
| n+50 / n+10 余量 | 实取时多留的条数,防两次调用间又长新桶 | §1、§2 |
| ok 返回值 | 「这次给的地方够不够」的回执,不够就用新 n 重来 | §1 |
| *Internal 契约 | 装不下就一个字不写,只报真实条数 n | §1 |
| pprof_memProfileInternal | heap 两段式实际调用的 linkname 后门 | §1、§5 |
| MemStats / ReadMemStats | 文本模式附带打印的一堆运行时统计 | §1 |
| 先读统计再分配 | 先 ReadMemStats 再 make,免得自己的缓冲污染数字 |
§1 |
| 2*MemProfileRate | 文本头故意报两倍的采样率,历史兼容 | §1 |
| allocBytes++ | 让 pprof 不至于把四列误判成两列 | §1 |
| legacy 文本头 | heap profile: ... @ heap/N 那一行 |
§1 |
| addMaxRSS | 平台文件补一行最大常驻内存 | §1 |
| bufio + tabwriter | 文本输出的两层缓冲,最后依次 Flush | §1 |
| printStackRecord | 把一串 PC 翻成「函数 + 文件 + 行号」 | §1、§4 |
| countThreadCreate | 问 runtime.ThreadCreateProfile(nil) 有多少条 |
§2 |
| writeRuntimeProfile | goroutine / threadcreate 共用的两段式 + 通用漏斗 | §2 |
| runtimeProfile | 带 labels 的 countProfile 实现 |
§2 |
| writeGoroutineStacks | debug>=2 的短路:直接倒全文本栈 |
§2 |
| debug>=2 短路 | 跳过所有框架,走 panic 同款全栈 | §2 |
| runtime.Stack(buf, true) / STW | 抓全量栈会停世界,大进程明显卡 | §2 |
| 1<<20 / 64<<20 | 全文本栈缓冲 1 MiB 起步、64 MiB 封顶、翻倍重试 | §2 |
| 通用打印漏斗 | 按「栈 + 标签」指纹去重、排序、分两条出口的 printCountProfile |
§2、§4 |
| CPU 流式三件套 | Start / profileWriter / Stop 三个函数 | §3 |
| cpu 全局结构 | 一把锁 + profiling 开关 + done 通道 | §3 |
| cpu.profiling / cpu.done | 「正在剖析吗」与「泵写完了吗」 | §3 |
| hz = 100 | 硬编码 100Hz,样本数约等于秒数乘 100 | §3 |
| SetCPUProfileRate | 开 / 关信号的 runtime 入口 | §3 |
| profileWriter | 后台泵 goroutine,每 100ms 拉一次账 | §3 |
| 100ms 轮询 | time.Sleep(100 * time.Millisecond),平衡延迟与系统调用 |
§3 |
| readProfile | runtime 提供的阻塞式分块读取 | §3 |
| addCPUData | 把拉到的一块增量喂给构建器 | §3 |
| eof | 「剖析已关且数据拉干」的信号 | §3 |
| b.build() | 补表、封包、gzip 的收尾动作 | §3 |
| profileBuilder | 把样本手工编成 protobuf 的构建器 | §3、§6 |
| countBlock / countMutex | 问 runtime.BlockProfile(nil) / MutexProfile(nil) |
§4 |
| writeProfileInternal | block / mutex 共用的两段式 + 排序 + 分出口 | §4 |
| printCountCycleProfile | block / mutex 的 proto 输出,位置靠前、逻辑归 §4 | §4 |
| contentions / delay | proto 两列样本:次数与纳秒 | §4 |
| cycles ÷ GHz = 纳秒 | 把 CPU tick 数换成时间的那一步换算 | §4 |
| pprof_cyclesPerSecond | 问「一秒多少 tick」,darwin 走非阻塞读 | §4、§5 |
| sampling period | 文本侧用负参只读当前 mutex 采样率 | §4 |
| expandInlinedFrames | 把被内联的调用栈重新展开 | §4 |
| 七个 linkname 后门 | 绕过导出 ABI 直达 runtime 的声明 | §5 |
| export ABI / 32 帧截断 | 后门要绕开的两个限制 | §5 |
| protomem.go | heap 的 proto 输出与泊松补偿,全文 94 行 | §6 |
| writeHeapProto | 四列 heap 样本 + bytes 标签 | §6 |
| 四列样本 / sample_index | alloc / inuse 各两列,-sample_index 就认这些名 |
§6 |
| scaleHeapSample | 按采中概率把观测值放大回期望 | §6 |
| 泊松过程 | malloc 采样「累计跨过 R 才记一笔」的数学模型 | §6 |
| p = 1−e^(−S/R) | 大小 S 的分配至少被采一次的概率 | §6 |
| scale = 1/p | 补偿系数,小块大、大块趋近 1 | §6 |
| bytes label | 平均块大小,数值型标签,可按它聚合 | §6 |
| hideRuntime 两轮 | 先藏栈底 runtime 帧,全被截没再不藏重来 | §6 |
0.5 源码行号 ↔ 难点 ↔ 配图对照表
用法:读到某一节卡住,在这张表里找到它,先看「先看的白话」那一格,再回源码。「初读可跳过」打「可以」的,允许先糊弄过去,回头再补。
| 源码位置 | 在讲什么 | 先看的白话 | 配图 | 初读可跳过 |
|---|---|---|---|---|
| §1 · 579~727 行 | heap 三件套、两段式、文本头与 MemStats | §1.1、难点 A / B | 图 9-1 | |
| §2 · 729~814 行 | threadcreate / goroutine、debug≥2 短路、runtimeProfile | §2.1、难点 C | --- | 可以 |
| §3 · 816~902 行 | CPU 流式三件套、100Hz 与 100ms、Stop 等收工 | §3.1、难点 D / E | 图 9-2 | |
| §4 · 904~975 行(含 429~457 行补讲) | block / mutex、cycles ÷ GHz、两列 proto | §4.1、难点 F | --- | 可以 |
| §5 · 977~998 行 | 七个 linkname 声明与三条理由 | §5.1、难点 G | --- | 可以 |
| §6 · protomem.go 全文(94 行) | writeHeapProto 四列、泊松补偿、公式表 | §6.1、难点 H | 图 9-3 | |
| §7 · 串讲 | 快照与录像两条大路完整走一遍 | 全节 | 图 9-1、图 9-2、图 9-3 |
1 heap 三件套与两段式抓取(579~727 行)

图 9-1 两段式抓取 + 重试:nil 探数、多留 50 条余量、实取失败就用新 n 重来;根源是 *Internal「装不下就只报 n」的契约。
看图时抓三处:第一次传 nil 只为问条数,第二次按 n 加余量实取,ok=false 时拿新 n 回到分配那一步;对应 §1.2、§1.4 与难点 A / B。
1.1 先建画面:一份快照要过三道手
把 heap 快照想成「去仓库点货」。仓库(runtime 的 memProfile 桶)一直在进货出货,你要的是「此刻货架上有多少条记录、每条多少字节」。问题是你没法一眼数清,也不许把仓库锁死一整天------程序还在跑,随时会多出几个分配桶。
于是写侧分三道手:
- 先问一句 :拿一个
nil切片去问 runtime「现在大概有几条」,runtime 什么都不写,只回一个条数n; - 按人数多拿几副碗筷 :按
n再加一点余量申请切片,给「两次调用之间又长出新桶」留缓冲; - 真去搬 :把切片递进去实取。若 runtime 回一句
ok=false(「不够,装不下」),它会顺手把新的 n 也给你,拿这个新 n 回到第 2 步重来。
拿到全量记录后还有分岔:debug == 0 走 proto 路径,交给 writeHeapProto 编四列样本;debug > 0 走人读文本,先按 inuse 字节排个序,再拼一层 bufio + 一层 tabwriter,最后把表头和一堆 MemStats 依次刷出去。这一节的两个源码块,就是这三道手加两条出口的完整展开。
先记住一个反直觉的点:文本模式才需要 MemStats,而且必须先读统计、再申请缓冲。因为申请缓冲本身也是一次分配,若顺序反了,这次分配就会混进你要打印的统计数字里------源码 607~608 行那两行注释说的就是这件事。
1.2 源码逐行:三件套与两段式抓取(577~635 行)
先看「三件套」的入口。三个函数短得几乎不像正经逻辑,但它们把「老 API、问条数、默认视图」三件事钉死了:
go
// Interface to system profiles.              // ← 577:分节注释

// WriteHeapProfile is shorthand for [Lookup]("heap").WriteTo(w, 0).
// It is preserved for backwards compatibility.
func WriteHeapProfile(w io.Writer) error {    // ← 581:老 API(直接调 writeHeap 少一层查表)
	return writeHeap(w, 0)                // ← 582
}                                             // ← 583
                                              // ← 585
// countHeap returns the number of records in the heap profile.
func countHeap() int {                        // ← 586
	n, _ := runtime.MemProfile(nil, true)  // ← 587:nil 探数(两段式的第一段)
	return n                               // ← 588
}                                             // ← 589
                                              // ← 591
// writeHeap writes the current runtime heap profile to w.
func writeHeap(w io.Writer, debug int) error {  // ← 592
	return writeHeapInternal(w, debug, "")       // ← 593:defaultSampleType="" → pprof 默认 inuse_space
}                                                // ← 594
                                                 // ← 596
// writeAlloc writes the current runtime heap profile to w
// with the total allocation space as the default sample type.
func writeAlloc(w io.Writer, debug int) error {  // ← 598
	return writeHeapInternal(w, debug, "alloc_space")  // ← 599:唯一差异------默认视图换 alloc
}                                                   // ← 600
三个值得停一下的地方:
- 581 行的
WriteHeapProfile是向后兼容留下的老 API,它绕开查表直接调writeHeap,比Lookup("heap").WriteTo(w, 0)少一层。 - 587 行
runtime.MemProfile(nil, true)传 nil 切片,就是白话里说的「先问一句」------这里只是countHeap给Count()用的一次条数查询。 - 592 行的
writeHeap与 598 行的writeAlloc是同一个writeHeapInternal,差别只有第三个参数:空串走 pprof 默认的inuse_space,"alloc_space"换默认视图。名字两份、数据同一份,区别只在「默认把哪一列摆前面」。
紧接着是本节主体 writeHeapInternal。上半段是两段式抓取与两条出口的分岔:
go
func writeHeapInternal(w io.Writer, debug int, defaultSampleType string) error {
	var memStats *runtime.MemStats             // ← 603
	if debug != 0 {                            // ← 604:文本模式才需要 MemStats
		// Read mem stats first, so that our other allocations
		// do not appear in the statistics.
		memStats = new(runtime.MemStats)   // ← 607:★先读统计再分配缓冲------
		runtime.ReadMemStats(memStats)     // ← 608:   后面的 make() 才不会污染数字
	}                                          // ← 609
	                                                   // ← 610
	// Find out how many records there are ...(611~617:两段式注释------两次调用间条数可能变多,
	//     多分配一点,实在不行重来;常见情况循环只跑一轮)
	var p []profilerecord.MemProfileRecord
	n, ok := pprof_memProfileInternal(nil, true)      // ← 619:第一段:探数
	for {
		// Allocate room for a slightly bigger profile, ...
		p = make([]profilerecord.MemProfileRecord, n+50)  // ← 624:多留 50 条余量
		n, ok = pprof_memProfileInternal(p, true)         // ← 625:第二段:实取
		if ok {
			p = p[0:n]                                // ← 627:成功,裁剪
			break                                     // ← 628
		}                                                // ← 629
		// Profile grew; try again.                       // ← 630:不够(期间新桶出现)------用新 n 重来
	}                                                    // ← 631
                                                           // ← 632
	if debug == 0 {                                       // ← 633:proto 路径
		return writeHeapProto(w, p, int64(runtime.MemProfileRate), defaultSampleType)  // ← 634(protomem.go,见 §6)
	}                                                       // ← 635
                                                            // ← 636
	slices.SortFunc(p, func(a, b profilerecord.MemProfileRecord) int {  // ← 637:文本模式按 inuse 字节降序
		return cmp.Compare(a.InUseBytes(), b.InUseBytes())              // ← 638
	})                                                      // ← 639
                                                            // ← 640
把 619~631 行这个循环单独拎出来,它就是 §0.3 那套动作的代码化:
| 行 | 动作 | 对应白话 |
|---|---|---|
| 619 | pprof_memProfileInternal(nil, true) |
① 传 nil 只问条数 |
| 624 | make(..., n+50) |
② 按 n 多留 50 条余量 |
| 625 | pprof_memProfileInternal(p, true) |
③ 带切片实取 |
| 627~628 | p = p[0:n]; break |
ok=true 裁剪后收工 |
| 630 | 落回循环顶部 | ok=false 时 n 已被更新,拿新 n 回到 ② |
注意 637 行的排序只在 debug > 0 的文本路径上做------debug == 0 在 633 行就 return writeHeapProto(...) 提前走了,proto 侧的样本顺序由 writeHeapProto 自己决定。这个「提前 return」把两条出口干净地切开,后面一大段文本拼装代码,proto 路径一行都不会执行。
1.3 源码逐行:文本出口与历史兼容(641~727 行)
下半段全在 debug > 0 这条路上:两层缓冲、一个合计行、两个「善意谎言」、每站点一行,最后是一整屏 MemStats。源码逐行保留如下:
go
	b := bufio.NewWriter(w)                                  // ← 641:文本输出三件套:bufio→tabwriter
	tw := tabwriter.NewWriter(b, 1, 8, 1, '\t', 0)           // ← 642
	w = tw                                                    // ← 643
                                                            // ← 644
	var total runtime.MemProfileRecord                        // ← 645:合计行
	for i := range p {                                       // ← 646
		r := &p[i]                                       // ← 647
		total.AllocBytes += r.AllocBytes                 // ← 648
		total.AllocObjects += r.AllocObjects             // ← 649
		total.FreeBytes += r.FreeBytes                   // ← 650
		total.FreeObjects += r.FreeObjects               // ← 651
	}                                                        // ← 652
                                                            // ← 653
	// Technically the rate is MemProfileRate not 2*MemProfileRate,
	// but early versions of the C++ heap profiler reported 2*MemProfileRate,
	// so that's what pprof has come to expect.              // ← 654~656:历史兼容!头行的 rate 报 2×
	rate := 2 * runtime.MemProfileRate                       // ← 657
                                                            // ← 658
	// pprof reads a profile with alloc == inuse as being a "2-column" profile ...(659~664:
	//     alloc==inuse 会被 pprof 误判为两列 profile,无法与四列 profile 合并;骗它一下:+1)
	inUseBytes := total.InUseBytes()                         // ← 665
	allocBytes := total.AllocBytes                           // ← 666
	if inUseBytes == allocBytes {                            // ← 667
		allocBytes++                                         // ← 668
	}                                                        // ← 669
                                                            // ← 670
	fmt.Fprintf(w, "heap profile: %d: %d [%d: %d] @ heap/%d\n",  // ← 671:legacy 文本头:
		total.InUseObjects(), inUseBytes,                   // ← 672:   inuse_objs: inuse_bytes
		total.AllocObjects, allocBytes,                     // ← 673:   [alloc_objs: alloc_bytes]
		rate)                                                // ← 674
                                                            // ← 675
	for i := range p {                                       // ← 676:每站点一行
		r := &p[i]                                       // ← 677
		fmt.Fprintf(w, "%d: %d [%d: %d] @",               // ← 678
			r.InUseObjects(), r.InUseBytes(),             // ← 679
			r.AllocObjects, r.AllocBytes)                 // ← 680
		for _, pc := range r.Stack {                      // ← 681:十六进制 PC 列表
			fmt.Fprintf(w, " %#x", pc)                // ← 682
		}                                                // ← 683
		fmt.Fprintf(w, "\n")                             // ← 684
		printStackRecord(w, r.Stack, false)              // ← 685:符号化栈
	}                                                        // ← 686
                                                            // ← 687
	// Print memstats information too.
	// Pprof will ignore, but useful for people               // ← 688~689
	s := memStats                                            // ← 690
	fmt.Fprintf(w, "\n# runtime.MemStats\n")                 // ← 691
	fmt.Fprintf(w, "# Alloc = %d\n", s.Alloc)                // ← 692
	fmt.Fprintf(w, "# TotalAlloc = %d\n", s.TotalAlloc)      // ← 693
	fmt.Fprintf(w, "# Sys = %d\n", s.Sys)                    // ← 694
	fmt.Fprintf(w, "# Lookups = %d\n", s.Lookups)            // ← 695
	fmt.Fprintf(w, "# Mallocs = %d\n", s.Mallocs)            // ← 696
	fmt.Fprintf(w, "# Frees = %d\n", s.Frees)                // ← 697
	                                                          // ← 698
	fmt.Fprintf(w, "# HeapAlloc = %d\n", s.HeapAlloc)        // ← 699
	fmt.Fprintf(w, "# HeapSys = %d\n", s.HeapSys)            // ← 700
	fmt.Fprintf(w, "# HeapIdle = %d\n", s.HeapIdle)          // ← 701
	fmt.Fprintf(w, "# HeapInuse = %d\n", s.HeapInuse)        // ← 702
	fmt.Fprintf(w, "# HeapReleased = %d\n", s.HeapReleased)  // ← 703
	fmt.Fprintf(w, "# HeapObjects = %d\n", s.HeapObjects)    // ← 704
	                                                          // ← 705
	fmt.Fprintf(w, "# Stack = %d / %d\n", s.StackInuse, s.StackSys)          // ← 706
	fmt.Fprintf(w, "# MSpan = %d / %d\n", s.MSpanInuse, s.MSpanSys)          // ← 707
	fmt.Fprintf(w, "# MCache = %d / %d\n", s.MCacheInuse, s.MCacheSys)       // ← 708
	fmt.Fprintf(w, "# BuckHashSys = %d\n", s.BuckHashSys)                    // ← 709
	fmt.Fprintf(w, "# GCSys = %d\n", s.GCSys)                                // ← 710
	fmt.Fprintf(w, "# OtherSys = %d\n", s.OtherSys)                          // ← 711
	                                                                          // ← 712
	fmt.Fprintf(w, "# NextGC = %d\n", s.NextGC)              // ← 713
	fmt.Fprintf(w, "# LastGC = %d\n", s.LastGC)              // ← 714
	fmt.Fprintf(w, "# PauseNs = %d\n", s.PauseNs)            // ← 715
	fmt.Fprintf(w, "# PauseEnd = %d\n", s.PauseEnd)          // ← 716
	fmt.Fprintf(w, "# NumGC = %d\n", s.NumGC)                // ← 717
	fmt.Fprintf(w, "# NumForcedGC = %d\n", s.NumForcedGC)    // ← 718
	fmt.Fprintf(w, "# GCCPUFraction = %v\n", s.GCCPUFraction)  // ← 719
	fmt.Fprintf(w, "# DebugGC = %v\n", s.DebugGC)            // ← 720
	                                                          // ← 721
	// Also flush out MaxRSS on supported platforms.
	addMaxRSS(w)                                             // ← 723:平台文件(pprof_rusage.go 等)------MaxRSS 行
	                                                          // ← 724
	tw.Flush()                                               // ← 725
	return b.Flush()                                         // ← 726:两层缓冲依次落盘
}                                                           // ← 727
这一段里,641~643 行先把 w 包成 bufio.Writer、再包成 tabwriter.Writer,所以 725~726 行必须先 tw.Flush() 再 b.Flush() ------内层排版器先把对齐后的字节吐给外层缓冲,外层才最后落盘,顺序反了就会丢尾部。671~674 行那行 heap profile: ... @ heap/N 是给老版 pprof 读的 legacy 文本头;691~720 行那一整屏 # runtime.MemStats 注释行,pprof 会直接忽略,纯粹是打给人看的(688~689 行注释自己都写了 "useful for people")。723 行的 addMaxRSS 来自平台相关文件,补一行最大常驻内存。
1.4 两段式 + 重试:三处同源
两段式 + 重试 是这个文件反复出现的模式(615~631、782~802、929~937 三处),根源都在 runtime 侧
*Internal的契约:「p 装不下就一个字都不写,只告诉你 n」。
三处的差别只在余量和记录类型:heap 用 MemProfileRecord、余量 50;goroutine 用 StackRecord、余量 10;block / mutex 用 BlockProfileRecord、余量 50。套的是同一个壳。常见情况循环只跑一轮,重试是给「两次调用之间又长出新桶」留的兜底------这也是为什么余量大小不是什么精妙常数,改小只是多跑几轮,删掉才会真的出问题。
难点 A|两段式 + 重试:为什么非要「问两次」
在纠结什么 :writeHeapInternal 里一个 for 循环,先 nil 探数、make(n+50) 实取、ok=false 就重来;writeRuntimeProfile、writeProfileInternal 又是同一套。看着像不信任自己刚申请的内存。
通俗地说 :根源在 runtime 侧 *Internal 的契约------「给的切片装不下,就一个字都不写,只告诉你真实条数 n」。而「第一次问 n」到「第二次真去取」之间,程序还在跑,heap 可能又多出几个分配桶、又多了几条记录。所以只能:
- 第一次传
nil,只为问「现在有多少条」; - 按
n再加一点余量(heap / block / mutex 是 50,goroutine 是 10,794 行注释对 10 的解释带了个问号,是源码作者的推测语气)申请切片; - 第二次真取,回执
ok说「够不够」; - 不够(
ok=false)就用这次返回的新 n 回到第 2 步重来。
关键在于「装不下不写脏数据」这条保证:正因为第二阶段失败时没往切片里写半截内容,重来才是安全的;否则就得自己拼接前后两半,代码完全是另一个样子。
最小例子(示意,不能直接编译):
go
n, _ := pprof_memProfileInternal(nil, true)            // ① nil 探数
p := make([]profilerecord.MemProfileRecord, n+50)      // ② 多留 50 条
n, ok := pprof_memProfileInternal(p, true)             // ③ 实取
// ok=false 时 n 已更新,拿新 n 回到 ② 重来一句话记住:问一次只是问,取一次可能被嫌小;契约保证「装不下不写脏数据」,所以可以放心重来。
对应源码行:§1.2 的 611~631 行两段式注释与循环、§1.4 点明的三处出处(615~631、782~802、929~937)。
难点 B|两个「善意的谎言」:2×rate 与 allocBytes++
在纠结什么 :文本头把采样率报成 rate := 2 * runtime.MemProfileRate(657 行),proto 里却是 b.pb.int64Opt(tagProfile_Period, rate) 传准确值(§6 的 19 行,注释特意写「不是 2×!」);还有 if inUseBytes == allocBytes { allocBytes++ }(667~668 行)这种莫名加一。
通俗地说 :两处都是为了迁就老工具,不是算错 。文本头是给老版 pprof 读的「礼貌值」,proto 是给新工具算补偿用的「准确值」,读者不同、口径自然不同;+1 则是防误判的暗号。
| 谎言 | 源码解释 | 目的 |
|---|---|---|
文本头 2*rate |
654~656 行注释:早期 C++ heap profiler 报的是 2*MemProfileRate,pprof 后来就认这个数 |
让老版 pprof 读文本头时得到它期望的值 |
proto Period=rate |
§6 的 19 行注释「period=MemProfileRate(不是 2×! proto 里是准确值)」 | proto 要拿去算泊松补偿,必须给真值 |
allocBytes++ |
659~664 行注释:alloc == inuse 会被 pprof 误判成「两列 profile」,无法与四列合并 | 故意制造一点点差异,骗它按四列读 |
最小例子 :假设某次快照 inUseBytes == allocBytes(比如刚分配完还没释放),文本头里 allocBytes 被 +1,于是四列里的两个字节数不再相等,pprof 不会误判成两列。proto 路径在 633 行就提前 return 了,根本不走这段文本逻辑------writeHeapProto 用四个 pbValueType 明确声明四列,本来就不会混。
一句话记住 :文本头是给老工具看的「礼貌值」,proto 是给新工具算的「准确值」;+1 是防误判的暗号,两处都不是 bug。
对应源码行 :§1.3 的 654~656、657、659~668、671~674 行;§6.2 的 19 行 Period=MemProfileRate(不是 2×!)。
2 threadcreate / goroutine(729~814 行)
2.1 先建画面:两个窗口,一条短路
这一节管两个窗口,数据流比 heap 简单,但多了一条「短路」。
threadcreate 最省事:runtime 侧不产 labels、也没有像样的调用栈,写侧干脆包一层 writeRuntimeProfile,把 labels 那一维忽略掉,只把 StackRecord 塞进通用打印漏斗。goroutine 则分两条路:
debug >= 2:一进来就短路到writeGoroutineStacks,直接runtime.Stack(buf, true)把每个 goroutine 的完整文本栈原样倒出来,不去重、不编号、不进 proto;- 否则:走
writeRuntimeProfile的两段式抓取,顺带把labels一起拉出来,交给通用打印漏斗。
换句话说,同样是「抓 goroutine」,debug=2 是「把仓库里每个箱子贴的原文全抄一遍」,debug=1 / debug=0 是「按编号点货、按指纹归类」。前者图省事,代价写在源码里;后者多一道框架,但对大进程友好得多。
2.2 源码逐行:count 与 write 的转发(729~756 行)
go
// countThreadCreate returns the size of the current ThreadCreateProfile.
func countThreadCreate() int {            // ← 730
	n, _ := runtime.ThreadCreateProfile(nil)  // ← 731:同款 nil 探数
	return n                               // ← 732
}                                         // ← 733
                                          // ← 735
// writeThreadCreate writes the current runtime ThreadCreateProfile to w.
func writeThreadCreate(w io.Writer, debug int) error {
	// Until https://golang.org/issues/6104 is addressed, wrap
	// ThreadCreateProfile because there's no point in tracking labels when we
	// don't get any stack-traces.                          // ← 737~739:runtime 侧不产 labels------包一层忽略之
	return writeRuntimeProfile(w, debug, "threadcreate", func(p []profilerecord.StackRecord, _ []unsafe.Pointer) (n int, ok bool) {
		return pprof_threadCreateInternal(p)          // ← 741
	})                                                    // ← 742
}                                                        // ← 743
                                                          // ← 745
// countGoroutine returns the number of goroutines.
func countGoroutine() int {                              // ← 746
	return runtime.NumGoroutine()                    // ← 747
}                                                         // ← 748
                                                          // ← 750
// writeGoroutine writes the current runtime GoroutineProfile to w.
func writeGoroutine(w io.Writer, debug int) error {      // ← 751
	if debug >= 2 {
		return writeGoroutineStacks(w)           // ← 753:★debug≥2 短路------panic 同款全文本
	}                                            // ← 754
	return writeRuntimeProfile(w, debug, "goroutine", pprof_goroutineProfileWithLabels)  // ← 755
}                                                // ← 756
三处对照着看:
- 730~733 行
countThreadCreate用runtime.ThreadCreateProfile(nil)问条数,是 §1 那套 nil 探数的又一个实例;746~748 行countGoroutine更直接,runtime.NumGoroutine()一个数就是答案,连探数都省了。 - 737~739 行注释给了
writeThreadCreate为什么包一层:在 issue 6104 解决之前,threadcreate 既拿不到栈、也没必要跟踪 labels,所以用匿名函数把labels参数_掉,只调pprof_threadCreateInternal(p)。 - 751~756 行
writeGoroutine是本节最关键的分岔:debug >= 2直接return writeGoroutineStacks(w),否则把pprof_goroutineProfileWithLabels当fetch传给writeRuntimeProfile。注意这个函数名里带着WithLabels------它是 §2.4 里runtimeProfile.Label(i)能拿到标签的源头。
2.3 源码逐行:debug≥2 的全文本栈(758~777 行)
短路之后走的是这段「1 MiB 起步、翻倍、64 MiB 封顶」的循环:
go
func writeGoroutineStacks(w io.Writer) error {   // ← 758
	// We don't know how big the buffer needs to be ...(759~761:1MB 起步翻倍,64MB 封顶)
	buf := make([]byte, 1<<20)                // ← 762:1 MiB
	for i := 0; ; i++ {                       // ← 763
		n := runtime.Stack(buf, true)     // ← 764:runtime.Stack------全程 STW 的那个!
		if n < len(buf) {                 // ← 765:没写满 → 全量拿到了
			buf = buf[:n]             // ← 766
			break                     // ← 767
		}                                  // ← 768
		if len(buf) >= 64<<20 {            // ← 769:64 MiB 还不够
			// Filled 64 MB - stop there.  // ← 770:放弃,接受截断
			break                         // ← 771
		}                                  // ← 772
		buf = make([]byte, 2*len(buf))     // ← 773:翻倍重试
	}                                          // ← 774
	_, err := w.Write(buf)                    // ← 775:原样写出
	return err                                 // ← 776
}                                              // ← 777
runtime.Stack(buf, true) 的第二个参数 true 表示「所有 goroutine」。它返回实际写入的字节数 n:n < len(buf) 说明缓冲够用、全量拿到了;否则把缓冲翻倍再来。到 64 MiB 还装不下就接受截断(769~771 行),不再无限申请。拿到之后 775 行 w.Write(buf) 原样写出------没有任何格式化,就是纯文本。
这解释了一个运维现象:
curl /debug/pprof/goroutine?debug=2在几十万 goroutine 的进程上会明显卡一下------runtime.Stack(buf, true)全程 STW;而debug=1/debug=0走的是 1.24 的并发快照 ,代价小得多。大进程抓全量栈,优先debug=1。
2.4 源码逐行:writeRuntimeProfile 与 runtimeProfile(779~814 行)
debug=1 / debug=0 走的是这套通用漏斗。它和 §1 的 writeHeapInternal 是同一个两段式壳,只是多带了一维 labels:
go
func writeRuntimeProfile(w io.Writer, debug int, name string, fetch func([]profilerecord.StackRecord, []unsafe.Pointer) (int, bool)) error {
	// Find out how many records there are (fetch(nil)). ...(779~785:两段式注释,同 heap)
	var p []profilerecord.StackRecord             // ← 786
	var labels []unsafe.Pointer                   // ← 787
	n, ok := fetch(nil, nil)                      // ← 788:第一段
	                                               // ← 789
	for {                                          // ← 790
		// Allocate room for a slightly bigger profile, ...
		p = make([]profilerecord.StackRecord, n+10)   // ← 794:余量 10(比 heap 的 50 小------goroutine 变化更快?)
		labels = make([]unsafe.Pointer, n+10)          // ← 795:labels 同长度
		n, ok = fetch(p, labels)                       // ← 796:第二段
		if ok {
			p = p[0:n]                             // ← 798
			break                                     // ← 799
		}                                              // ← 800
		// Profile grew; try again.                     // ← 801
	}                                                  // ← 802
	                                                   // ← 803
	return printCountProfile(w, debug, name, &runtimeProfile{p, labels})  // ← 804:进通用打印漏斗
}                                                        // ← 805
                                                         // ← 806
type runtimeProfile struct {                  // ← 807:countProfile 的第二个实现(带 labels)
	stk    []profilerecord.StackRecord      // ← 808
	labels []unsafe.Pointer                  // ← 809
}                                             // ← 810
                                              // ← 811
func (p *runtimeProfile) Len() int              { return len(p.stk) }               // ← 812
func (p *runtimeProfile) Stack(i int) []uintptr { return p.stk[i].Stack }          // ← 813
func (p *runtimeProfile) Label(i int) *labelMap { return (*labelMap)(p.labels[i]) }  // ← 814:g.labels 直接当 labelMap 用
794~795 行两个切片长度完全一样:p 装栈,labels 装对应的标签指针,下标一一对应。fetch 是函数参数------writeGoroutine 传进来的是 pprof_goroutineProfileWithLabels(带标签),writeThreadCreate 传进来的是那个把 _ []unsafe.Pointer 忽略掉的匿名函数(不带标签)。同一个壳,靠传入的 fetch 决定要不要标签。
807~814 行的 runtimeProfile 是通用打印漏斗 countProfile 接口的第二个实现:只要会 Len / Stack / Label 三招就能被打印。814 行 (*labelMap)(p.labels[i]) 把裸指针转回标签集------抓栈时贴在 goroutine 头上的那个指针,就是在这里被送回样本里的。这也是写侧唯一一处把「标签」重新接回数据流的地方。
难点 C|debug=2 的 STW 短路:大进程抓栈为什么会卡
在纠结什么 :writeGoroutine 一进来就 if debug >= 2 { return writeGoroutineStacks(w) }(753 行),短路掉后面整个两段式 + 通用漏斗;而 writeGoroutineStacks 里是一个「1 MiB 起步、翻倍、64 MiB 封顶」的循环。
通俗地说 :debug=2 要的是「panic 同款全文本栈」------每个 goroutine 的完整堆栈原样倒出来,不需要去重、不需要编号、不需要 proto。所以它直接调 runtime.Stack(buf, true)(764 行),把结果 w.Write(buf) 原样写出(775 行)。缓冲不够就翻倍重试,到 64 MiB 还装不下就接受截断(769~771 行)。
代价写在 §2.3 那段运维提示里:runtime.Stack(buf, true) 全程 STW(停世界) ,几十万 goroutine 的进程上 curl /debug/pprof/goroutine?debug=2 会明显卡一下;而 debug=1 / debug=0 走的是 1.24 的并发快照 writeRuntimeProfile → 通用打印漏斗,代价小得多。所以实操建议是:大进程抓全量栈,优先 debug=1。
最小例子:
| 参数 | 走的 runtime 函数 | 代价 |
|---|---|---|
debug=2 |
runtime.Stack(buf, true)(STW,1 MiB → 64 MiB 翻倍) |
大进程明显卡顿 |
debug=1 / debug=0 |
pprof_goroutineProfileWithLabels → 并发快照 + 通用打印漏斗 |
小得多 |
一句话记住 :debug=2 图省事直接倒全栈,代价是 STW;大进程用 debug=1。
对应源码行:§2.2 的 751~756 行短路、§2.3 的 758~777 行翻倍循环与运维提示、§2.4 的 779~804 行并发快照路径。
3 CPU 流式三件套(816~902 行)

图 9-2 CPU 流式三件套时序:100Hz 信号写 profBuf,profileWriter 每 100ms 拉取,eof 后 build 封包,StopCPUProfile 等 cpu.done 才返回。
看图时抓三处:左端每 10ms 掉一个零件进筐、中间那个工人每 100ms 才来搬一箱、右端贴「收工」封条之前必须等最后一箱搬完;对应 §3.3、§3.4 与难点 D / E。
3.1 先建画面:录像,不是快照
前面几节都是快照------问一次、捞一批、写一份文件、收工。CPU 完全不是这个模型,它更像一条传送带:左端每 10ms 掉一个零件进筐,中间的工人每 100ms 才来搬一箱,右端要等「收工」的哨声响过、最后一箱搬完,才准贴封条。
三个角色对应三个函数:
StartCPUProfile:把传送带开起来------打开 100Hz 信号、起一个后台泵,然后立刻返回;profileWriter:那个「每 100ms 醒来一次」的泵 goroutine,阻塞式地从账本借账、增量喂给构建器;StopCPUProfile:关掉信号,然后必须等泵把尾部搬完、封好包才返回。
最容易出错的直觉是「StartCPUProfile 返回了,文件就开始写了」------其实它只做了两件事(开信号、起 goroutine),真正写字的是那个新起的 goroutine;同理,「SetCPUProfileRate(0) 关了信号,数据就齐了」也是错的,账本里还压着一批没搬完的。这两个误会,正好对应本节末尾的难点 D 和难点 E。
还有一个全局状态要先认识:cpu 是一个匿名结构,一把嵌入的 sync.Mutex、一个 profiling 开关、一个 done 通道。整组 Start / Stop 操作都在这把锁里,重复开启靠 profiling 报错,收工靠 done 通知。
3.2 源码逐行:cpu 会话结构(816~820 行)
go
var cpu struct {          // ← 816:CPU 剖析的全局会话状态
	sync.Mutex        // ← 817(嵌入------整组操作互斥)
	profiling bool    // ← 818:开关状态
	done      chan bool  // ← 819:profileWriter 完成信号
}                        // ← 820
三个成员各管一件事,列成表更好记:
| 成员 | 类型 | 通俗解释 |
|---|---|---|
sync.Mutex(嵌入) |
锁 | Start / Stop 整组操作互斥,中间状态不会被并发改坏 |
profiling |
bool |
「现在开着吗」的开关,重复 Start 靠它报错 |
done |
chan bool |
泵写完封包后发的完成信号,Stop 靠它等收工 |
done 是懒建的(848 行),第一次 StartCPUProfile 才 make(chan bool);之后反复 Start / Stop 复用同一个通道。这个「懒建 + 复用」的细节,是理解 901 行 <-cpu.done 为什么不会死锁的前提------通道在 Start 里就准备好了。
3.3 源码逐行:Start / readProfile / profileWriter / Stop(822~902 行)
这是本文最核心的一段源码,三件套加一个只有声明没有函数体的 readProfile,全在这里。readProfile 只有一行函数签名,实现在 runtime 侧、由 §5 的 linkname 绑定------「声明即约定」说的就是它:写侧只管按这个签名调用,底层怎么从环形账本里分块借数据,是 runtime 的事。
go
// StartCPUProfile enables CPU profiling for the current process. ...(822~832:文档;
//     ★c-archive/c-shared 下 SIGPROF 会被宿主程序抢走------需 os/signal.Notify 自救)
func StartCPUProfile(w io.Writer) error {
	// The runtime routines allow a variable profiling rate,
	// but in practice operating systems cannot trigger signals
	// at more than about 500 Hz, and our processing of the
	// signal is not cheap (mostly getting the stack trace).
	// 100 Hz is a reasonable choice: ... Instead of requiring
	// each client to specify the frequency, we hard code it.
	const hz = 100                      // ← 843:硬编码 100Hz(样本数≈秒数×100,top 里 100 样本=1 秒)
	                                     // ← 844
	cpu.Lock()                          // ← 845
	defer cpu.Unlock()                  // ← 846
	if cpu.done == nil {
		cpu.done = make(chan bool)  // ← 848:懒建完成通道
	}                                     // ← 849
	// Double-check.
	if cpu.profiling {
		return fmt.Errorf("cpu profiling already in use")  // ← 852:重复开启报错(HTTP 端点 500 的来源)
	}                                     // ← 853
	cpu.profiling = true                  // ← 854
	runtime.SetCPUProfileRate(hz)         // ← 855:开信号(runtime 侧 setcpuprofilerate)
	go profileWriter(w)                   // ← 856:★泵 goroutine------100ms 轮询拉数据
	return nil                            // ← 857
}                                         // ← 858
                                          // ← 860~864:readProfile 文档------runtime 提供的阻塞式分块读取
func readProfile() (data []uint64, tags []unsafe.Pointer, eof bool)  // ← 865:声明即约定(实现在 runtime,由 linkname 绑定)

func profileWriter(w io.Writer) {        // ← 867:泵主体
	b := newProfileBuilder(w)         // ← 868:proto 构建器
	var err error                      // ← 869
	for {                              // ← 870
		time.Sleep(100 * time.Millisecond)  // ← 871:100ms 一拉------平衡延迟与系统调用次数
		data, tags, eof := readProfile()    // ← 872:阻塞读下一块(profBuf.read 协议)
		if e := b.addCPUData(data, tags); e != nil && err == nil {  // ← 873:增量喂给构建器
			err = e                          // ← 874:记住首个错误
		}                                       // ← 875
		if eof {
			break                          // ← 877:剖析已关且数据拉干
		}                                   // ← 878
	}                                       // ← 879
	if err != nil {
		// The runtime should never produce an invalid or truncated profile.
		// It drops records that can't fit into its log buffers.
		panic("runtime/pprof: converting profile: " + err.Error())  // ← 883:runtime 保证不产坏数据------坏了就 panic
	}                                       // ← 884
	b.build()                              // ← 885:收尾封包(补 mapping/function/string 表 + gzip)
	cpu.done <- true                       // ← 886:通知 StopCPUProfile
}                                           // ← 887
                                            // ← 889~891:文档------只在全部数据写完后返回
func StopCPUProfile() {                     // ← 892
	cpu.Lock()                          // ← 893
	defer cpu.Unlock()                  // ← 894
	                                     // ← 895
	if !cpu.profiling {
		return                          // ← 897:没开着------no-op(idempotent)
	}                                     // ← 898
	cpu.profiling = false                // ← 899
	runtime.SetCPUProfileRate(0)         // ← 900:关信号(停计时器→排空 extra)
	<-cpu.done                           // ← 901:★等泵写完------"Stop 不丢尾部数据"的保证
}                                         // ← 902
把 StartCPUProfile 拆成按顺序执行的三道检查,重复开启的报错就很好理解:
| 顺序 | 动作 | 源码 |
|---|---|---|
| 1 | if cpu.done == nil { cpu.done = make(chan bool) } 懒建通道 |
848 行 |
| 2 | if cpu.profiling { return fmt.Errorf("cpu profiling already in use") } 重复开启报错 |
852 行 |
| 3 | cpu.profiling = true |
854 行 |
三道检查都在 cpu.Lock() / defer cpu.Unlock() 之间,所以「两个 goroutine 同时 Start」只会有一个成功。852 行那句 cpu profiling already in use 正是 HTTP 端点重复点开时返回 500 的来源。紧接着 855 行 SetCPUProfileRate(hz) 开信号、856 行 go profileWriter(w) 起泵,到 857 行 StartCPUProfile 就返回了------后面写文件的活全在那个新 goroutine 里。
泵的一个循环是四件事(870~879 行):睡 100ms → 阻塞拉一块 → 增量喂给构建器、只记首个错误 → 见 eof 就 break。跳出循环后,若 err != nil 就 panic(883 行,注释说 runtime 保证不产坏数据、装不下的记录会自己丢掉,所以真出错只能是转换逻辑坏了);否则 b.build() 收尾封包(885 行),最后 cpu.done <- true(886 行)通知 Stop。
StopCPUProfile 四步(892~902 行):没开着就 return(897 行,幂等 no-op)、profiling = false(899 行)、SetCPUProfileRate(0) 关信号(900 行)、<-cpu.done 阻塞等到泵写完才返回(901 行)。889~891 行的文档把最后一步的语义写得很直白:「只在全部数据写完后返回」。
3.4 一次完整时序
时序图(把写侧与 runtime 侧对起来看):
text
StartCPUProfile(w)                      StopCPUProfile()
 │ SetCPUProfileRate(100)                │ SetCPUProfileRate(0)
 │ go profileWriter(w)                   │ <-cpu.done  (阻塞到 build 完成)
 ▼                                       ▼
 SIGPROF 每 10ms ──► cpuProfile.add ──► profBuf 环形缓冲
 profileWriter:  每 100ms readProfile() ──► addCPUData ──► (eof 时) b.build() ──► done<-true
四个角色在图里各占一段:① 闹钟是 SIGPROF 每 10ms 一响,② 被拍肩的工人是 cpuProfile.add 抓栈,③ 环形账本是 profBuf,④ 抄账员就是 profileWriter。把这张图和 §0.2 的四角色图叠在一起看,「10ms 生产 / 100ms 搬运 / eof 封箱 / Stop 等收工」这四拍就串成一条线了。
一句话串起主链 :开信号(生产)→ 起泵(搬运)→ 每 100ms 拉一块增量喂 → 关信号 → 等
cpu.done确认最后一箱搬完 → 返回。删掉那个等,尾部数据就可能丢(难点 E)。
难点 D|为什么是 100Hz 和 100ms 两个数字
在纠结什么 :StartCPUProfile 里 const hz = 100 硬编码(843 行),profileWriter 里 time.Sleep(100 * time.Millisecond) 又是一个 100;两个数字长得很像,管的事却完全不同。
通俗地说:一个是「生产多快」,一个是「搬运多勤」。
| 数字 | 谁定的 | 管什么 |
|---|---|---|
hz = 100(100Hz,每 10ms 一次) |
信号频率 | ① 闹钟多快拍一次肩;样本数约等于秒数乘 100,top 里 100 样本就是 1 秒 |
100 * time.Millisecond |
泵的轮询周期 | ④ 抄账员多久来搬一次账;871 行注释说是在「平衡延迟与系统调用次数」 |
822~832 行的文档给了硬编码 100Hz 的理由:操作系统触发信号超不过约 500Hz,而处理信号主要是抓栈、并不便宜,所以不让用户各自指定频率,直接定死 100Hz。泵那边若「readProfile 一返回就立刻再读」,会退化成忙轮询、把系统调用次数拉满;睡 100ms 是让账本攒一小批再搬,反正 readProfile 本身是阻塞式的(865 行文档),没数据时会等着,不会空转丢数据。
还有个容易看漏的:b.build() 为什么必须等 eof 之后才调? 因为 profileBuilder 是增量攒样本的(addCPUData 一块一块喂),build() 是收尾------补 mapping / function / string 表并 gzip 封包。提前调等于把没写完的账提前封箱,文件会缺尾巴。所以循环里 if eof { break }(877 行)在前,b.build()(885 行)在后,顺序不能动。
最小例子(时序,含框线字符):
text
   10ms  10ms  10ms  ...(信号持续生产,写进 profBuf)
     │     │     │
     └─────┴─────┴──► ③ 账本攒了一小批
                          │
   每 100ms ─────────────► ④ readProfile() 一次搬走 ──► addCPUData
                          │
   eof 到 ───────────────► break ──► b.build() ──► done<-true
一句话记住 :100Hz 管「生产多快」,100ms 管「搬运多勤」,eof 才准封箱;三者不宜混为一个 100。
对应源码行 :§3.3 的 843 行 const hz = 100 及上面那段注释、871 行 time.Sleep、872~878 行循环、885 行 b.build()、889~891 行「只在全部数据写完后返回」的文档。
难点 E|<-cpu.done:Stop 为什么不丢尾部数据
在纠结什么 :StopCPUProfile 最后一行是光秃秃的 <-cpu.done(901 行),前面刚 SetCPUProfileRate(0) 把信号关了,看上去已经没事可等。
通俗地说 :关信号只是「不再生产新账」,可 ③ 账本里还压着一批没搬完的、泵手里还有一块正在 addCPUData。profileWriter 要一直拉到 eof(「剖析已关且数据拉干」)才 break、才 b.build()、才发 cpu.done <- true。StopCPUProfile 必须阻塞在这个通道上,等这三步全做完才返回------889~891 行文档写得很直白:「只在全部数据写完后返回」。
最小例子:典型调用方长这样(示意,不能直接编译):
go
f, _ := os.Create("cpu.pprof")
pprof.StartCPUProfile(f)
defer f.Close() // 若 Stop 不写完就返回,defer 可能先关掉文件
// ... 业务代码 ...
pprof.StopCPUProfile() // 靠 <-cpu.done 保证尾部已落盘
删掉 <-cpu.done,StopCPUProfile 会在泵还在写的时候立刻返回,接着 defer f.Close() 把文件关了------尾部样本要么写不进去、要么写坏一个 gzip 包。cpu.done 是「泵与调用方之间唯一的一张收工回执」:StartCPUProfile 在 848 行懒建它,profileWriter 在 886 行发,StopCPUProfile 在 901 行收,一发一收,缺了收的那头,整条流水线就没有「完成」这个概念了。
顺带说清一个对称的细节:StopCPUProfile 全程握着 cpu 这把锁(893~894 行),而 StartCPUProfile 也要抢同一把锁。所以「Stop 还没等完就想再 Start」会被挡在门外,直到泵收工、锁释放------这恰好避免了两次会话的 done 通道互相串台。
一句话记住 :关信号 ≠ 写完文件;Stop 必须等 cpu.done,否则 defer f.Close() 会抢在泵前面。
对应源码行 :§3.3 的 886 行 cpu.done <- true、901 行 <-cpu.done、848 行懒建通道、889~891 行文档。
4 block / mutex(904~975 行)
4.1 先建画面:两个计数器,两列样本
block 和 mutex 是一对孪生窗口:都记「某处等了多久、等了几次」,都用 BlockProfileRecord(字段是 Cycles / Count / Stack),都走同一个 writeProfileInternal。差别只在取数函数和名字字符串。
数据流可以拆成四拍:
- 问条数 :
runtime.BlockProfile(nil)或runtime.MutexProfile(nil),又是熟悉的 nil 探数; - 两段式实取 :
writeProfileInternal里n+50余量、ok=false重来,和 §1 的 heap 一模一样; - 排序 :按
Cycles降序(940 行cmp.Compare(b.Cycles, a.Cycles),注意参数顺序是 b 在前,才是降序); - 分出口 :
debug <= 0走printCountCycleProfile出 proto 的两列样本;debug > 0走文本,打印cycles/second、sampling period和带符号化栈的每行记录。
这里藏着本节最容易被读错的一点:runtime 记时间用的是 CPU tick(cycles),pprof 的 delay 列要的却是纳秒 。中间隔着一次 cycles ÷ GHz 的换算,就在 printCountCycleProfile 的 448 行。另外三处名字各不一样------writeBlock 传进去的 name 是 "contention",proto 两列固定叫 contentions / delay,窗口本身叫 block------别互相找,具体在难点 F 里列清楚。
4.2 源码逐行:count / write 与 writeProfileInternal(904~975 行)
先看四个短函数,它们只负责「问条数」和「转包」:
go
// countBlock returns the number of records in the blocking profile.
func countBlock() int {                     // ← 905
	n, _ := runtime.BlockProfile(nil)   // ← 906:两段式第一段
	return n                            // ← 907
}                                          // ← 908
                                           // ← 910
// countMutex returns the number of records in the mutex profile.
func countMutex() int {                     // ← 911
	n, _ := runtime.MutexProfile(nil)   // ← 912
	return n                            // ← 913
}                                          // ← 914
                                           // ← 916
// writeBlock writes the current blocking profile to w.
func writeBlock(w io.Writer, debug int) error {   // ← 917
	return writeProfileInternal(w, debug, "contention", pprof_blockProfileInternal)  // ← 918:名字是 contention!
}                                                  // ← 919
                                                   // ← 921
// writeMutex writes the current mutex profile to w.
func writeMutex(w io.Writer, debug int) error {    // ← 922
	return writeProfileInternal(w, debug, "mutex", pprof_mutexProfileInternal)  // ← 923
}                                                  // ← 924
918 行那个 "contention" 是第一个名字陷阱:writeBlock 传给 writeProfileInternal 的 name 不是 "block",而是 "contention";它只用在 951 行文本输出的段头 --- contention:。proto 路径根本不看这个 name,列名由 944 行写死。
接着是共用的 writeProfileInternal:
go
// writeProfileInternal writes the current blocking or mutex profile ...(926)
func writeProfileInternal(w io.Writer, debug int, name string, runtimeProfile func([]profilerecord.BlockProfileRecord) (int, bool)) error {
	var p []profilerecord.BlockProfileRecord       // ← 928
	n, ok := runtimeProfile(nil)                   // ← 929:两段式第一段
	for {                                          // ← 930
		p = make([]profilerecord.BlockProfileRecord, n+50)  // ← 931
		n, ok = runtimeProfile(p)              // ← 932
		if ok {
			p = p[:n]                          // ← 934
			break                                 // ← 935
		}                                          // ← 936
	}                                              // ← 937(空注释行)
	                                                   // ← 938
	slices.SortFunc(p, func(a, b profilerecord.BlockProfileRecord) int {  // ← 939:cycles 降序
		return cmp.Compare(b.Cycles, a.Cycles)                          // ← 940
	})                                                      // ← 941
	                                                           // ← 942
	if debug <= 0 {                                           // ← 943:proto 路径
		return printCountCycleProfile(w, "contentions", "delay", p)  // ← 944:两列样本(contentions/delay)
	}                                                           // ← 945
	                                                            // ← 946
	b := bufio.NewWriter(w)                                    // ← 947:文本路径
	tw := tabwriter.NewWriter(w, 1, 8, 1, '\t', 0)             // ← 948(注:948 行未接 b,小瑕疵无碍)
	w = tw                                                      // ← 949
	                                                            // ← 950
	fmt.Fprintf(w, "--- %v:\n", name)                          // ← 951:段头
	fmt.Fprintf(w, "cycles/second=%v\n", pprof_cyclesPerSecond())  // ← 952:tick 频率(文本侧手工换算)
	if name == "mutex" {
		fmt.Fprintf(w, "sampling period=%d\n", runtime.SetMutexProfileFraction(-1))  // ← 954:负参=只读当前采样率
	}                                                           // ← 955
	expandedStack := pprof_makeProfStack()                      // ← 956:展开缓冲(runtime 分配,免得这笔 make 被自己采样)
	for i := range p {                                          // ← 957
		r := &p[i]                                          // ← 958
		fmt.Fprintf(w, "%v %v @", r.Cycles, r.Count)        // ← 959:cycles count @ PCs...
		n := expandInlinedFrames(expandedStack, r.Stack)    // ← 960:内联展开
		stack := expandedStack[:n]                          // ← 961
		for _, pc := range stack {                          // ← 962
			fmt.Fprintf(w, " %#x", pc)                  // ← 963
		}                                                   // ← 964
		fmt.Fprint(w, "\n")                                 // ← 965
		if debug > 0 {
			printStackRecord(w, stack, true)            // ← 967:文本模式恒带符号化栈
		}                                                   // ← 968
	}                                                           // ← 969
	                                                            // ← 970
	if tw != nil {
		tw.Flush()                                          // ← 972
	}                                                           // ← 973
	return b.Flush()                                            // ← 974
}                                                               // ← 975
929~937 行是「两段式 + 重试」的第三处实例(对照 §1.4):runtimeProfile(nil) 探数 → make(n+50) → runtimeProfile(p) 实取 → 不 ok 就重来。939~941 行按 Cycles 降序,让最耗时的争用排在最前。
文本路径还有三个小细节值得记:952 行把 pprof_cyclesPerSecond() 原样打进 cycles/second= 一行,方便人自己换算;954 行 runtime.SetMutexProfileFraction(-1) 用负参 只读当前 mutex 采样率、不改设置;956 行 pprof_makeProfStack() 从 runtime 侧要一块展开缓冲,注释点明动机是「免得这笔 make 被自己采样」------和 §1 里「先读 MemStats 再分配」是同一种洁癖。
4.3 源码逐行:printCountCycleProfile(429~457 行)
printCountCycleProfile 在 pprof.go 的 429~457 行,源码位置比本节靠前,但逻辑上正是 block / mutex 的 proto 出口,放在这里补上逐行注释:
go
// printCountCycleProfile outputs block profile records ...(429~432:注释------
//     proto 要 count+纳秒,runtime 给的是 count+cycles,必须换算)
func printCountCycleProfile(w io.Writer, countName, cycleName string, records []profilerecord.BlockProfileRecord) error {
	// Output profile in protobuf form.
	b := newProfileBuilder(w)                            // ← 435
	b.pbValueType(tagProfile_PeriodType, countName, "count")  // ← 436:period_type = contentions/count
	b.pb.int64Opt(tagProfile_Period, 1)                  // ← 437:period=1(计数型,同 printCountProfile)
	b.pbValueType(tagProfile_SampleType, countName, "count")  // ← 438:样本列①contentions
	b.pbValueType(tagProfile_SampleType, cycleName, "nanoseconds")  // ← 439:样本列②delay(ns)
	                                                           // ← 440
	cpuGHz := float64(pprof_cyclesPerSecond()) / 1e9     // ← 441:tick 频率 → GHz
	                                                           // ← 442
	values := []int64{0, 0}                              // ← 443:两值样本
	var locs []uint64                                    // ← 444
	expandedStack := pprof_makeProfStack()               // ← 445
	for _, r := range records {                          // ← 446
		values[0] = r.Count                          // ← 447:列①原样
		values[1] = int64(float64(r.Cycles) / cpuGHz)  // ← 448:列② cycles ÷ GHz = 纳秒!
		// For count profiles, all stack addresses are
		// return PCs, which is what appendLocsForStack expects.
		n := expandInlinedFrames(expandedStack, r.Stack)  // ← 451:展开(FP 物理帧 → 逻辑帧)
		locs = b.appendLocsForStack(locs[:0], expandedStack[:n])  // ← 452
		b.pbSample(values, locs, nil)                     // ← 453:无 labels
	}                                                        // ← 454
	b.build()                                                // ← 455
	return nil                                               // ← 456
}                                                            // ← 457
pprof_cyclesPerSecond()的 darwin 实现是非阻塞读(procpidinfo),其他平台查询 OS------这里是 §5 那条pprof_cyclesPerSecondlinkname 声明的消费端。
443 行 values := []int64{0, 0} 定死了「两值样本」。把三处样本列数并排看,就不容易记混:
| 函数 | values |
列的含义 |
|---|---|---|
| 通用打印漏斗(§2.4 进的那个) | []int64{0} |
一列:count |
printCountCycleProfile(443 行) |
[]int64{0, 0} |
两列:contentions(次数)、delay(纳秒) |
writeHeapProto(§6.2 的 28 行) |
[]int64{0, 0, 0, 0} |
四列:alloc_objects / alloc_space / inuse_objects / inuse_space |
样本列数由这个切片长度决定 ,pprof 的 -sample_index 选择器认的则是 pbValueType(tagProfile_SampleType, ...) 写进去的那几个名字。436~439 行先用 countName / cycleName 声明列名,944 行传进来的实参是 "contentions" / "delay"。
难点 F|block / mutex 的两列样本:cycles 怎么变成纳秒
在纠结什么 :printCountCycleProfile 注释(429~432 行)说「proto 要 count + 纳秒,runtime 给的是 count + cycles,必须换算」;448 行一行除法就完事。
通俗地说 :runtime 记阻塞 / 持锁时间用的是 CPU tick(cycles) ,可 pprof 的 delay 列要的是纳秒。中间差一个「一秒多少 tick」:
| 步 | 代码 | 含义 |
|---|---|---|
| 1 | cpuGHz := float64(pprof_cyclesPerSecond()) / 1e9(441 行) |
把「每秒 tick 数」换成 GHz |
| 2 | values[0] = r.Count(447 行) |
列①原样:次数 |
| 3 | values[1] = int64(float64(r.Cycles) / cpuGHz)(448 行) |
列②:cycles ÷ GHz = 纳秒 |
| 4 | pbValueType(tagProfile_SampleType, ...)(438~439 行) |
声明两列名叫 contentions / delay |
为什么除以 GHz 就得到纳秒?pprof_cyclesPerSecond() / 1e9 是「每纳秒多少 tick」,所以 cycles ÷ (tick/纳秒) = 纳秒。这一步若漏掉,delay 列的单位会差十亿倍量级。
配套的两个细节别互相找:writeBlock 传进去的 name 是 "contention"(918 行,不是 block),而 proto 的两列名固定由 944 行写成 printCountCycleProfile(w, "contentions", "delay", p)------窗口名、文本段头名、proto 列名,三处各不一样 ;另外 pprof_cyclesPerSecond() 的 darwin 实现是非阻塞读(procpidinfo),其他平台查询 OS。
最小例子 :values := []int64{0, 0}(443 行)是两值样本,跟通用打印漏斗的一列、§6 heap 的四列对照着记------列数看 values 切片长度,别看函数签名里塞了几个字符串。
一句话记住 :runtime 给 cycles、pprof 要纳秒,中间除以 cyclesPerSecond()/1e9;列数看 values 切片长度。
对应源码行 :§4.3 的 435~457 行 printCountCycleProfile 全文(尤其 441、447、448 行)、§4.2 的 944 行 printCountCycleProfile(w, "contentions", "delay", p)、918 行 "contention"。
5 七个 linkname 后门(977~998 行)
5.1 先建画面:为什么要走后门
前面四节反复出现一类函数:pprof_memProfileInternal、pprof_goroutineProfileWithLabels、pprof_blockProfileInternal、pprof_cyclesPerSecond......它们的共同点是------只有声明,没有函数体 。写侧敢这么用,全靠文件末尾这一排 //go:linkname:它把 pprof_xxx 这个名字直接绑到 runtime 里的同名(或指定名)函数上,编译器一见声明就去那个符号取实现,不走普通的包导出路径。
把它想成「柜台后门」:internal/profilerecord 里那些「切片装记录」的内部类型,从正门(导出 API)递不进去;走后门就能把写侧准备好的切片直接塞给 runtime,让 runtime 往里写,既不用换成公开类型、也不用多拷一份。这一节就是这排后门的清单和「为什么不走正门」的交代。
5.2 源码逐行:声明清单(977~998 行)
go
//go:linkname pprof_goroutineProfileWithLabels runtime.pprof_goroutineProfileWithLabels   // ← 977
func pprof_goroutineProfileWithLabels(p []profilerecord.StackRecord, labels []unsafe.Pointer) (n int, ok bool)  // ← 978

//go:linkname pprof_cyclesPerSecond runtime/pprof.runtime_cyclesPerSecond   // ← 980
func pprof_cyclesPerSecond() int64                                          // ← 981

//go:linkname pprof_memProfileInternal runtime.pprof_memProfileInternal     // ← 983
func pprof_memProfileInternal(p []profilerecord.MemProfileRecord, inuseZero bool) (n int, ok bool)  // ← 984

//go:linkname pprof_blockProfileInternal runtime.pprof_blockProfileInternal // ← 986
func pprof_blockProfileInternal(p []profilerecord.BlockProfileRecord) (n int, ok bool)  // ← 987

//go:linkname pprof_mutexProfileInternal runtime.pprof_mutexProfileInternal // ← 989
func pprof_mutexProfileInternal(p []profilerecord.BlockProfileRecord) (n int, ok bool)  // ← 990

//go:linkname pprof_threadCreateInternal runtime.pprof_threadCreateInternal // ← 992
func pprof_threadCreateInternal(p []profilerecord.StackRecord) (n int, ok bool)  // ← 993

//go:linkname pprof_fpunwindExpand runtime.pprof_fpunwindExpand             // ← 995
func pprof_fpunwindExpand(dst, src []uintptr) int                           // ← 996

//go:linkname pprof_makeProfStack runtime.pprof_makeProfStack               // ← 998(声明在下一行,文件末)
把清单按「本文哪里用到」归一下位,后门就不是一堆陌生名字了:
| 声明 | 绑定的 runtime 符号 | 本文消费端 |
|---|---|---|
pprof_goroutineProfileWithLabels |
runtime.pprof_goroutineProfileWithLabels |
§2.2 的 755 行、writeRuntimeProfile 的 fetch |
pprof_cyclesPerSecond |
runtime/pprof.runtime_cyclesPerSecond |
§4.2 的 952 行、§4.3 的 441 行 |
pprof_memProfileInternal |
runtime.pprof_memProfileInternal |
§1.2 的 619、625 行两段式 |
pprof_blockProfileInternal |
runtime.pprof_blockProfileInternal |
§4.2 的 918 行 |
pprof_mutexProfileInternal |
runtime.pprof_mutexProfileInternal |
§4.2 的 923 行 |
pprof_threadCreateInternal |
runtime.pprof_threadCreateInternal |
§2.2 的 741 行 |
pprof_fpunwindExpand |
runtime.pprof_fpunwindExpand |
CPU profile 的 FP 栈展开 |
pprof_makeProfStack |
runtime.pprof_makeProfStack |
§4.2 的 956 行、§4.3 的 445 行 |
前六条分别对应 §1、§2、§4 里已经用到的取数函数;后两条(fpunwindExpand / makeProfStack)服务于 CPU profile 的 FP 栈展开。注意 998 行那条只写了 //go:linkname,函数声明在紧接的下一行、已到文件末------所以清单里它是「半条」,但绑定关系照样成立。
如实提示 :本节标题沿用「七个后门」这个叫法,而 977~998 行的代码块里实际出现了 8 行
//go:linkname声明。这不是漏写也不是凑数:标题是约定俗成的概数,清单以代码块为准。本文照实列全 8 个名字,不替它圆场,也不改动源码。
5.3 三条理由与一个代价
为什么不走 runtime 的导出 API? 源码把理由归纳成三条,换成通俗说法是:
| 理由 | 通俗解释 |
|---|---|
internal/profilerecord 的切片版记录不能穿过导出 ABI |
导出 API 只认公开类型,内部那种「切片装记录」的形态递不过去 |
| 跳过 32 帧截断 | 导出 API 会砍到 32 层,后门能拿全栈 |
| 免掉一次数据复制 | 直接往写侧给的切片里写,不用先拷一份再转 |
代价也直说:runtime 与 runtime/pprof 必须同版本编译------反正它们本来就是同一份 Go 源码树的一部分。这条约束换来的是「内部类型直递 + 全栈 + 零拷贝」,对一个每 10ms 就要抓一次栈的剖析路径来说,很值。
再回头看 §1.2、§2.4、§4.2 那三个两段式循环:它们之所以敢 make 一个 []profilerecord.MemProfileRecord 直接递进去,正是因为后门把「切片形态」原样送到了 runtime 侧;若改走导出 API,光类型适配就得重写一遍,两段式契约也就不复存在了。后门不是炫技,是整条写侧数据流的地基。
难点 G|linkname 后门:为什么不肯走正门
在纠结什么 :一堆 //go:linkname 声明,把 pprof_* 直接绑到 runtime 里的同名函数;明明有 runtime.MemProfile 这类导出 API,为什么不用。
通俗地说 :三条理由(§5.3)换成一句话------正门递不进内部类型、会砍栈、还要多拷一次。展开说:
| 限制 | 后门怎么绕开 |
|---|---|
internal/profilerecord 的切片记录穿不过导出 ABI |
用 linkname 直接绑到接受该内部类型的 runtime 函数 |
| 导出 API 会砍到 32 帧 | 后门拿到的栈不截断 |
| 还要多一次数据复制 | runtime 直接写进写侧给的切片,零拷贝 |
代价是 runtime 与 runtime/pprof 必须同版本编译,跨版本混用会直接对不上符号。另外提醒一句:本节标题叫「七个」,代码块里是 8 行声明,这是源码自身的口径差异,按 §5.2 的清单记全即可。
最小例子(977~998 行的形态,示意,不能直接编译):
go
//go:linkname pprof_memProfileInternal runtime.pprof_memProfileInternal
func pprof_memProfileInternal(p []profilerecord.MemProfileRecord, inuseZero bool) (n int, ok bool)
一行 //go:linkname 加一行「没有函数体的声明」,就是全部语法。写侧调用它时和调普通函数没区别,编译器会去把符号接上。
一句话记住:后门是为了递内部类型、拿全栈、少拷一次;代价是 runtime 与 pprof 必须同版本编译。
对应源码行 :§5.2 的 977~998 行全部 //go:linkname、§5.3 的三条理由与代价;§1.2 的 619、625 行、§4.2 的 952 行是它的消费端。
6 protomem.go:heap 的 proto 输出与泊松补偿
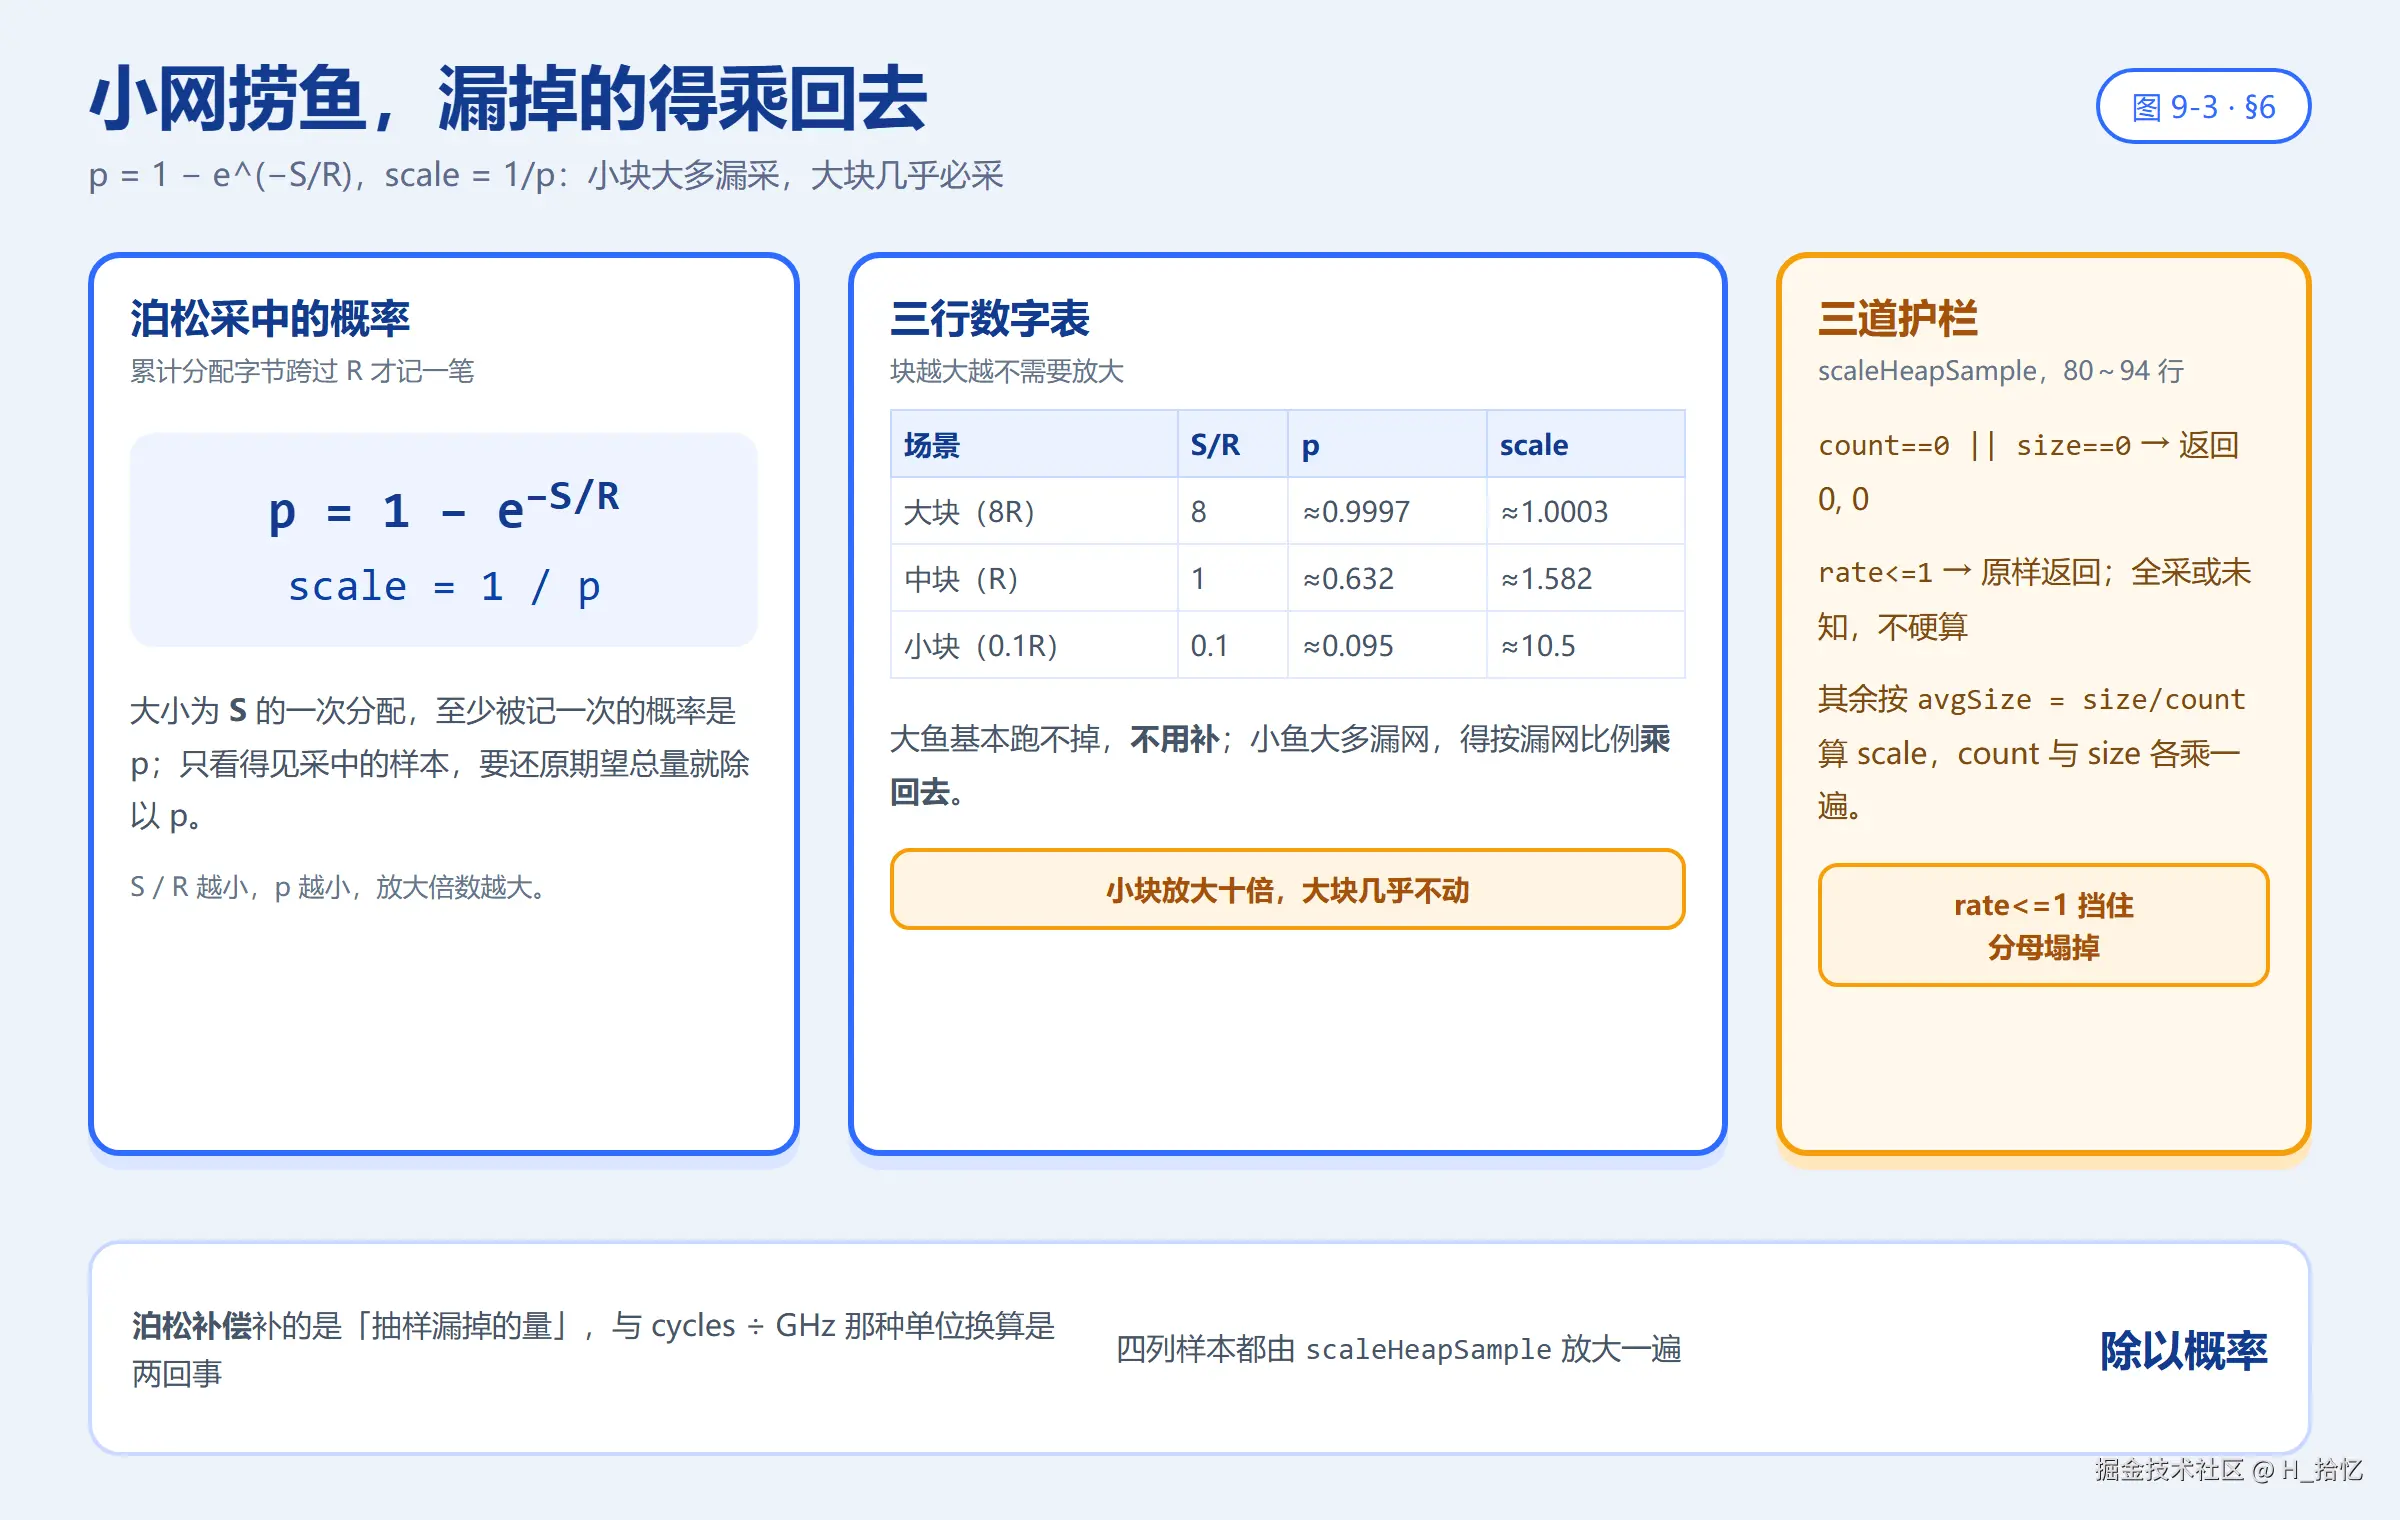
图 9-3 泊松采样补偿:p = 1−e^(−S/R),小块大多漏采故放大倍数高,大块几乎必采故 scale 接近 1。
看图时抓三处:用小网捞鱼时大鱼基本跑不掉、小鱼大多漏网、要按漏网比例把数乘回去;对应 §6.3、§6.4 与难点 H。
6.1 先建画面:四列样本与一笔要还的债
protomem.go 全文只有 94 行、两个函数,却是整个 heap 剖析「数字准不准」的最后一关:
writeHeapProto:把 §1 两段式捞到的[]MemProfileRecord编成 protobuf。它一次声明四列样本 ------alloc_objects/alloc_space/inuse_objects/inuse_space,这正是go tool pprof -sample_index能在「分配过多少」和「还占着多少」之间切来切去的依据。scaleHeapSample:按采样概率把观测值放大回期望总量。
为什么需要第二个函数?因为 heap 是抽样统计 ,不是全量记账。mprof.go 那侧的 malloc 采样是「累计分配字节跨过 R 才记一笔」:一块很大的分配几乎必然被记到,一块很小的分配大概率被漏掉。如果直接把「被记到的那些」写进报告,就会系统性低估小块分配------这份报告欠了小块一笔债。scaleHeapSample 就是来还债的:先算出「这么大的块被采中的概率 p」,再把观测值除以 p,scale = 1/p。
于是这一节的数据流是:一段内存记录进来 → 先决定栈怎么截(藏不藏 runtime 帧,最多试两轮)→ 四列值各过一遍 scaleHeapSample → 顺手用平均块大小挂一个数值型 bytes 标签 → b.build() 封包。两处「历史兼容」(难点 B 拆解的 2*rate 与 allocBytes++)在 proto 路径里都不出现,这里给的是准确值。
6.2 源码逐行:writeHeapProto(17~68 行)
go
// (protomem.go)
// writeHeapProto writes the current heap profile in protobuf format to w.
func writeHeapProto(w io.Writer, p []profilerecord.MemProfileRecord, rate int64, defaultSampleType string) error {
	b := newProfileBuilder(w)                                    // ← 17
	b.pbValueType(tagProfile_PeriodType, "space", "bytes")       // ← 18:period_type = space/bytes
	b.pb.int64Opt(tagProfile_Period, rate)                       // ← 19:★period=MemProfileRate(不是 2×!proto 里是准确值)
	b.pbValueType(tagProfile_SampleType, "alloc_objects", "count")  // ← 20:四列样本类型------
	b.pbValueType(tagProfile_SampleType, "alloc_space", "bytes")    // ← 21:alloc_*
	b.pbValueType(tagProfile_SampleType, "inuse_objects", "count")  // ← 22:inuse_*
	b.pbValueType(tagProfile_SampleType, "inuse_space", "bytes")    // ← 23:pprof 的 -sample_index 选择器就认这些名
	if defaultSampleType != "" {                                 // ← 24:allocs profile 的差异点
		b.pb.int64Opt(tagProfile_DefaultSampleType, b.stringIndex(defaultSampleType))  // ← 25:默认视图=alloc_space
	}
                                                                  // ← 26~27
	values := []int64{0, 0, 0, 0}                                 // ← 28:四值样本
	var locs []uint64                                             // ← 29
	for _, r := range p {                                         // ← 30
		hideRuntime := true                                   // ← 31:第一轮先藏 runtime 帧
		for tries := 0; tries < 2; tries++ {                  // ← 32:两轮尝试
			stk := r.Stack                                // ← 33
			// For heap profiles, all stack addresses are return PCs ...(34~36)
			if hideRuntime {                              // ← 37:跳过栈底(runtime.mallocgc 等无信息量)
				for i, addr := range stk {            // ← 38
					if f := runtime.FuncForPC(addr); f != nil && (strings.HasPrefix(f.Name(), "runtime.") || strings.HasPrefix(f.Name(), "internal/runtime/")) {
						continue                  // ← 40:runtime 帧跳过
					}                                    // ← 41
					// Found non-runtime. Show any runtime uses above it.
					stk = stk[i:]                       // ← 43:从首个用户帧开始
					break                               // ← 44
				}                                        // ← 45
			}                                                // ← 46
			locs = b.appendLocsForStack(locs[:0], stk)       // ← 47
			if len(locs) > 0 {                               // ← 48:截完还有帧 → 成功
				break                                       // ← 49
			}                                                    // ← 50
			hideRuntime = false // try again, and show all frames next time.  // ← 51:全被截没了 → 第二轮不藏
		}                                                        // ← 52
	                                                                   // ← 53
		values[0], values[1] = scaleHeapSample(r.AllocObjects, r.AllocBytes, rate)        // ← 54:alloc 两列(补偿!)
		values[2], values[3] = scaleHeapSample(r.InUseObjects(), r.InUseBytes(), rate)    // ← 55:inuse 两列(补偿!)
		var blockSize int64                                       // ← 56
		if r.AllocObjects > 0 {                                   // ← 57
			blockSize = r.AllocBytes / r.AllocObjects             // ← 58:平均块大小 → 附带 label "bytes"
		}                                                         // ← 59
		b.pbSample(values, locs, func() {                         // ← 60
			if blockSize != 0 {                               // ← 61
				b.pbLabel(tagSample_Label, "bytes", "", blockSize)  // ← 62:数值型 label(pprof -tag bytes 可聚合)
			}                                                     // ← 63
		})                                                        // ← 64
	}                                                             // ← 65
	b.build()                                                     // ← 66
	return nil                                                    // ← 67
}                                                                 // ← 68
三处值得停一下:
- 19 行
b.pb.int64Opt(tagProfile_Period, rate)传的是准确 的MemProfileRate,注释特意标「不是 2×!」。这正是 难点 B 那两个「善意谎言」的分工:文本头给老工具的礼貌值是2*rate,proto 要拿去算补偿,必须给真值。writeHeapInternal在 634 行调用本函数时传的第三个实参就是int64(runtime.MemProfileRate)。 - 20~23 行 四个
pbValueType声明四列名,-sample_index认的就是这几个字符串;24~25 行defaultSampleType != ""是 allocs 与 heap 唯一的差异点------把默认视图设成alloc_space。名字两份、数据同一份,到这里才算真正落地。 - 31~52 行 「hideRuntime 两轮」:第一轮先跳过栈底的
runtime./internal/runtime/帧(37~45 行),从首个用户帧开始截;若截完len(locs) == 0(说明整条栈都是 runtime 帧),第二轮hideRuntime = false,把全部帧都交出去(51 行)。这样既让火焰图默认聚焦业务代码,又不至于把纯 runtime 栈弄成空样本。
54~55 行四列值每一列都过一遍 scaleHeapSample:alloc 两列一组、inuse 两列一组。58 行 blockSize = r.AllocBytes / r.AllocObjects 算出平均块大小,62 行挂成数值型 bytes 标签,go tool pprof -tag bytes 可以按它聚合------注意这个标签用的是未补偿的原始平均块大小,和放大后的四列值不是一回事。
6.3 源码逐行:scaleHeapSample(70~94 行)
go
// scaleHeapSample adjusts the data from a heap Sample to
// account for its probability of appearing in the collected
// data. ...(70~78:注释------malloc 采样是泊松过程;大小 S 的样本被采概率 = 1-exp(-S/R))
func scaleHeapSample(count, size, rate int64) (int64, int64) {
	if count == 0 || size == 0 {         // ← 80:空样本不放大
		return 0, 0                  // ← 81
	}                                        // ← 82
	                                           // ← 83
	if rate <= 1 {                            // ← 84
		// if rate==1 all samples were collected so no adjustment is needed.
		// if rate<1 treat as unknown and skip scaling.
		return count, size                // ← 87:全采(=1)或未知(<1,如用户乱改)------原样返回
	}                                        // ← 88
	                                           // ← 89
	avgSize := float64(size) / float64(count)  // ← 90:平均每块大小 S
	scale := 1 / (1 - math.Exp(-avgSize/float64(rate)))  // ← 91:1 / (1-e^(-S/R)) = 1/p ------ 泊松补偿系数
	                                           // ← 92
	return int64(float64(count) * scale), int64(float64(size) * scale)  // ← 93:期望无偏放大
}                                               // ← 94
整个函数只有三道护栏加一行公式,逐行拆:
| 行 | 判断 / 计算 | 为什么 |
|---|---|---|
| 80~81 | `count == 0 | |
| 84~87 | rate <= 1 → 原样返回 |
rate==1 是全采、无需补偿;rate<1 视作「用户乱改的未知值」,宁可不补也不乱补 |
| 90 | avgSize := size / count |
拿到平均每块大小 S |
| 91 | scale := 1 / (1 - exp(-S/rate)) |
采中概率 p = 1−e^(−S/R) 的倒数,即补偿系数 |
| 93 | count 与 size 各乘 scale 返回 |
把观测值还原成期望总量 |
注意 93 行返回的是两个值 :count 和 size 都乘同一个 scale。所以四列样本里,alloc_objects 与 alloc_space 共享一个 scale,inuse_objects 与 inuse_space 共享另一个 scale(因为两组的 count / size 不同,算出的平均块大小不同)。
6.4 公式推导与三行数字表
公式推导 :mallocgc 的采样是「累计分配字节跨过 R 才记一笔」------这是泊松过程的离散化。大小 S 的一次分配至少被记一次的概率 p = 1−e^(−S/R)。我们只看得见被采中的样本,要还原期望总量,就除以 p:scale = 1/p。
直觉全在 S/R 这个比值上:
| 场景 | S/R | p | scale | 直觉 |
|---|---|---|---|---|
| 大块(8R) | 8 | 1−e⁻⁸≈0.9997 |
≈1.0003 |
大块几乎必采,无需放大 |
| 中块(R) | 1 | 1−e⁻¹≈0.632 |
≈1.582 |
六成被采,乘 1.58 |
| 小块(0.1R) | 0.1 | 1−e⁻⁰·¹≈0.095 |
≈10.5 |
小块大多漏采,单个放大十倍 |
三行数字把「为什么小块的倍数高」说得很直白:块越大,S/R 越大,p 越接近 1,scale 越接近 1;块越小,p 越小,scale 越大。极端情况下 S/R → 0 时 p → 0、scale → ∞,所以才有 84 行 rate <= 1 那道护栏挡住「分母塌掉」的情形。
再补一句边界:scaleHeapSample 除的是「泊松采中概率」,和 §4 里 cycles ÷ GHz 那种「单位换算」完全是两回事------一个是把抽样漏掉的量补回来,一个是把 tick 换成时间。两条都是除法,别记串。
难点 H|泊松补偿:小块为什么要放大十倍
在纠结什么 :scaleHeapSample 里一行 scale := 1 / (1 - math.Exp(-avgSize/float64(rate)))(91 行),凭什么能把「观测到的样本」还原成「真实的分配总量」。
通俗地说 :先接受 §6.4 的推导------mallocgc 的采样是「累计分配字节跨过 R 才记一笔」,这是泊松过程的离散化;于是大小为 S 的一次分配至少被记一次的概率 是 p = 1−e^(−S/R)。我们只看得见被采中的样本,要还原期望总量,就除以 p:scale = 1/p。把它想成「用小网捞鱼」:大鱼基本跑不掉、不用补,小鱼大多漏网、得按漏网比例把数乘回去。
函数里还有三道护栏(80~94 行):count == 0 || size == 0 直接返回 0, 0;rate <= 1 原样返回(rate==1 是全采、rate<1 视作未知,84~87 行注释);其余才 avgSize := float64(size) / float64(count) 算平均每块大小,再算 scale,最后 count 和 size 各乘一遍返回(93 行)。
writeHeapProto 用这个函数把四列都放大一遍:values[0], values[1] = scaleHeapSample(r.AllocObjects, r.AllocBytes, rate)(54 行)、values[2], values[3] = scaleHeapSample(r.InUseObjects(), r.InUseBytes(), rate)(55 行);还顺手用 blockSize = r.AllocBytes / r.AllocObjects(58 行)加一个数值型 bytes 标签(62 行,pprof -tag bytes 可聚合)。
最小例子 :拿一组具体数走一遍------scaleHeapSample(3, 3072, 512*1024)。平均块 S = 3072 / 3 = 1024,S/R = 1024 / 524288 ≈ 0.00195,p ≈ 0.00195,scale ≈ 512。于是返回约 (3×512, 3072×512),也就是「这类小块大多漏采,得放大约五百倍」;两个返回值分别代表还原后的对象数与字节数。这里只按公式手推,具体数值以源码公式为准。
一句话记住 :采样是泊松的,小块漏得多;除以 1−e^(−S/R) 把观测值放大回期望,大块几乎不用放大。
对应源码行 :§6.3 的 70~78 行注释、80~94 行 scaleHeapSample 全文(尤其 90、91、93 行)、§6.4 的公式推导与三行数字表、§6.2 的 54~55 行四列放大。
7 串起来:一次快照与一次录像完整走一遍
前面六节按源码行号从上往下拆了零件。这一节只做一件事:把 §0.3 的两条大路各跑一遍,让「快照」和「录像」在 b.build() 这里真正碰头。
7.1 大路一:一份 heap 快照怎么被打印
以 pprof.Lookup("heap").WriteTo(w, 0) 为例,从查表到落盘:
| 步 | 到了哪里 | 关键判断 / 动作 | 源码 |
|---|---|---|---|
| 1 | write(w, 0) |
内置窗口直接转包到写侧 | §1.2 的 592 行 |
| 2 | writeHeapInternal |
debug != 0 才读 MemStats;先读统计再分配缓冲 |
§1.2 的 603~608 行 |
| 3 | 两段式 | nil 探数 → make(n+50) → 实取 → ok=false 用新 n 重来 |
§1.2 的 619~631 行 |
| 4 | 分岔 | debug == 0 提前 return writeHeapProto(...);否则继续走文本 |
§1.2 的 633 行 |
| 5 | proto 出口 | 四列 pbValueType 声明 → 每列过 scaleHeapSample → bytes 标签 → b.build() |
§6.2 的 17~66 行 |
| 6 | 文本出口 | 排序 → 两层缓冲 → 2*rate 文本头 + allocBytes++ → MemStats → 依次 Flush |
§1.3 的 637~726 行 |
一句话:快照是「问两次捞全量,再按 debug 选纸」;proto 那张纸上的数字还要先按泊松概率放大一遍,才敢交出去。
7.2 大路二:一段 CPU 录像怎么落盘
以 pprof.StartCPUProfile(f) ... pprof.StopCPUProfile() 为例:
| 步 | 到了哪里 | 关键判断 / 动作 | 源码 |
|---|---|---|---|
| 1 | StartCPUProfile |
加锁、懒建 done、查 profiling、SetCPUProfileRate(100)、go profileWriter(w),随即返回 |
§3.3 的 845~857 行 |
| 2 | 生产 | SIGPROF 每 10ms 抓栈写进 profBuf |
§3.4 时序图 |
| 3 | 泵循环 | 睡 100ms → readProfile() 拉一块 → addCPUData 增量喂 → 见 eof 才 break |
§3.3 的 870~879 行 |
| 4 | 收尾 | 有错则 panic;否则 b.build() 封包 → cpu.done <- true |
§3.3 的 883~886 行 |
| 5 | StopCPUProfile |
profiling = false → SetCPUProfileRate(0) 关信号 → <-cpu.done 等到泵写完 |
§3.3 的 899~901 行 |
一句话:录像是「开信号生产、后台泵搬运、eof 才准封箱、Stop 等收工回执」;最容易被看漏的正是最后那一步------关信号并不等于写完文件。
7.3 三条线在这里汇合
| 汇合点 | 哪两件事在这里碰头 | 位置 |
|---|---|---|
| 两段式契约 | heap / goroutine / block / mutex 四个窗口共用「装不下只报 n」 | §1.2、§2.4、§4.2 三处循环 |
| 构建器 | 快照的 proto 出口与 CPU 流都交给 profileBuilder,都由 b.build() 收尾 |
§6.2 的 66 行、§3.3 的 885 行 |
| 数字准确性 | 文本头的礼貌值、proto 的准确值、泊松补偿,三者分工守同一份报告 | 难点 B、§6.2 的 19 行、§6.3 |
把两条链并排看,差别只在「数据怎么来」:
| CPU 流式 | heap 快照 | |
|---|---|---|
| 触发 | StartCPUProfile 起后台泵 |
WriteTo 一路调进来 |
| 取数 | 每 100ms readProfile() 拉一块,直到 eof |
一次 pprof_memProfileInternal(p, true) 拿全量 |
| 收尾 | b.build() 后发 cpu.done |
b.build() 在 writeHeapProto 内 |
| 防竞态手段 | 单写单读的环形账本 | 两段式 + 余量 + 重试 |
把这三行记住,整个写侧层的结构就立住了:捞全靠契约、收尾靠构建器、准确靠补偿 。快照和录像看着是两套动作,最后都落进同一个
profileBuilder,写出同一种能被go tool pprof读走的文件。
8 一页纸速查:8 条不变量
这里把散在各节的「必须成立」翻成「通俗解释 / 谁保证 / 坏了会怎样」。
| # | 通俗解释 | 谁保证 | 坏了会怎样 |
|---|---|---|---|
| 1 | 装不下就一个字不写、只报 n | runtime 侧 *Internal 契约 |
两段式没法重来,得自己拼半截数据 |
| 2 | 探数与实取之间条数会变,所以要多留余量并允许重试 | heap 50 / goroutine 10 / block 50 + ok=false 重来 |
少留一点就频繁重试,不留则直接失败 |
| 3 | 文本头 2×、proto 1×,是分工不是笔误 | §1.3 的 654~656 行注释 + §6.2 的 19 行准确值 | 老工具读错文本头、新工具补偿算错 |
| 4 | debug=2 走 STW 全栈,debug=1/0 走并发快照 |
§2.2 的 753 行短路 | 大进程抓 debug=2 明显卡顿 |
| 5 | 100Hz 是生产频率、100ms 是搬运周期,两码事 | §3.3 的 843 行 / 871 行 | 混成一个数会误判样本与时长的关系 |
| 6 | b.build() 只能在 eof 之后调;Stop 必须等 cpu.done 才返回 |
§3.3 的 885 行发、901 行收 | 增量样本没喂完就封箱,defer f.Close() 抢在泵前关文件 |
| 7 | cycles 要除以 GHz 才是纳秒 | §4.3 的 441、448 行 | delay 列单位全错,时间差十亿倍量级 |
| 8 | 观测值要除以采中概率才是期望总量;后门要求同版本编译 | §6.3 的 1/p;§5.3 的 linkname 代价 |
报告系统性低估小块分配;跨版本混用直接对不上符号 |
这八条是本文的验收标准。每一个看着绕的数字,最后都能归到其中一条上。读不下去时回来问一句「这句是在守哪条?」,通常就通了。
9 最容易读错的 8 件事
1|「两段式多留 50 条是拍脑袋留的余量,随便改小点没关系」 它是防「探数与实取之间又长出新桶」的兜底;§1.2 的 611~617 行注释明说两次调用间条数可能变多,ok=false 会用新 n 重来。余量小只是多跑几轮循环,不是出错,但别以为可以删(难点 A)。
2|「文本头 2*rate 是 proto Period=rate 写错了,该统一」 恰恰不能统一。§1.3 的 654~656 行注释说早期 C++ heap profiler 报 2×,pprof 就认这个数;§6.2 的 19 行特意注明 proto 里是准确值(难点 B)。
3|「allocBytes++ 是防止除零或者补偿误差」 不是。§1.3 的 659~664 行注释写得很清楚:alloc == inuse 会被 pprof 误判成「两列 profile」、没法与四列合并,+1 是故意制造差异骗它(难点 B)。
4|「debug=2 只是输出详细一点,跟其他 debug 走同一套框架」 它 753 行就短路到 writeGoroutineStacks,走 runtime.Stack(buf, true) 全程 STW,完全不进通用打印漏斗;大进程会明显卡一下(难点 C)。
5|「100Hz 和 100ms 是同一个 100 的两处写法」 不是。前者是信号频率(每 10ms 一次,843 行),后者是泵的轮询周期(871 行)。一个管生产、一个管搬运(难点 D)。
6|「StopCPUProfile 关了信号就可以返回了」 不行。SetCPUProfileRate(0) 只是停产,账本里还有没搬完的;<-cpu.done(901 行)要等泵 b.build() 完才放行,否则 defer f.Close() 会抢跑(难点 E)。
7|「block / mutex 的 proto 第二列直接就是纳秒」 不是。runtime 给的是 r.Cycles,§4.3 的 448 行除以 cpuGHz 才变成纳秒;而且 writeBlock 的 name 是 "contention"、proto 两列叫 contentions / delay,三处名字别互相找(难点 F)。
8|「scaleHeapSample 对所有块都乘同一个系数」 不是。系数是 1/(1−e^(−S/R)),随平均块大小 S 变:大块趋近 1、小块能到十倍以上(§6.4 三行表)。而且 rate<=1 时直接原样返回,不是「一律放大」(难点 H)。
10 五分钟复述卡
能把下面 8 句连着讲给别人听(哪怕讲得磕巴),这套机制就算立住了。
- 本文讲的是四角色里 ④ 抄账员真正动手抄账 的写侧层:
profileWriter就是那个「每 100ms 醒来一次」的后台 goroutine,protomem.go则负责把 heap 账算准。 - CPU 是录像 :
StartCPUProfile开 100Hz 信号并起泵,profileWriter每 100msreadProfile()拉一块增量喂给构建器,eof 后b.build()封包。 StopCPUProfile关信号后必须等<-cpu.done才返回,否则defer f.Close()会抢在泵前关文件、丢尾部数据。- 其余快照共用两段式 + 重试 :nil 探数 → 多留余量(heap 50 / goroutine 10 / block 50)→ 实取 →
ok=false拿新 n 重来;靠的是*Internal「装不下不写、只报 n」的契约。 - 文本头报
2*rate、proto 给准确rate、allocBytes++,三处都是迁就老 pprof 的历史兼容,不是算错。 debug=2短路到runtime.Stack(buf, true)全程 STW,大进程会卡;抓全量栈优先debug=1。- block / mutex 的 proto 两列是
contentions/delay,第二列要cycles ÷ GHz才成纳秒;heap 的 proto 是四列。 - heap 是泊松抽样,
scaleHeapSample按1/(1−e^(−S/R))把漏采的小块放大回期望;大块几乎不用放大,七个 linkname 后门则让内部切片直递 runtime。
讲不出第 2、3 句 → 回 §3.3、难点 D / E;第 4 句 → 难点 A;第 5 句 → 难点 B;第 8 句 → 难点 H、难点 G。
写到这儿,把开头那几个问题答一遍:pprof.StartCPUProfile(f) 之所以几乎立刻返回,是因为它只开了 100Hz 信号、起了一个每 100ms 醒一次的后台泵,真正把文件写满的是 profileWriter;StopCPUProfile 之所以宁可阻塞在光秃秃的 <-cpu.done 上,是因为关信号只是停产,账本里还压着没搬完的最后一箱。而 curl /debug/pprof/goroutine?debug=2 在大进程上卡顿,是因为它短路到 runtime.Stack(buf, true) 全程 STW,debug=1 的并发快照才是该用的那档。至于文本头那个 2*rate------它是给老工具的礼貌值,proto 里的 Period=rate 才是给补偿公式用的准确值,两者都不算错。
问两次才捞得全,等一拍才收得齐,除以概率才还得准------把这三句话记住,那些看似绕的循环、通道和指数,就都能解释成「好像也只能这么写」。