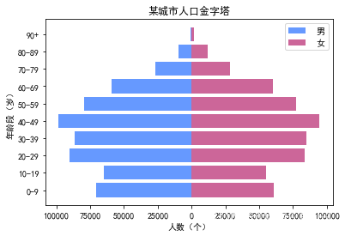
**题目一:**绘制人口金字塔图
编写程序。根据第8.6,绘制如下图的人口金字塔图。

运行代码:
python
#绘制人口金字塔图
import numpy as np
import pandas as pd
import matplotlib.pyplot as plt
plt.rcParams['font.sans-serif'] = 'SimHei'
plt.rcParams['axes.unicode_minus'] = False

df = pd.read_excel(r"D:\数据可视化\14\population.xlsx")
df_male = df.groupby(by='Gender').get_group("Male")
list_male = df_male['Number'].values.tolist()
df_female = df.groupby(by='Gender').get_group('Female')
list_female = df_female['Number'].values.tolist()
df_age = df.groupby('AgeGroup').sum()
count = df_age.shape[0]
y = np.arange(1, 11)
labels = []
for i in range(count):
    age = df_age.index[i]
    labels.append(age)
fig = plt.figure()
ax = fig.add_subplot(111)
ax.barh(y, list_male, tick_label=labels, label = '男', color='#6699FF')
ax.barh(y, list_female, tick_label=labels, label = '女', color='#CC6699')
ax.set_ylabel("年龄段(岁)")
ax.set_xticks([-100000, -75000, -50000, -25000, 0, 25000, 50000, 75000, 100000])
ax.set_xticklabels(['100000', '75000', '50000', '25000', '0', '25000', '50000', '75000', '100000'])
ax.set_xlabel('人数(个)')
ax.set_title('某城市人口金字塔')
ax.legend()
plt.show()
运行结果:

**题目二:**绘制漏斗图
编写程序。根据第8.7,绘制如下图的漏斗图。

运行代码:
python
#绘制漏斗图
import numpy as np
import matplotlib.pyplot as plt
plt.rcParams['font.sans-serif'] = 'SimHei'
plt.rcParams['axes.unicode_minus'] = False
num = 5
height=0.5
x1 = np.array([1000, 500, 300, 200, 150])
x2 = np.array((x1.max()-x1)/2)
x3 = [i+j for i, j in zip(x1, x2)]
x3 = np.array(x3)
y = -np.sort(-np.arange(num))
labels = ['访问商品', '加购物车', '生成订单', '支付订单', '完成交易']
fig = plt.figure(figsize=(10, 8))
ax = fig.add_subplot(111)
#绘制条形图
rects1 = ax.barh(y, x3, height, tick_label=labels, color='g', alpha=0.5)
#绘制辅助条形图
rects2 = ax.barh(y, x2, height, color='w', alpha=1)
ax.plot(x3, y, 'black', alpha=0.7)
ax.plot(x2, y, 'black', alpha=0.7)
notes = []
for i in range(0, len(x1)):
    notes.append('%.2f%%'%((x1[i]/x1[0])*100))
for rect_one, rect_two, note in zip(rects1, rects2, notes):
    text_x = rect_two.get_width() + (rect_one.get_width()-rect_two.get_width())/2-30
    text_y = rect_one.get_y() + height/2
    ax.text(text_x, text_y, note, fontsize=12)
ax.set_xticks([])
for direction in ['top', 'left', 'bottom', 'right']:
    ax.spines[direction].set_color('none')
ax.yaxis.set_ticks_position('none')
plt.show()
运行结果:

题目 **三:**绘制桑基图
编写程序。根据第8.8,绘制如下图的桑基图
 。
。
运行代码:
python
#绘制桑基图
from matplotlib.sankey import Sankey
import matplotlib.pyplot as plt
plt.rcParams['font.sans-serif'] = 'SimHei'
plt.rcParams['axes.unicode_minus'] = False

flows = [0.7, 0.3, -0.3, -0.1, -0.3, -0.1, -0.1, -0.1]
labels = ['工资', '副业', '生活', '购物', '深造', '运动', '其他', '买书']
orientations = [1, 1, 0, -1, 1, -1, 1, 0]
sankey = Sankey()
sankey.add(flows = flows, labels=labels, orientations=orientations, color='black', fc='lightgreen', patchlabel='生活消费', alpha=0.7)
#桑基图绘制完成的对象
diagrams = sankey.finish()
diagrams[0].texts[4].set_color('r')
diagrams[0].texts[4].set_weight('bold')
diagrams[0].text.set_fontsize(20)
diagrams[0].text.set_fontweight('bold')
plt.title("日常生活开销的桑基图")
plt.show()
运行结果:

题目 **四:**绘制树状图
编写程序。根据第8.9,绘制如下图的树状图。

运行代码:
python
#绘制树状图
import pandas as pd
import matplotlib.pyplot as plt
import scipy.cluster.hierarchy as shc
plt.rcParams['font.sans-serif'] = 'SimHei'
plt.rcParams['axes.unicode_minus'] = False

df = pd.read_excel(r"D:\数据可视化\14\USArrests.xlsx")
plt.figure(figsize=(10, 6), dpi=80)
plt.title("美国各州犯罪案件的树状图", fontsize=12)
#绘制树状图
dend = shc.dendrogram(shc.linkage(df[['Murder', 'Assault', 'UrbanPop']], method='ward'), labels=df.State.values, color_threshold=100)
plt.xticks(fontsize=10.5)
plt.ylabel('案件数量(个)')
plt.show()
运行结果:

题目 **五:**绘制华夫饼图
编写程序。根据第8.10,绘制如下图的华夫饼图。

运行代码:
python
#绘制华夫饼图
import matplotlib.pyplot as plt
from pywaffle import Waffle
plt.rcParams['font.sans-serif'] = 'SimHei'
plt.rcParams['axes.unicode_minus'] = False
#绘制华夫饼图
plt.figure(FigureClass=Waffle, rows=10, columns=10, values=[95, 5], vertical=True, colors=['#20B2AA', '#D3D3D3'],
           title={'label':'电影《少年的你》上座率'}, legend={'loc':'upper right', 'labels':['占座', '空座']})
plt.show()
运行结果:
