通过metricbeat采集prometheus指标
通过beat采集prometheus内的单个指标。
低版本beat只能全量
环境
低版本metricbeat只能全量采集
软件版本:metricbeat==8.11.1
解压
cmd
tar zxvf metricbeat-8.11.1-linux-x86_64.tar.gz -C /usr/local配置
首先,修改metricbeat.yml,把output指定为接收地址,这里使用了logstash,原定使用kafka,但是本地kafka的版本较低,会出现发送失败问题。
output.logstash:
  hosts: ["192.168.113.138:5044"]
其次是修改modules.d/下的prometheus.yml.disabled为prometheus.yml,然后修改配置
cmd
cp prometheus.yml.disabled prometheus.yml第一块是配置prometheus
yml
#- module: prometheus
#  period: 10s
#  hosts: ["localhost:9090"]
#  metrics_path: /metrics
  #metrics_filters:
  #  include: []
  #  exclude: []
  #username: "user"
  #password: "secret"

  # This can be used for service account based authorization:
  #bearer_token_file: /var/run/secrets/kubernetes.io/serviceaccount/token
  #ssl.certificate_authorities:
  #  - /var/run/secrets/kubernetes.io/serviceaccount/service-ca.crt

  # Use Elasticsearch histogram type to store histograms (beta, default: false)
  # This will change the default layout and put metric type in the field name
  #use_types: true

  # Store counter rates instead of original cumulative counters (experimental, default: false)
  #rate_counters: true
第二块是配置Prometheus 服务器使用 remote_write 选项发送的指标
yml
# Metrics sent by a Prometheus server using remote_write option
#- module: prometheus
#  metricsets: ["remote_write"]
#  host: "localhost"
#  port: "9201"

  # Secure settings for the server using TLS/SSL:
  #ssl.certificate: "/etc/pki/server/cert.pem"
  #ssl.key: "/etc/pki/server/cert.key"

  # Use Elasticsearch histogram type to store histograms (beta, default: false)
  # This will change the default layout and put metric type in the field name
  #use_types: true

  # Store counter rates instead of original cumulative counters (experimental, default: false)
  #rate_counters: true

  # Define patterns for counter and histogram types so as to identify metrics' types according to these patterns
  #types_patterns:
  #  counter_patterns: []
  #  histogram_patterns: []
第三块才是我们用到的,将使用 PromQL 收集指标
- module: prometheus
  metricsets: ["query"]
  hosts: ["localhost:9090"]
  period: 10s
  queries:
  - name: "instant_vector"
    path: "/api/v1/query"
    params:
      query: "sum(rate(prometheus_http_requests_total[1m]))"
  - name: "range_vector"
    path: "/api/v1/query_range"
    params:
      query: "up"
      start: "2019-12-20T00:00:00.000Z"
      end:  "2019-12-21T00:00:00.000Z"
      step: 1h
  - name: "scalar"
    path: "/api/v1/query"
    params:
      query: "100"
  - name: "string"
    path: "/api/v1/query"
    params:
      query: "some_value"
效果
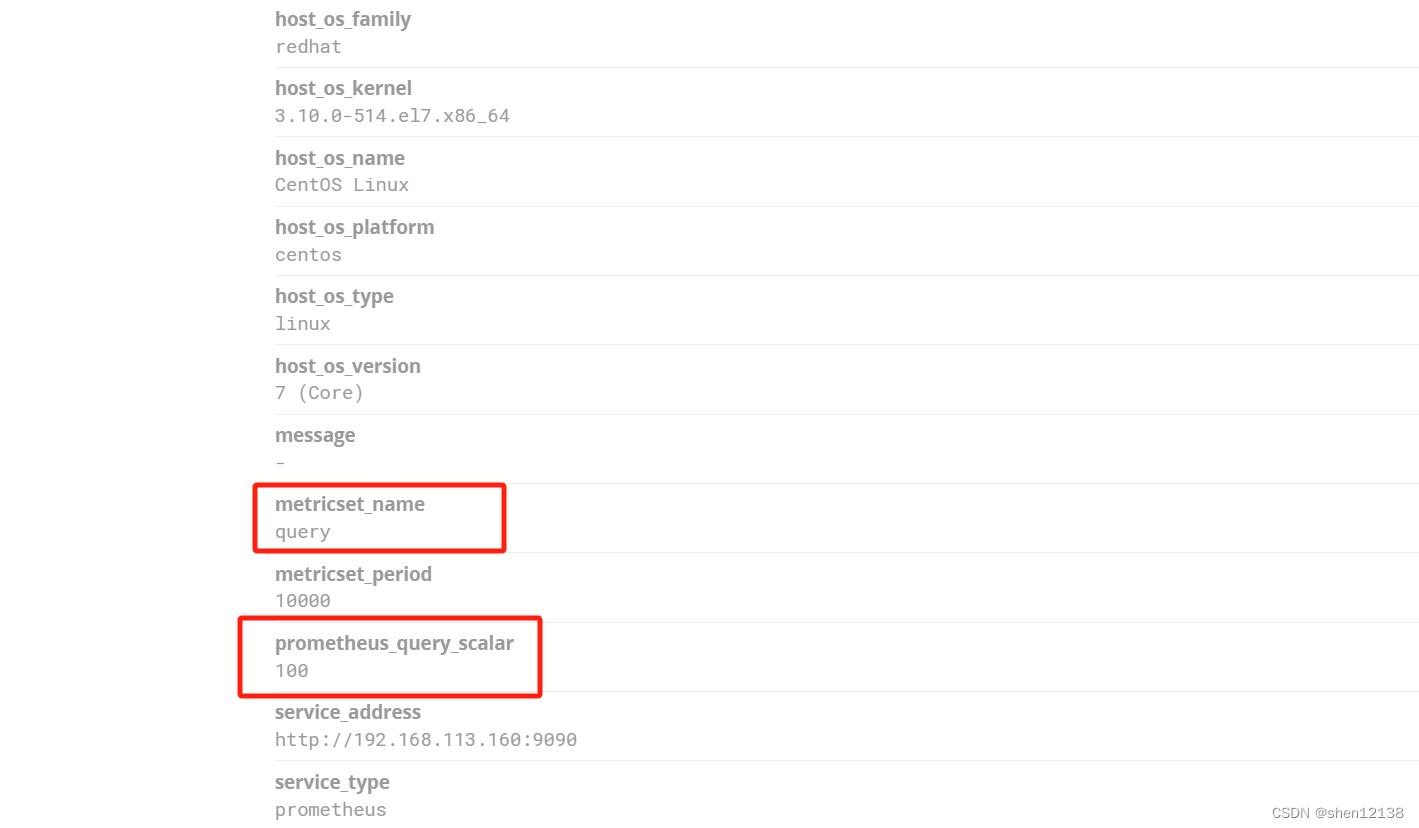
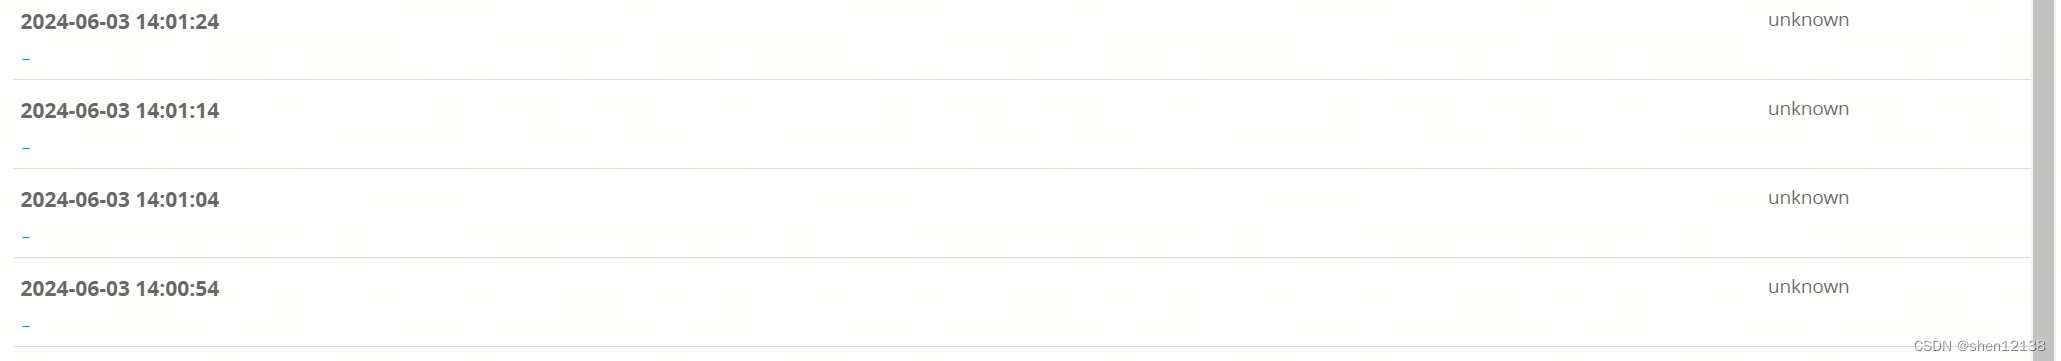
日志平台接收到可以看到
点开后发现有很多字段,最主要的是metricset_name,是配置query,采集回来的值字段为prometheus_query_scalar ,以此类推,会有prometheus_query_string 和prometheus_query_instant_vector