练习题2
使用超级英雄列表来填充一个新的 Series 对象。
使用力量元组来填充一个新的 Series 对象。
创建一个 Series,将超级英雄作为索引标签,力量等级作为值。将这个 Series 赋值给 heroes 变量。
提取 heroes Series 的前两行。
提取 heroes Series 的最后四行。
确定 heroes Series 中唯一值的个数。
计算 heroes 中超级英雄的平均力量。
计算 heroes 中的最大和最小力量。
计算每个超级英雄的力量等级翻倍后的值。
将 heroes Series 转换为 Python 字典。
python
#给出列表
superheros = [
    'Batman',
    'Superman',
    'Spider-man',
    'Iron man',
    'Captain America',
    'Wonder Woman'
]

strength_levels = (100, 120, 90, 95, 110, 120)

#1.转为series对象(列表)
pd.Series(superheros)

#2.力量值转为series对象
pd.Series(strength_levels)

#3.创建series
heros = pd.Series(
    data = strength_levels,
    index = superheros
)
heros

#4.
heros.head(2)

#5.
heros.tail(4)

#6.
heros.nunique()

#7.
heros.mean()

#8.
heros.max()
heros.min()

#9.
heros * 2

#10.
dict(heros)
练习题3
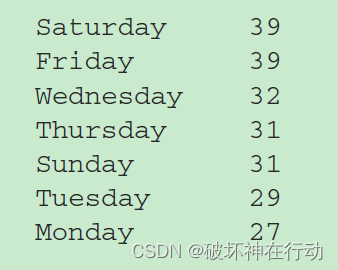
战争期间,一周中哪一天发生的战斗最多
python
import pandas as pd
import datetime as dt

#一周中每天转为星期形式
def day_of_week(day):
    return day.strftime('%A')

#战斗最多的一天(列出开始日期)
days_of_war = pd.read_csv(filepath_or_buffer='revolutionary_war.csv',
                  usecols=['Start Date'],
                  parse_dates=['Start Date'],
                 ).squeeze(1)

print(type(days_of_war))
print()
days_of_war

#dropna() 方法会删除 Series 中的任何包含 NaN(缺失值)的行
#apply(day_of_week) 会对剩余的每个非空元素应用自定义函数 day_of_week。
#这个操作将把日期转换为相应的星期几,将结果存储在名为 days 的新 Series 中。
days = days_of_war.dropna().apply(day_of_week)
days

#统计不同星期出现的次数
days.value_counts()
练习题4
导入nfl.csv,将Birthday转为datetimes
用2种方法将DataFrame的index设置为name
统计每个队伍的球员数量
查找工资最高的5个球员
排序:先将team按字母顺序排序,再将salary按降序排序
New York Jets roster队中年龄最大的球员是谁,他的生日是什么时候
python
# 1. 导入nfl.csv,将Birthday转为datetimes
nfl = pd.read_csv('nfl.csv', parse_dates=['Birthday'])
nfl

# 2. 用2种方法将DataFrame的index设置为name
# 第一种方法
nfl = nfl.set_index('Name')
nfl

# 第二种方法
nfl_2 = pd.read_csv('nfl.csv', parse_dates=['Birthday'], index_col='Name')
nfl

# 3. 统计每个队伍的球员数量
nfl['Team'].value_counts()

# 4. 查找工资最高的5个球员
nfl.sort_values(by=['Salary'], ascending=False).head(5)

# 5. 排序
# 先将team按字母顺序排序
# 再将salary按降序排序
nfl.sort_values(by=['Team', 'Salary'], ascending=[True, False])

# 6. New York Jets roster队中年龄最大的球员是谁,他的生日是什么时候
nfl = nfl.reset_index().set_index('Team')
nfl

nfl.loc['New York Jets']

nfl.loc['New York Jets'].sort_values('Birthday').head(1)
练习题5
- 优化数据集以限制内存使用并最大化效用。 这可能包括选择合适的数据类型、删除不必要的列等操作。
- 找到所有标题为 "Limitless" 的行。
- 找到所有导演为 "Robert Rodriguez" 且类型为 "Movie" 的行。
- 找到所有添加日期为 "2019-07-31" 或导演为 "Robert Altman" 的行。
- 找到所有导演为 "Orson Welles"、"Aditya Kripalani" 或 "Sam Raimi" 的行。
- 找到所有添加日期在 2019 年 5 月 1 日至 2019 年 6 月 1 日之间的行。
- 删除导演列中包含 NaN 值的所有行。
- 确定 Netflix 只在其目录中添加了一部电影的日期。
python
# 优化数据集以限制内存使用并最大化效用
netflix = pd.read_csv('netflix.csv', parse_dates=['date_added'])
netflix.info()
netflix.nunique()

netflix['type'] = netflix['type'].astype('category')
netflix.info()

# 找到所有标题为 "Limitless" 的行。
title = netflix['title'] == 'Limitless'
netflix[title]


# 找到所有导演为 "Robert Rodriguez" 且类型为 "Movie" 的行。
director = (netflix['director'] == 'Robert Rodriguez')
typeMovie = netflix['type'] == 'Movie'
netflix[director & typeMovie]
# 找到所有添加日期为 "2019-07-31" 或导演为 "Robert Altman" 的行。
date = netflix['date_added'] == '2019-07-31'
director = netflix['director'] == 'Robert Altman'
netflix[date | director]

# 找到所有导演为 "Orson Welles"、"Aditya Kripalani" 或 "Sam Raimi" 的行
directors = ['Orson Welles', 'Aditya Kripalani', 'Sam Raimi']
target = netflix['director'].isin(directors)
netflix[target]

# 找到所有添加日期在 2019 年 5 月 1 日至 2019 年 6 月 1 日之间的行。
addMovie = netflix['date_added'].between('2019-5-1', '2019-6-1')
netflix[addMovie]


# 删除导演列中包含 NaN 值的所有行。
netflix.dropna(subset = ['director'])


# 确定 Netflix 只在其目录中添加了一部电影的日期。
netflix.drop_duplicates(subset=['date_added'], keep=False)
练习题6
customers.csv包括一个地址列。
每个地址由一条街道、城市、州和邮政编码组成。
分离这四个值;
将它们分配到DataFrame中新的Street、City、State和Zip列;
然后删除地址列。
python
customers = pd.read_csv('customers.csv')
customers

customers['Address'].values

split = customers['Address'].str.split(',' , expand = True)
split

customers[['Street', 'City', 'State', 'Zip']] = split
customers = customers.drop(labels='Address', axis='columns')
customers
练习题8
1 在 cars 数据集中,聚合汽车价格的总和。在行轴上按燃料类型分组结果。
2 在 cars 数据集中,聚合汽车的数量。在索引轴上按制造商分组,在列轴上按变速箱类型分组。显示行和列的子总数。
3 在 cars 数据集中,聚合汽车价格的平均值。在索引轴上按年份和燃料类型分组,在列轴上按变速箱类型分组。
4 给定上一个挑战中的 DataFrame,将变速箱级别从列轴移动到行轴。
5 将 min_wage 从宽格式转换为窄格式。换句话说,将数据从八个年份列(2010-17)移动到单个列中。
python
car = pd.read_csv('used_cars.csv')
car

min_wage = pd.read_csv('minimum_wage.csv')
min_wage.head()

#1.
car.pivot_table(
    values = 'Price',
    index = 'Fuel',
    aggfunc = 'sum'
)

#2.
car.pivot_table(
    values = 'Price',
    index = 'Manufacturer',
    columns = 'Transmission',
    aggfunc = 'count',
    margins = True,
    margins_name = 'Total'
)

#3.
car.pivot_table(
    values = 'Price',
    index = ['Year','Fuel'],
    columns = 'Transmission',
    aggfunc = 'mean'
)

#4.
c1 = car.pivot_table(
    values = 'Price',
    index = ['Year','Fuel'],
    columns = 'Transmission',
    aggfunc = 'mean'
)
c1.stack()


#5.
year = ['2010','2011','2012','2013','2014','2015','2016','2017']
min_wage.melt(id_vars = 'State',var_name = 'Year',value_name = 'wage')