grafana 通过自定义API获取数据

一、安装插件

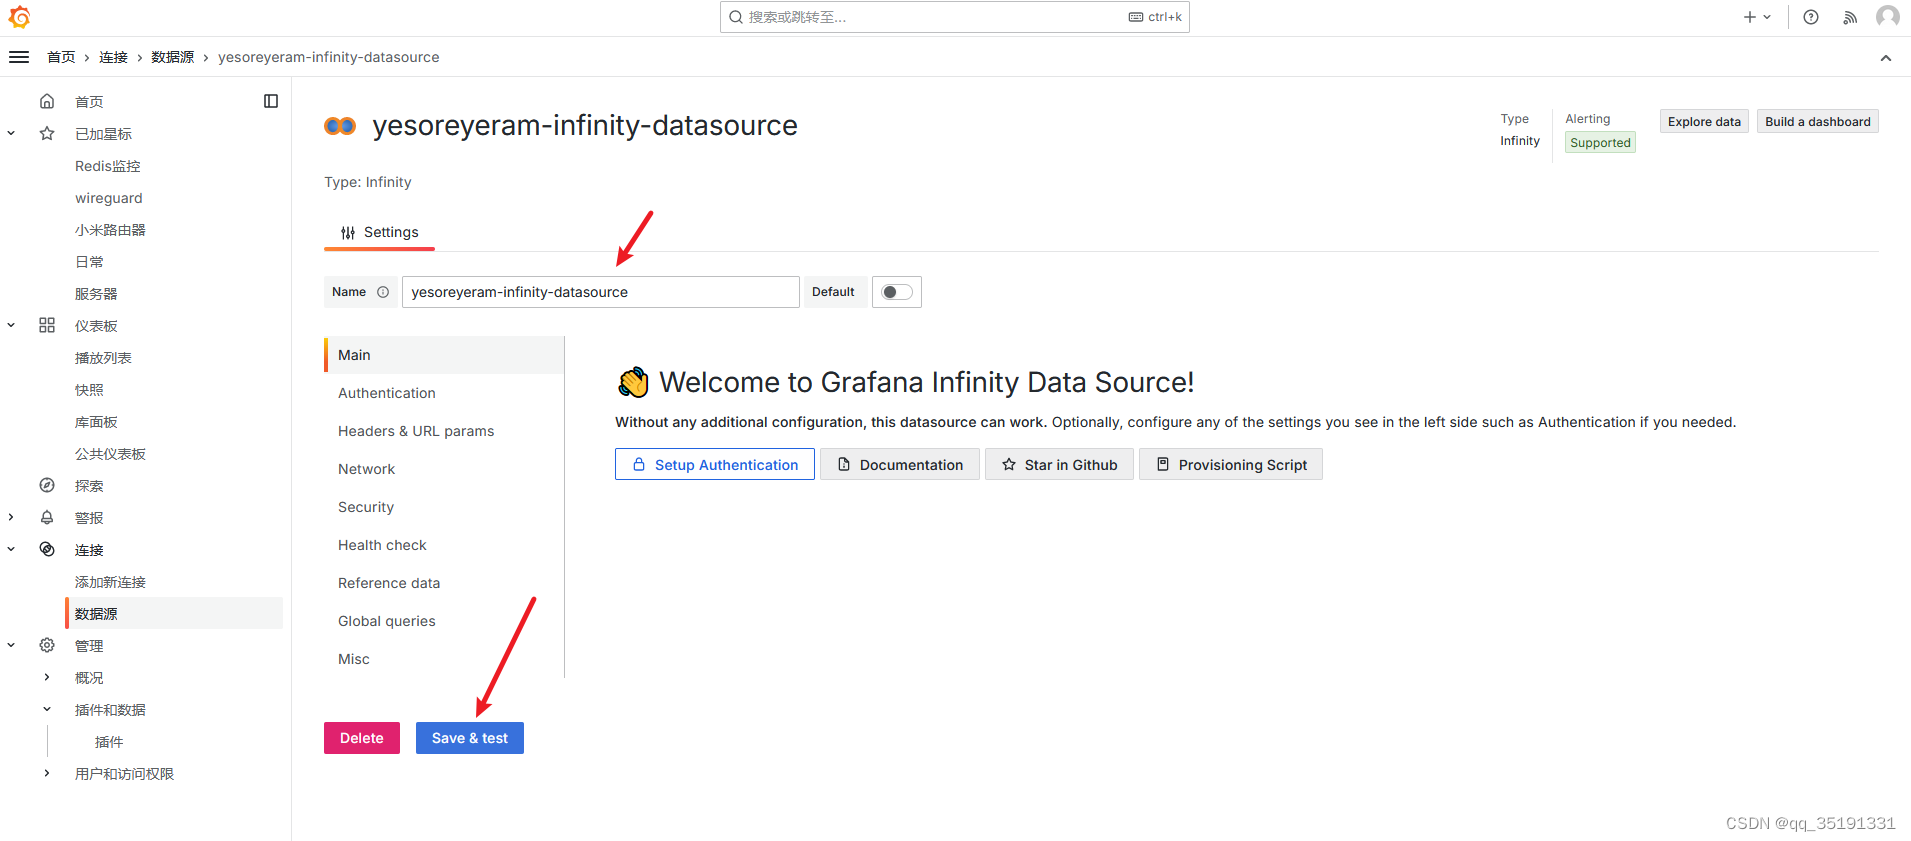
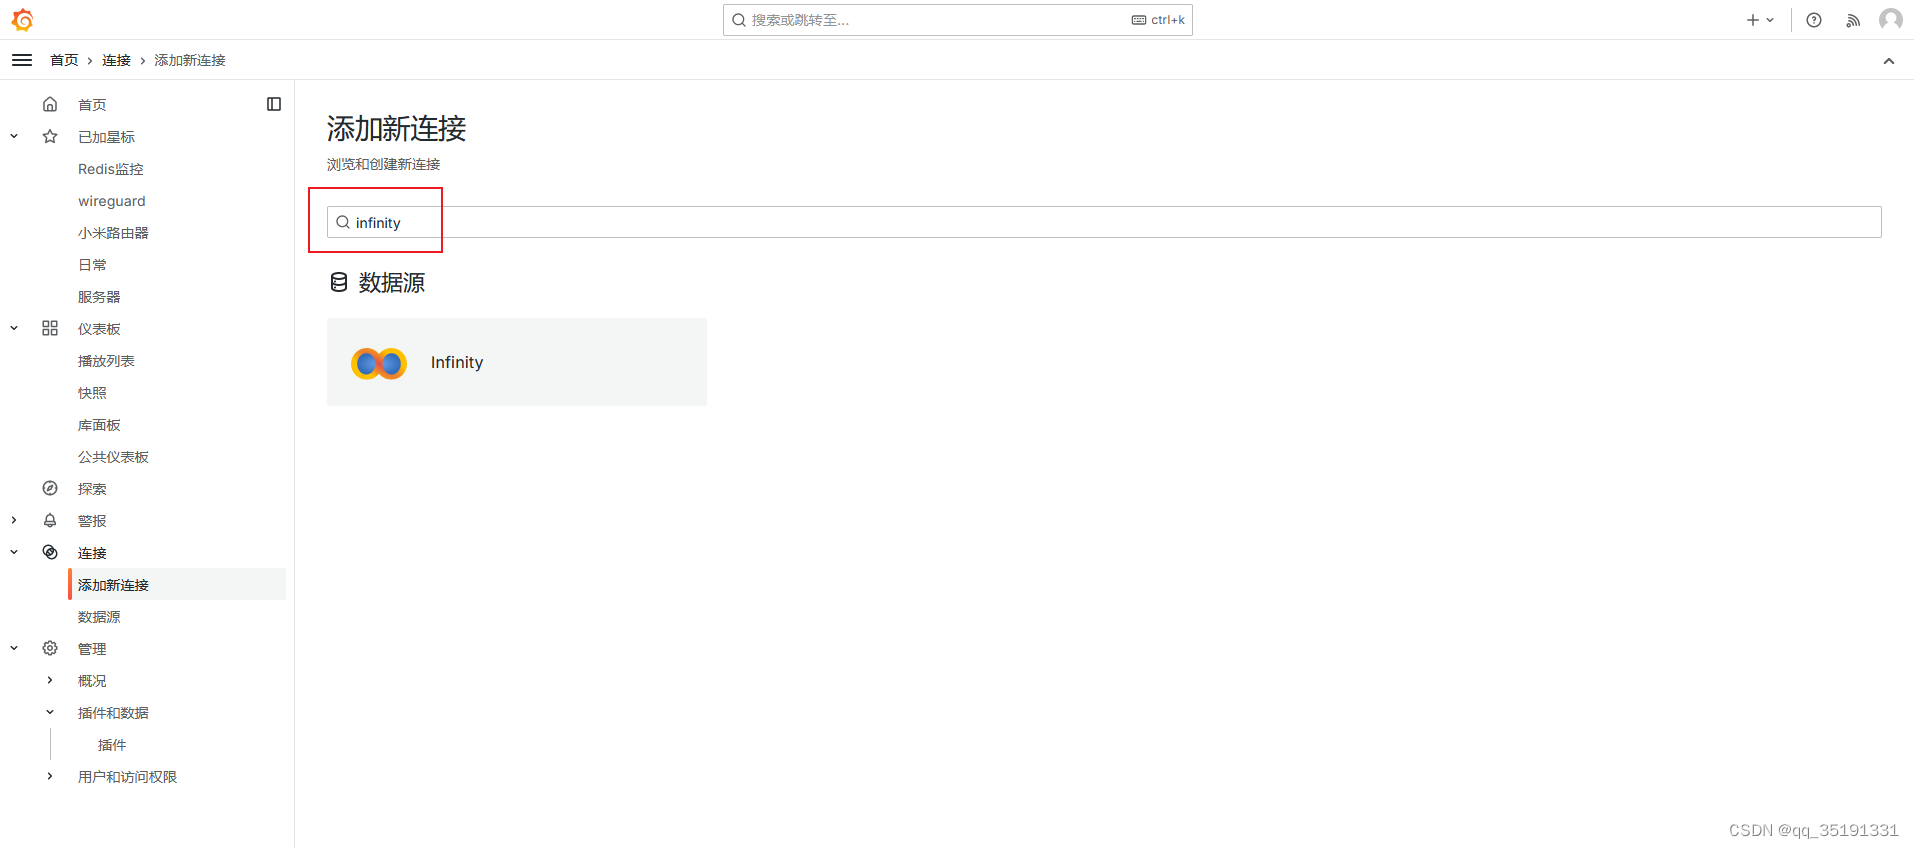
安装infinity插件

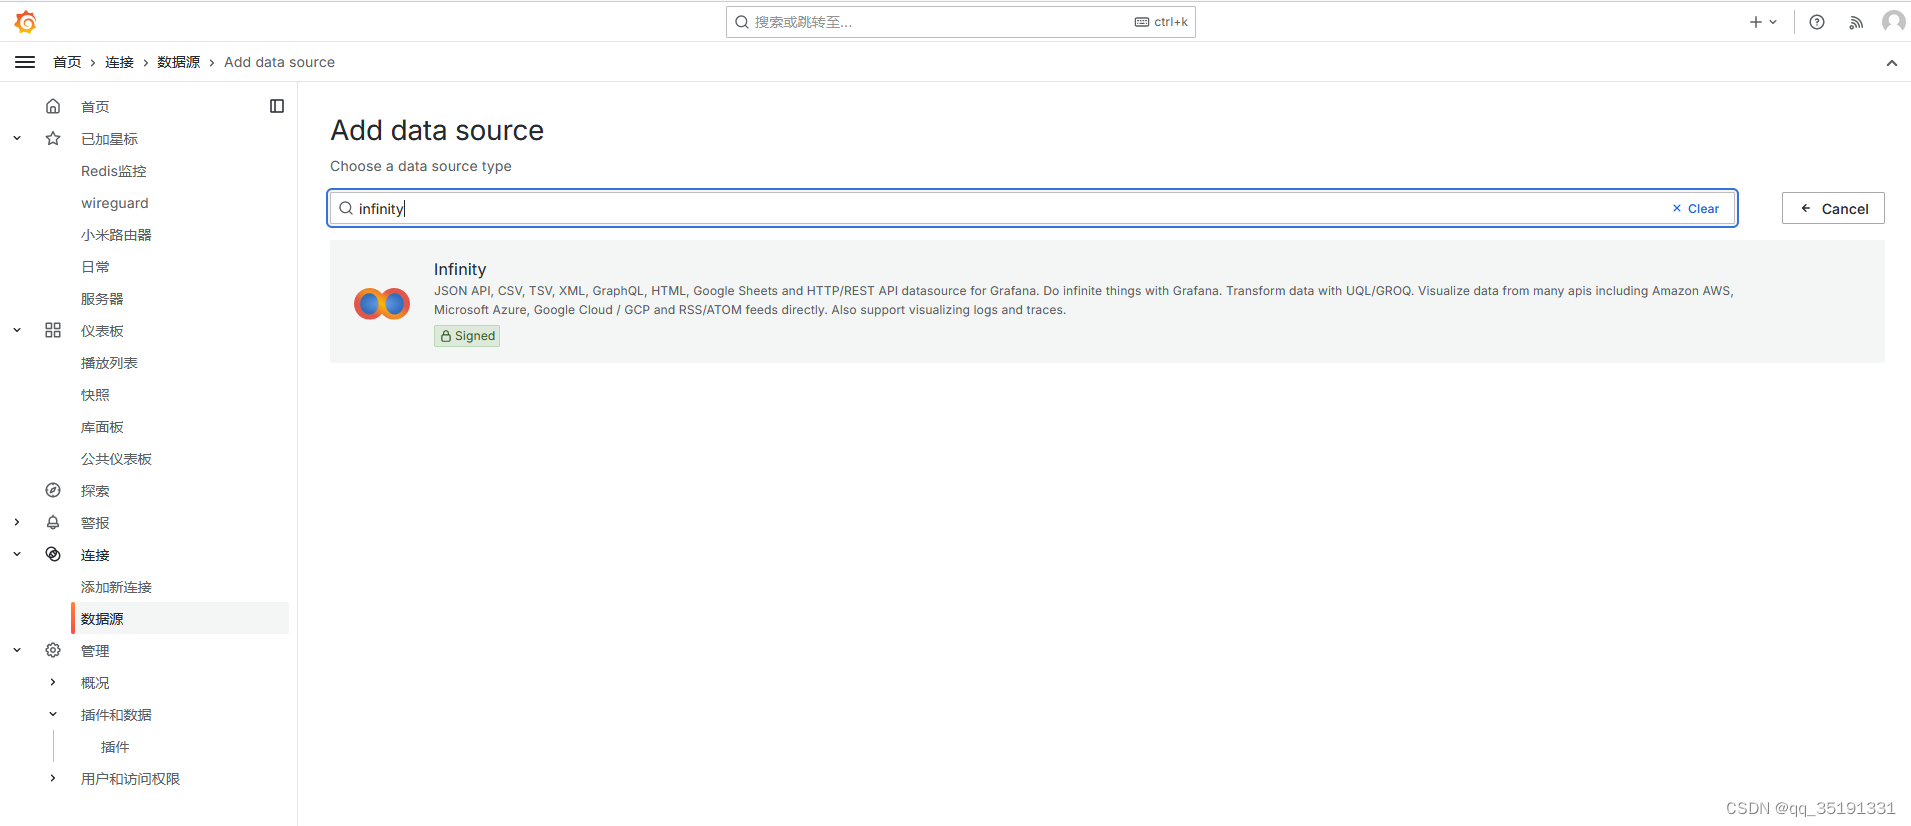
二、配置数据源

三、配置图表

1、数据

这边提供一个go的demo

golang 复制代码
package main

import (
	"math/rand"
	"net/http"
	"time"

	"github.com/gin-gonic/gin"
)

func main() {
	router := gin.Default()

	rand.Seed(time.Now().Unix())
	router.GET("/api/data", func(ctx *gin.Context) {
		var data []Metric
		for i := 0; i < 10; i++ {
			data = append(data, Metric{Entity: "m1", Value: rand.Float64() * 10.0, Time: time.Now().Add(time.Duration(-i) * time.Minute).UnixMilli()})
			data = append(data, Metric{Entity: "m2", Value: rand.Float64() * 10.0, Time: time.Now().Add(time.Duration(-i) * time.Minute).UnixMilli()})
			data = append(data, Metric{Entity: "m3", Value: rand.Float64() * 10.0, Time: time.Now().Add(time.Duration(-i) * time.Minute).UnixMilli()})
		}

		ctx.JSON(http.StatusOK, data)
	})

	router.Run(":8080")
}

type Metric struct {
	Entity string      `json:"entity"`
	Value  interface{} `json:"value"`
	Time   int64       `json:"time"`
}

2、图表

相关推荐
qq_452396233 天前
第十二篇:《数据采集:Grafana Alloy、Fluent Bit、Vector 的选型与配置》
java·贪心算法·grafana
2601_962097363 天前
可观测性实战:Prometheus+Grafana+OTel构建监控
grafana·prometheus·微服务架构·可观测性·opentelemetry
Joker-Full-stack3 天前
higress Grafana生产事故复盘:Loki 2.9 WAL 竞态 Bug 导致 5 天审计日志消失
bug·grafana·higress
IT界的老黄牛3 天前
Jenkins 监控一条龙:接入、看板 9964、11 条告警规则直接抄走
jenkins·grafana·prometheus·监控·ci-cd·告警规则
heimeiyingwang4 天前
【Prometheus·可视化篇】Grafana 集成:数据源配置与 Dashboard 设计原则
grafana·prometheus
2601_962097365 天前
GraphQL,Grafana和Dash
python·grafana·数据可视化·graphql·dash
happymade7 天前
7000 台网络设备批量纳管 & 自动拓扑生成实战——MSRM3 完整操作流程与关键要点复盘
运维·服务器·网络·zabbix·grafana·msrm3
AAA@峥7 天前
从零搭建 Prometheus 完整监控告警体系|Linux 部署 + node_exporter+Grafana 可视化
云原生·grafana·prometheus
liuyicenysabel8 天前
Grafana + Prometheus 分级告警配置设计(P0/P1/P2)
javascript·grafana·prometheus
随遇而安zx8 天前
SpringCloud---可观测性与监控:Actuator / Micrometer / Prometheus / Grafana 深度解析
spring cloud·grafana·prometheus