1.prometheus服务端安装
1.1下载包
使用wget下载 (也可以直接去官网下载包 Download | Prometheus)
bash
wget https://github.com/prometheus/prometheus/releases/download/v2.44.0/prometheus-2.44.0.linux-amd64.tar.gz1.2解压
bash
tar xf prometheus-2.44.0.linux-amd64.tar.gz
#移动到/usr/local/目录,并修改名字。 (移动到/usr/local/目录,使得所有用户都可以访问 Prometheus)
bash
mv prometheus-2.44.0.linux-amd64 /usr/local/prometheus1.3修改 Prometheus 配置文件
bash
#进入Prometheus目录
cd /usr/local/prometheus/

#备份配置文件
cp -ar prometheus.yml prometheus.yml-bak

#进入配置文件
vi prometheus.yml


## 最后一行localhost改为本机的ip
 static_configs:
      - targets: ["XXXX:9090"]
1.4 设置开机自启
(两种方式:推荐第一种)
第一种:配置系统启动文件,启动并设置开机自启
bash
#进入这个文件,默认是没有的,直接进入就行
vim /usr/lib/systemd/system/prometheus.service

#将下面的全部写进去
[Unit]
Description=Prometheus Server
Documentation=https://prometheus.io
After=network.target

[Service]
Type=simple
ExecStart=/usr/local/prometheus/prometheus \
--config.file=/usr/local/prometheus/prometheus.yml \
--storage.tsdb.path=/usr/local/prometheus/data/ \
--storage.tsdb.retention=15d \
--web.enable-lifecycle

ExecReload=/bin/kill -HUP $MAINPID
Restart=on-failure
[Install]
WantedBy=multi-user.target
bash
#启动
systemctl restart prometheus

#设置开机自启
systemctl enable prometheus

#查看端口是否启动9090
netstat -anput | grep 9090
第二种:进入解压目录,挂后台执行./prometheus
bash
#进入解压目录
cd /usr/local/prometheus

#挂后台执行./prometheus
./prometheus &

#查看端口是否启动
netstat -anput | grep 9090也是可以启动的,但是不好的是,不能设置开机自启,如果想要开机自启,还需要手动写一个启动服务器去执行他的命令或者周期性计划任务,所以不推荐使用方法二;推荐使用第一种。
1.5页面访问
浏览器访问:机器ip:9090 ,访问到 Prometheus 的 Web UI 界面。点击页面的 Status -> Targets,如看到 Target 状态都为 UP,说明 Prometheus 能正常采集到数据
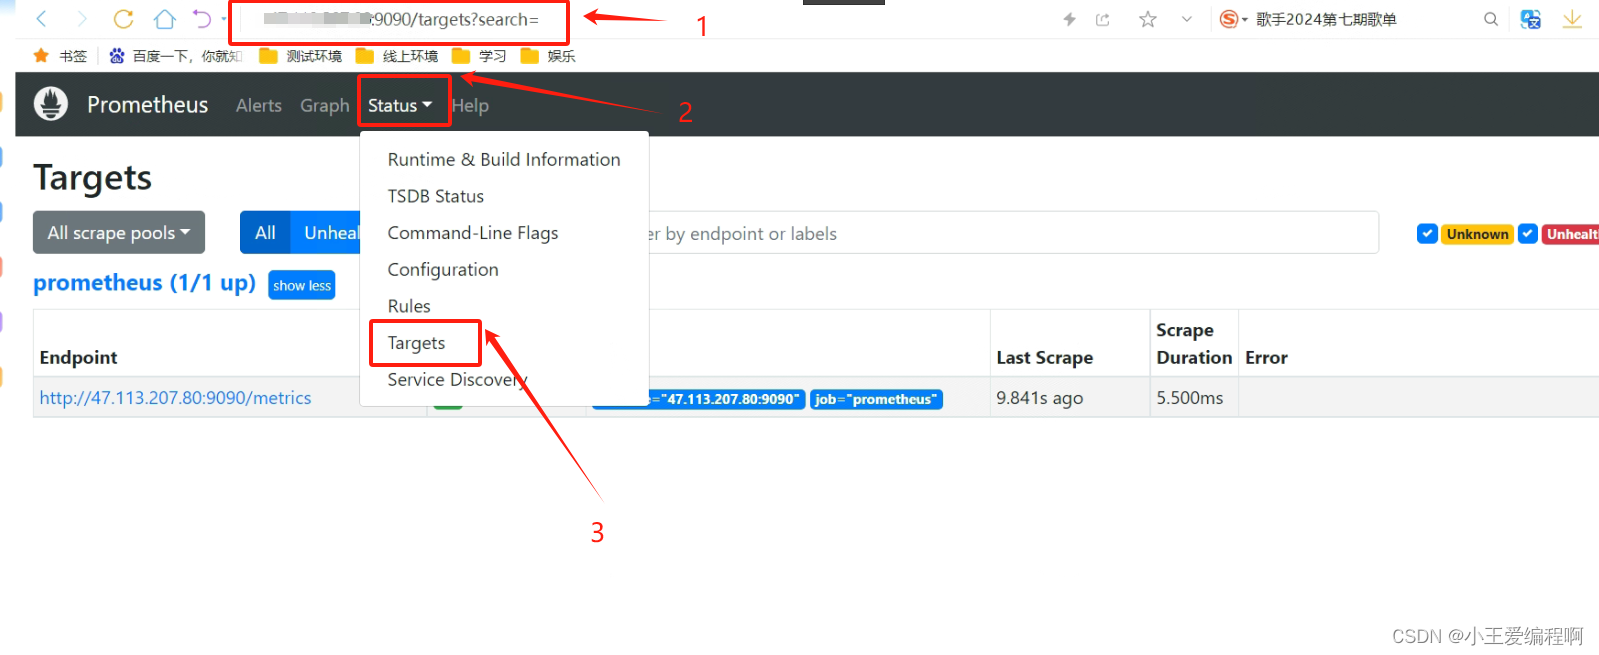
http://自己ip:9090/metrics ,可以看到 Prometheus 采集到自己的指标数据

查看折线图

2.客户端部署 Exporters
2.1下载
直接用wget下载 (也可以去官网下载包,Download | Prometheus)
bash
wget https://github.com/prometheus/node_exporter/releases/download/v1.6.0/node_exporter-1.6.0.linux-amd64.tar.gz2.2解压安装包
bash
tar xf node_exporter-1.6.0.linux-amd64.tar.gz

#移动到/usr/local/目录,并修改名字(名字可自行修改,只要记住这个文件夹是干什么的就行)
mv node_exporter-1.6.0.linux-amd64 /usr/local/prometheus_node
2.3设置开机自启
(两种方式:推荐第一种)
第一种:配置系统启动文件,启动并设置开机自启
bash
#进入这个文件,默认是没有的,直接进入就行
vim /usr/lib/systemd/system/node_exporter.service

#将下面的全部写进去
[Unit]
Description=node_exporter
Documentation=https://prometheus.io/
After=network.target

[Service]
Type=simple
ExecStart=/usr/local/prometheus_node/node_exporter \
--collector.ntp \
--collector.mountstats \
--collector.systemd \
--collector.tcpstat

ExecReload=/bin/kill -HUP $MAINPID
Restart=on-failure

[Install]
WantedBy=multi-user.target
bash
#启动
systemctl restart node_exporter

#设置开机自启
systemctl enable node_exporter

#查看端口是否启动9100
netstat -anput | grep 9100
第二种:进入解压目录,挂后台执行./node_exporter
bash
#进入解压目录
cd /usr/local/prometheus_node

#挂后台执行./prometheus
./node_exporter &

#查看端口是否启动
netstat -anput | grep 9100
页面访问,ip:port
3.监控机器配置
服务端机器添加徐娅监控的目标机器
3.1添加单个 客户端
bash
#进入prometheus的配置文件中
vim /usr/local/prometheus/prometheus.yml

#添加以下几行,到最后(格式和上面的服务端一样,因为yml文件格式要求严格,所以必须一样,否则启动会报错)
  - job_name: 'test_job'
    static_configs:
      - targets: ['XXXX:9100']
3.2添加多个 客户端
方式1:
bash
  - job_name: "test1"
    static_configs:
      - targets: ["xx1:9100"]
  - job_name: "test2"
    static_configs:
      - targets: ["xx2:9100"]
方式2:
bash
  - job_name: "test"
    static_configs:
      - targets:
        - xx1:9100
        - xx2:9100
方式3:
bash
  - job_name: "test"
    static_configs:
      - targets: ["xx1:9100"]
      - targets: ["xx2:9100"]
重启服务端
bash
systemctl restart prometheus刷新页面,按照步骤1.5访问。test_job就是目标机器数据。
4.安装Grafana
官网下载地址:Download Grafana | Grafana Labs

4.1下载
在安装prometheus的服务器上下载grafana
#下载安装
sudo yum install -y https://dl.grafana.com/enterprise/release/grafana-enterprise-11.0.0-1.x86_64.rpm

#启动Grafana服务
sudo systemctl start grafana-server


#设置开机启动
sudo systemctl enable grafana-server

#检查Grafana服务的状态,确保它正在运行
sudo systemctl status grafana-server
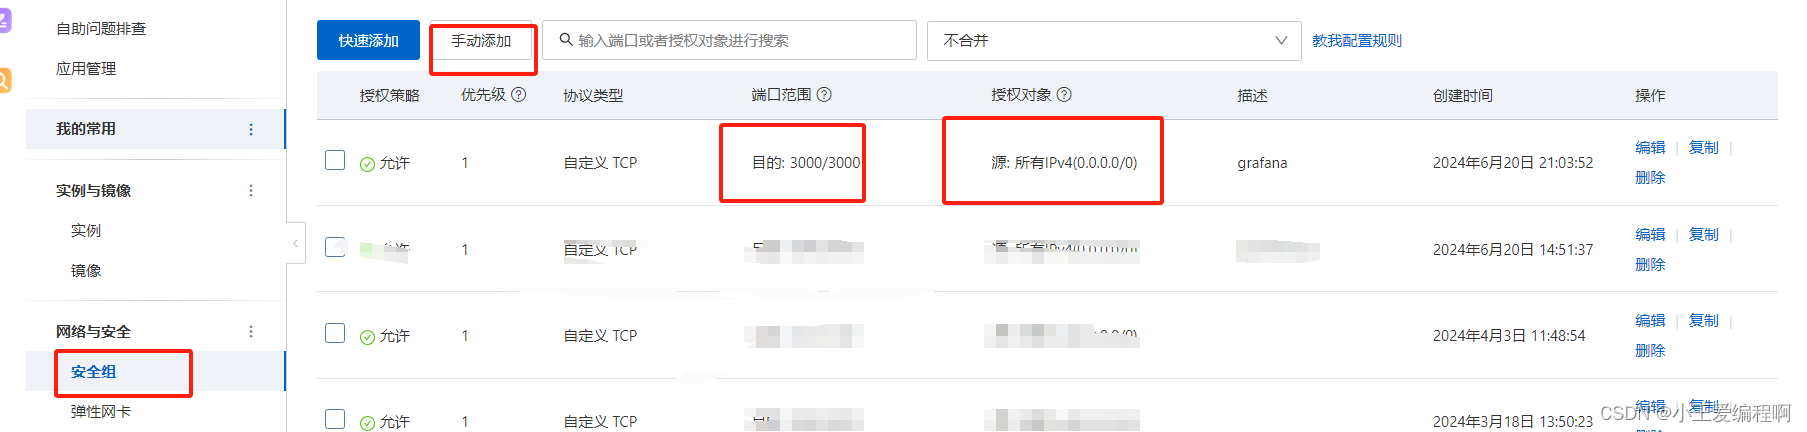
阿里云配置3000端口
4.2访问页面
ip:3000访问页面。初始用户名和密码都是admin

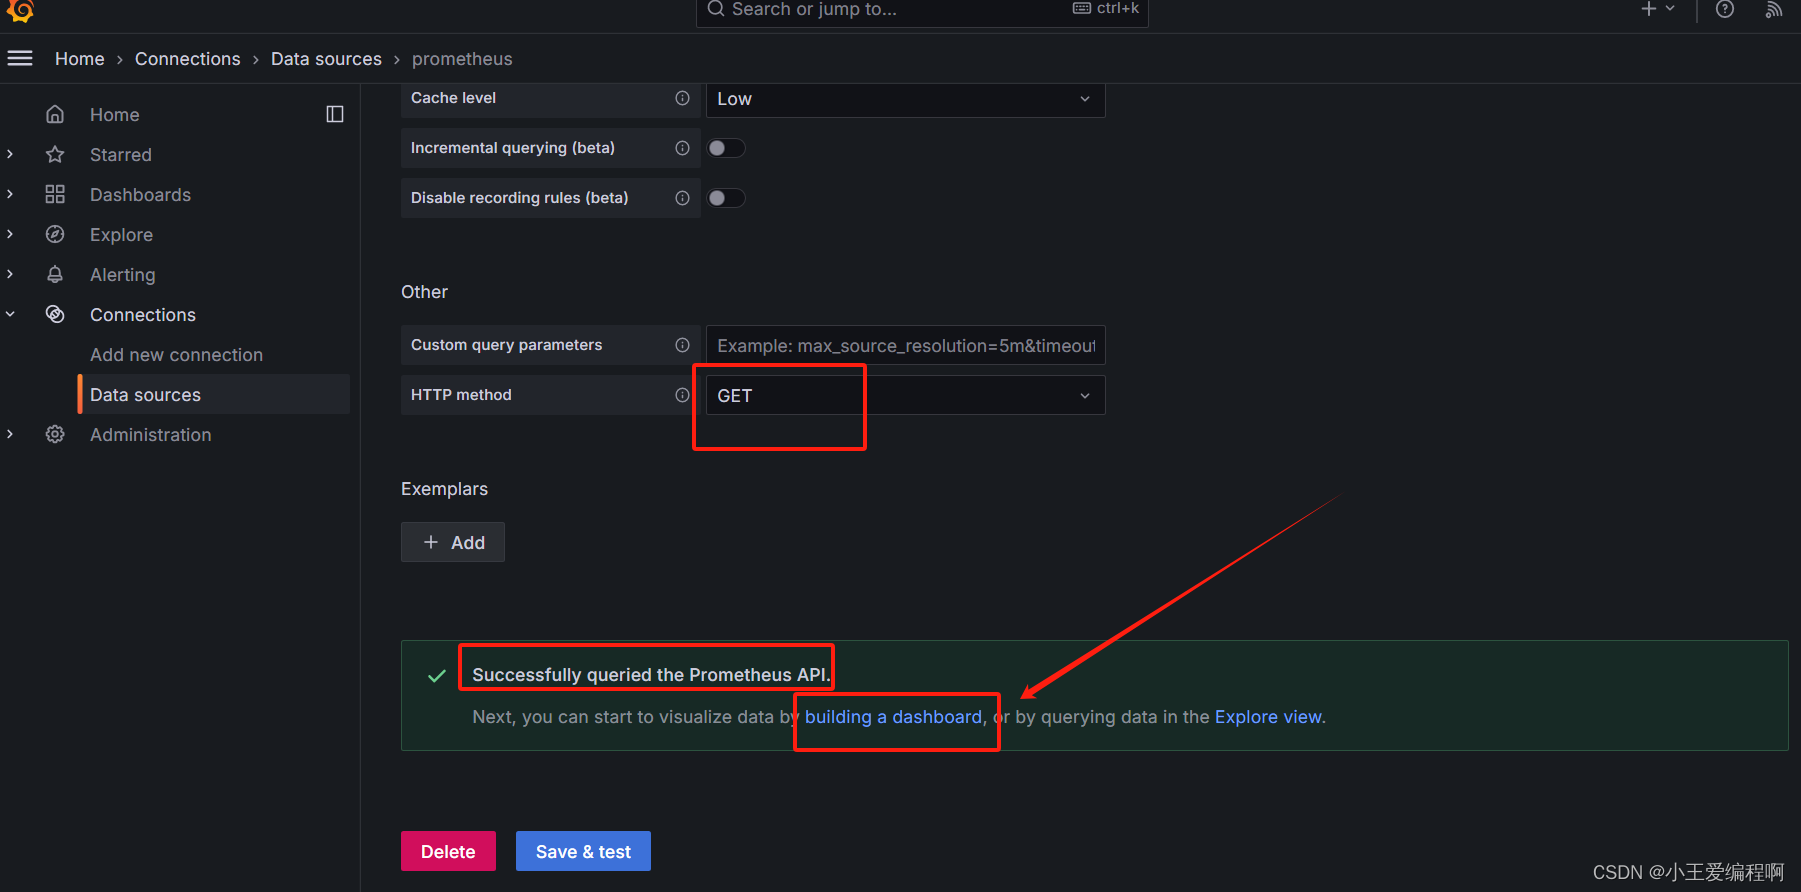
4.3 配置数据源
把 Prometheus 服务器收集的数据做为一个数据源添加到 grafana,让 grafana 可以得到 Prometheus 的数据


选择你想监控的指标
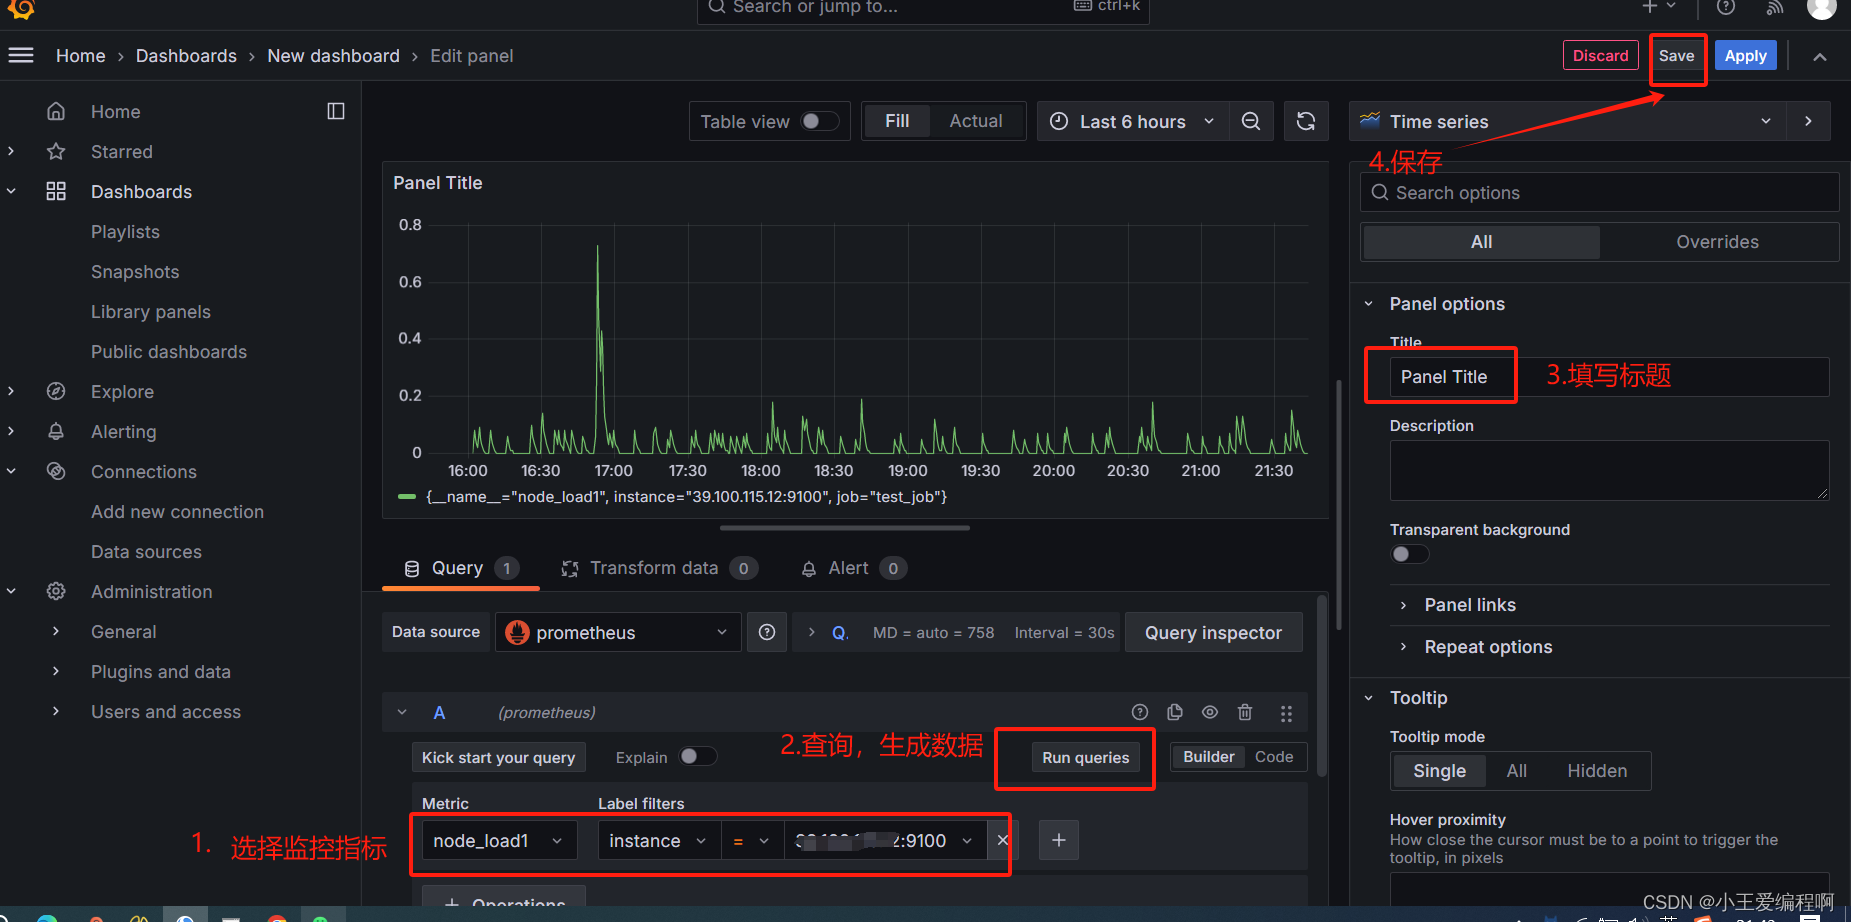
4.4导入grafana监控面板
4.3是自定义的监控模块(监控的服务端的1、5、15分钟的平均负载),一个一个添加比较麻烦,我们可以去找一些模板;
GitHub上面很多人开发了dashboards模板,官方社区上也有很多开源的dashboards模板,我们只需要把模板的Copy ID 或者 Download JSON文件导入到grafana即可,参考官网免费的dashboards模板。
进入官网,往下拉,可以看到选择这几个,Data Source 选择Prometheus,然后搜索主机监控,或者自己定义,搜索,linux什么的都可以,根据自己的需求选择;

找到喜欢的模板之后点进去,可以看到右边有Copy ID 和 Download JSON,自行选择就行;这里我选择复制id,json需要下载;

复制好id之后,打开在 grafana 页面中,输入面板 ID 号或者上传 JSON 文件,点击 Load,即可导入监控面板


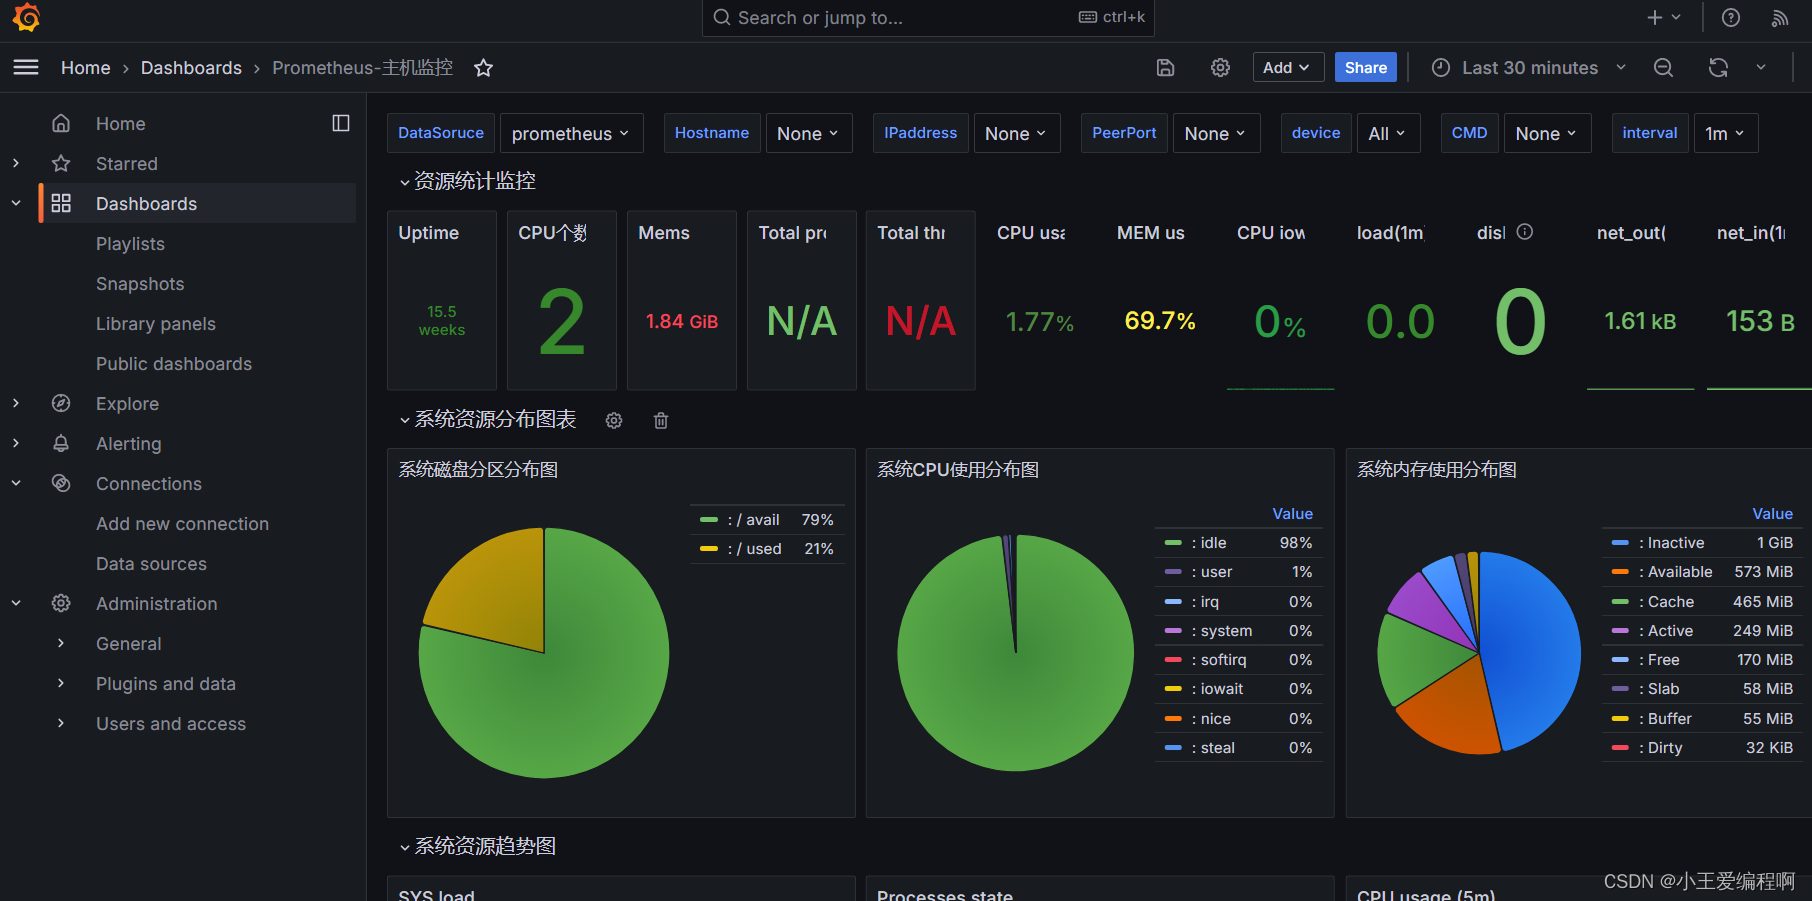
配置好的界面
5.配置检测
监测 Prometheus配置文件是否正确
bash
#进入prometheus目录
cd /usr/local/prometheus/

#执行promtool,监测配置是否正确
./promtool check config prometheus.yml
正常状态返回:
bash
Checking prometheus.yml
 SUCCESS: prometheus.yml is valid prometheus config file syntax
失败状态返回:
bash
Checking prometheus.yml
  FAILED: parsing YAML file prometheus.yml: "XX:80" is not a valid hostname
监测服务ip添加后缀
bash
 - job_name: "test_job"
    metrics_path: /test/demo/
    static_configs:
      - targets: ['XX:9999']