切线与切平面的可视化
flyfish
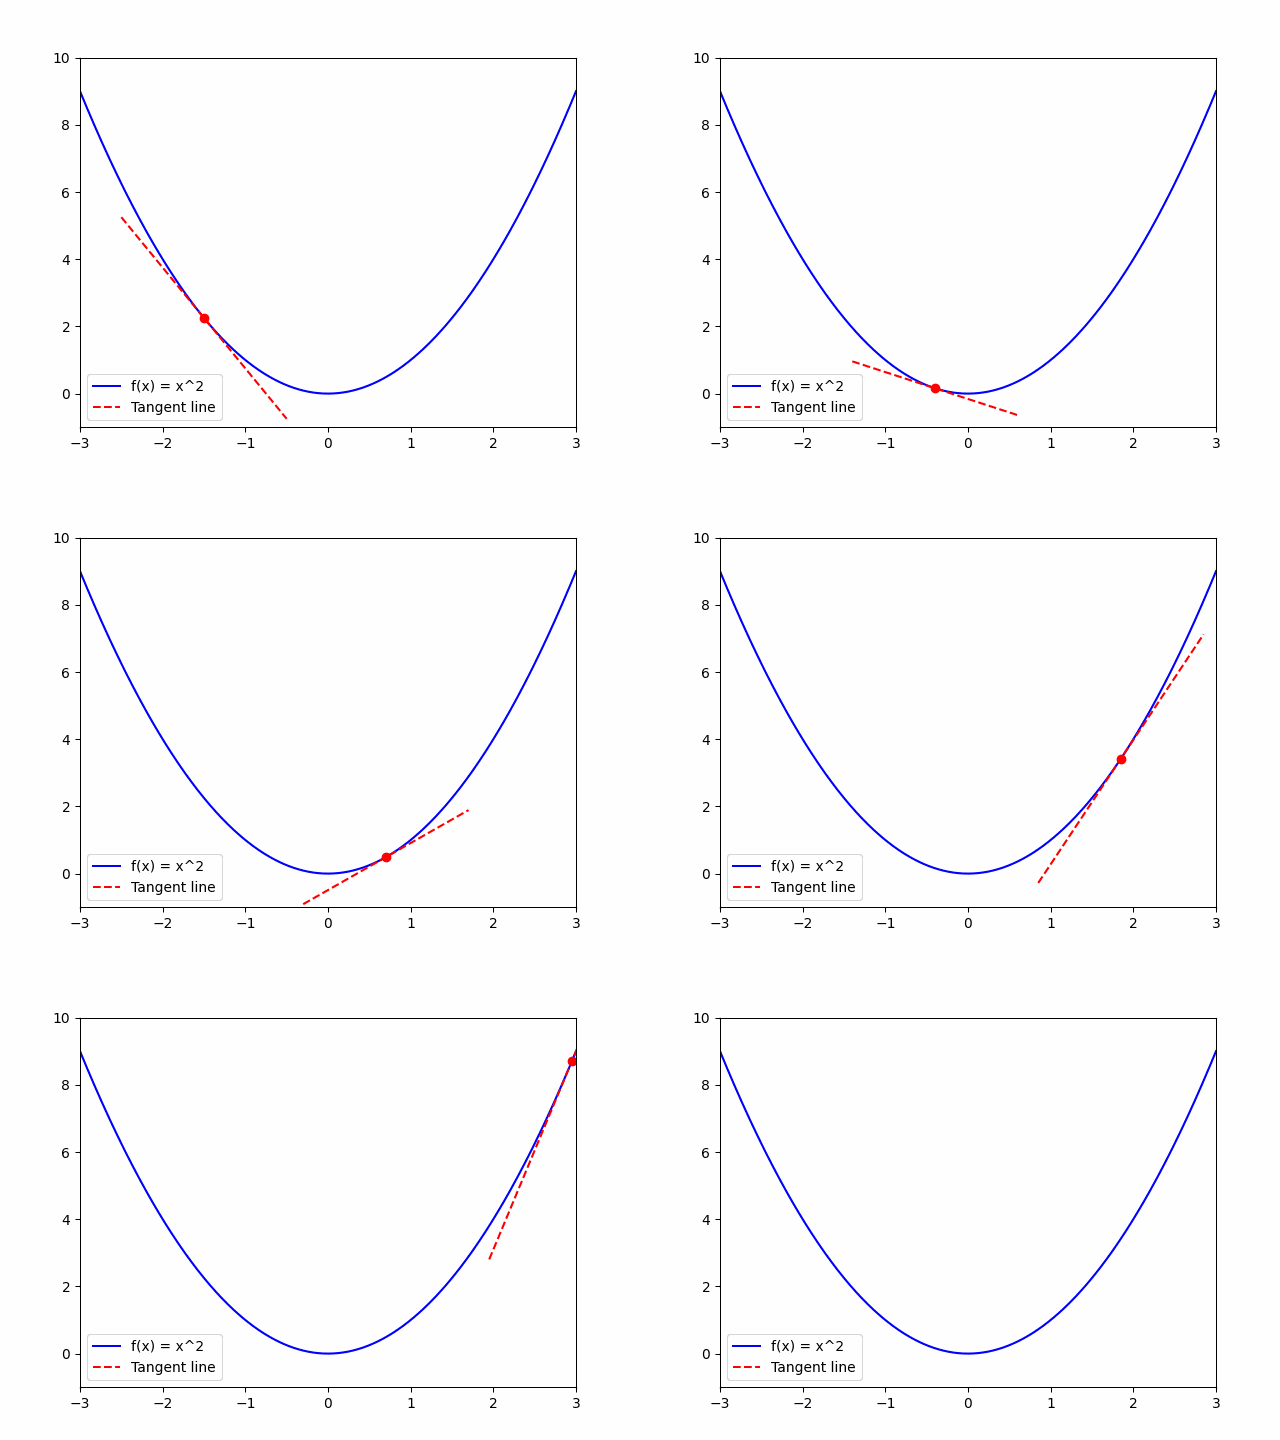
切线的可视化

py
import numpy as np
import matplotlib.pyplot as plt
from matplotlib.animation import FuncAnimation, PillowWriter

# 定义一个简单的一元函数,例如 f(x) = x^2
def func(x):
    return x**2

# 计算函数的导数
def derivative(x):
    return 2 * x

# 设置x的范围
x = np.linspace(-3, 3, 400)
y = func(x)

# 创建图形和轴
fig, ax = plt.subplots()
ax.plot(x, y, 'b', label='f(x) = x^2')
tangent_line, = ax.plot([], [], 'r--', label="Tangent line")  # 切线
point, = ax.plot([], [], 'ro')  # 用于显示切点

# 设置图形的范围
ax.set_xlim(-3, 3)
ax.set_ylim(-1, 10)
ax.legend()

# 初始化函数
def init():
    tangent_line.set_data([], [])
    point.set_data([], [])
    return tangent_line, point

# 更新函数,用于动画
def update(frame):
    x_val = frame / 20.0 - 1.5  # 随时间移动的x值

    # 计算切线的点
    y_val = func(x_val)
    slope = derivative(x_val)
    tangent_x = np.linspace(x_val - 1, x_val + 1, 100)
    tangent_y = slope * (tangent_x - x_val) + y_val

    # 更新切线和点的位置
    tangent_line.set_data(tangent_x, tangent_y)
    point.set_data([x_val], [y_val])

    return tangent_line, point

# 创建动画
ani = FuncAnimation(fig, update, frames=np.arange(0, 120), init_func=init, interval=100, blit=True)

# 保存动画为GIF文件
writer = PillowWriter(fps=10)
ani.save("derivative_animation.gif", writer=writer)

# 显示动画
plt.show()
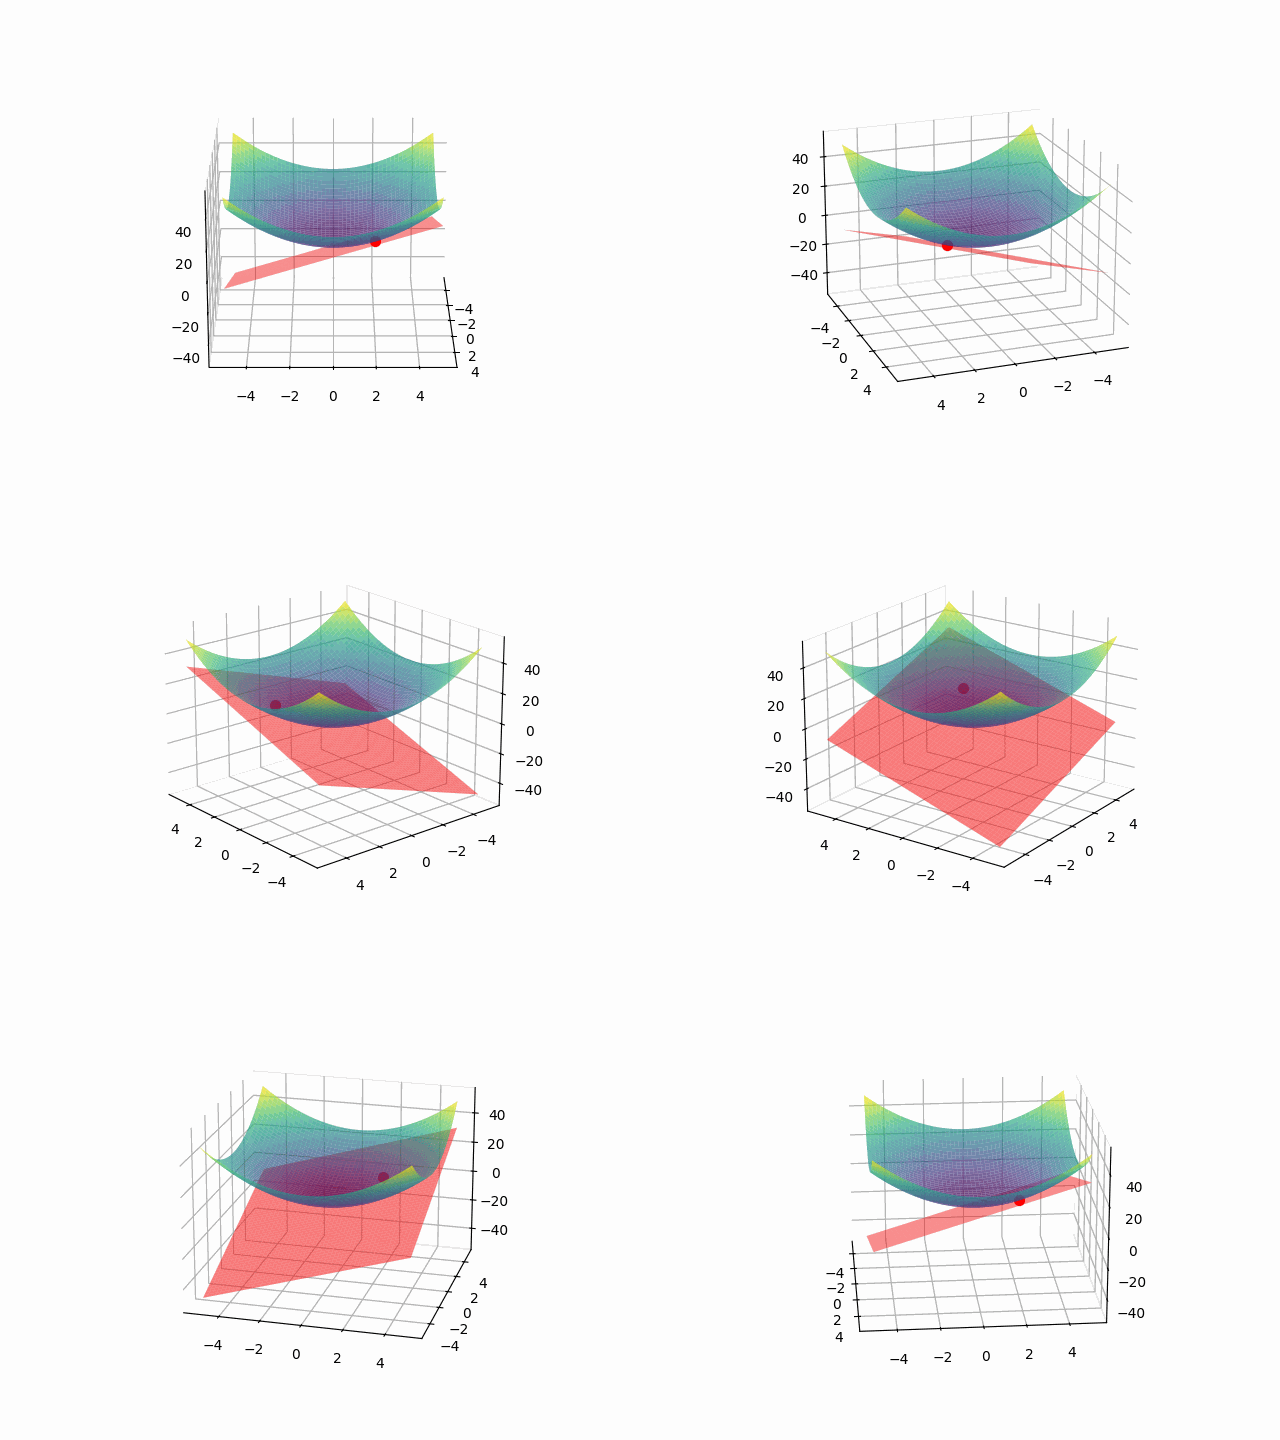
切平面的可视化

py
import numpy as np
import matplotlib.pyplot as plt
from mpl_toolkits.mplot3d import Axes3D
import imageio

# 定义二元函数
def f(x, y):
    return x**2 + y**2

# 定义切平面
def tangent_plane(x, y, x0, y0, z0, a, b):
    return z0 + a * (x - x0) + b * (y - y0)

# 计算二元函数的梯度
def gradient(x, y):
    fx = 2 * x
    fy = 2 * y
    return fx, fy

# 设置网格
x = np.linspace(-5, 5, 100)
y = np.linspace(-5, 5, 100)
x, y = np.meshgrid(x, y)
z = f(x, y)

# 选择切平面的点
x0, y0 = 2, 2
z0 = f(x0, y0)
fx, fy = gradient(x0, y0)

# 创建动画
filenames = []
for angle in range(0, 360, 5):
    fig = plt.figure()
    ax = fig.add_subplot(111, projection='3d')
    ax.plot_surface(x, y, z, cmap='viridis', alpha=0.7)

    # 画切平面
    z_plane = tangent_plane(x, y, x0, y0, z0, fx, fy)
    ax.plot_surface(x, y, z_plane, color='r', alpha=0.5)

    # 标记切点
    ax.scatter(x0, y0, z0, color='r', s=50)

    # 设置视角
    ax.view_init(elev=20., azim=angle)

    # 保存当前帧
    filename = f'_tmp{angle}.png'
    plt.savefig(filename)
    filenames.append(filename)
    plt.close()

# 创建GIF
with imageio.get_writer('tangent_plane_animation.gif', mode='I', duration=0.1,loop=0) as writer:
    for filename in filenames:
        image = imageio.imread(filename)
        writer.append_data(image)

# 清理临时文件
import os
for filename in filenames:
    os.remove(filename)