实时温湿度监测系统
前言
人生苦短,我用Python。
由于我在日常工作中经常使用Python,因此在进行该项目时,我首先考虑使用Python进行实现。在搜索电路板编程相关内容时,我发现Micropython是一个非常好的选择,因为它使用简单的语法能够帮助新手快速掌握。因此,我决定使用Micropython来实现该项目。

项目目的
实时监控房间温度,可以将其用作实时温湿度查看的桌面插件,也可以将其用作温湿度监控装置。
要求ESP32所处房间需要有可连接的wifi。
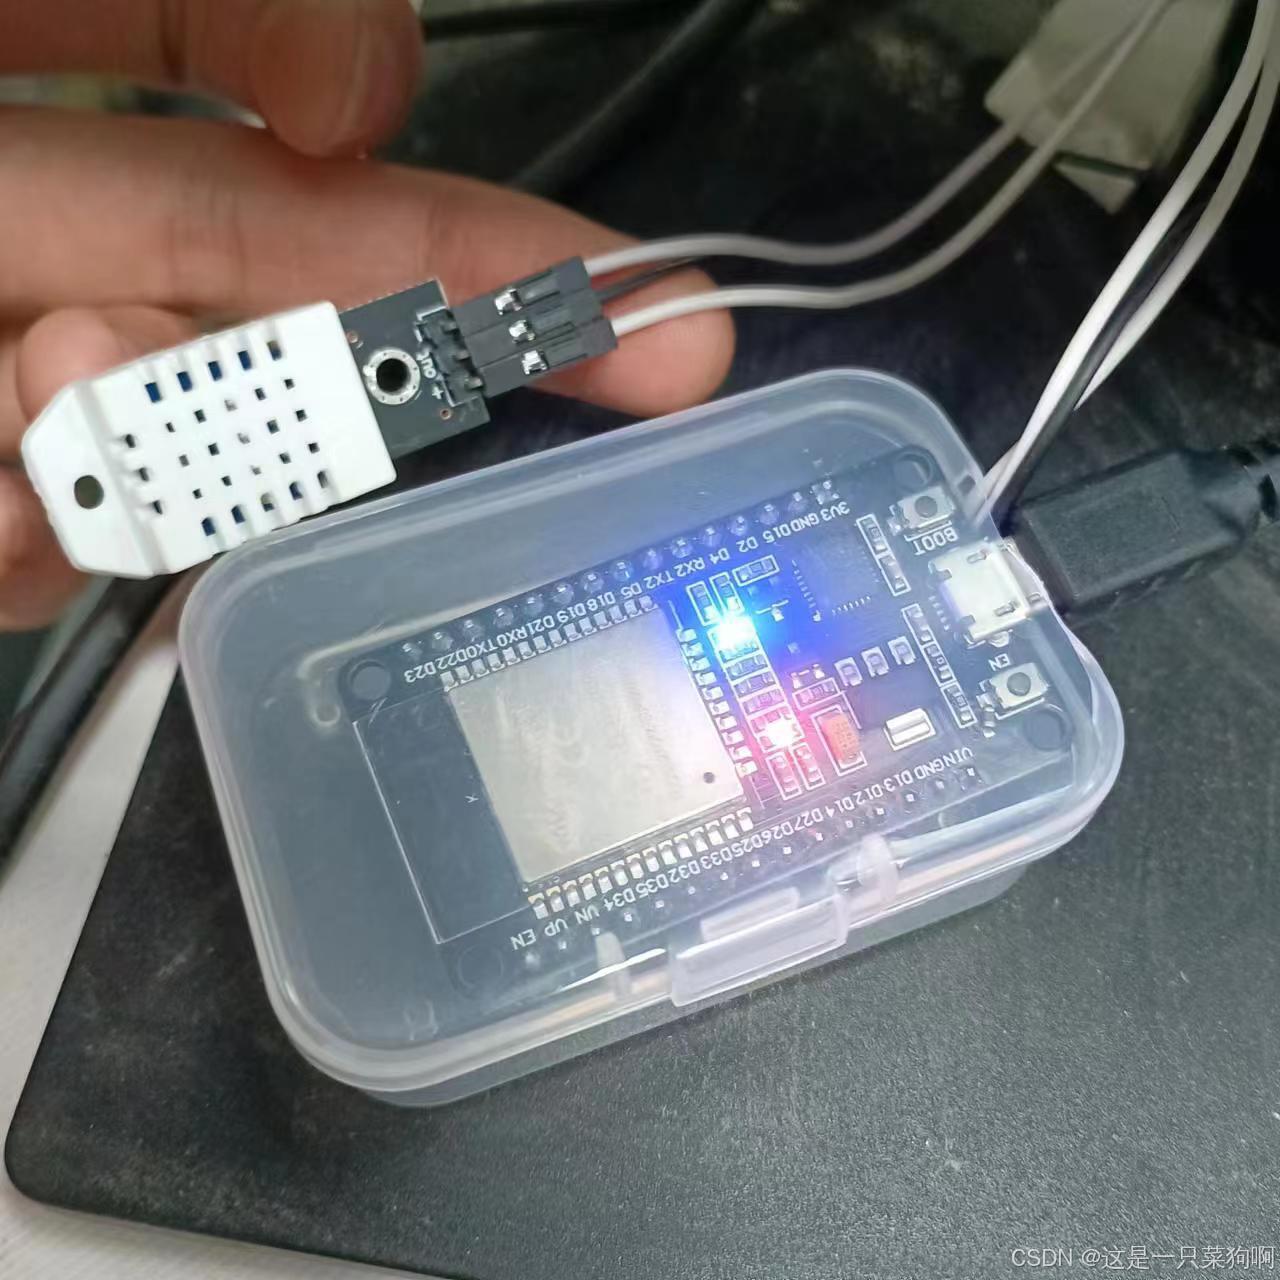
项目材料
- ESP32 wifi 模块
- HDT22 温湿度传感器
- 母对母接头(买HDT22会送)
项目步骤
模拟ESP32接线连接测试
可使用我进行模拟的网站进行学习,点击boot.py再点击播放键即可运行:"Wokwi测试项目"
这个测试网站可以使用"Wokwi-GUEST"开放式wifi进行测试,实际使用中将wifi改为房间中的wifi和密码即可。
并且该项目的两个py文件就是我本地拷录并且运行的代码,代码可以实现持续连接wifi和MQTT的功能,并且有呼吸灯和指示灯(这部分实际连接的时候可以注意到),还有一些数据传输的部分修饰。

能够看到当前的结果就是代码可以正常实现将温湿度以及时间数据传输到MQTT公共服务端:MQTT开放端口

动手实践时可以按照模拟的方式进行实际连接:

搭建PC端ESP32拷录环境
安装tonny并且快速入门可看这个前几集和课件。
【Python+ESP32 快速上手(持续更新中)【 通俗易懂 】】 https://www.bilibili.com/video/BV1G34y1E7tE/?share_source=copy_web\&vd_source=0d6fb1bf666097a8d32dc1f77cf20826
注意事项:
- 安装驱动之后连接ESP32到电脑可能不显示端口COM,可能是使用的数据线类型过旧,尽量更换数据线进行使用;
- Tonny运行的时候可能出现未连接情况,只需要点击重启后端,或者拔出等几秒重新插入即可。

对ESP32进行拷录
- 将模拟网站上的两个代码拷贝下来,修改TOPIC(尽量是唯一的,因为是公共端口,同时记得修改本地接收代码里面的信息)以及wifi部分,上传至ESP32中;
- 正确连接HDT22和ESP32;
- 给ESP32进行供电,当连接之后蓝灯闪烁就是在上传实时温湿度,蓝灯常亮就是MQTT端口暂时端口,蓝灯不亮就是wifi也没连上;
PC端搭建桌面组件
这部分是主要使用MQTTpython包进行本地数据接收以及tkinter创建桌面组件实现实时展示并且可以绘制折线图。
本地数据接收
MQTT本地包进行实时数据接收,保存到当前目录下的data.txt,可以自行修改,同时记得修改桌面组件读取路径。
python
import paho.mqtt.client as mqtt
import json

# 当收到连接时的回调函数
def on_connect(client, userdata, flags, rc):
    print("Connected with result code " + str(rc))
    # 订阅主题
    client.subscribe(topic)

# 当接收到消息时的回调函数
def on_message(client, userdata, msg):
    print("Received message: " + msg.payload.decode())
    dict = json.loads(msg.payload.decode())
    # 将消息保存到文件、数据库等
    with open("data.txt", "a") as file:
        file.write('\t'.join([dict["time"].replace("_"," "),str(dict["temp"]),str(dict["humidity"])])+"\n")

# MQTT Broker的连接参数
broker = "broker.hivemq.com"
port = 1883  # 端口号
topic = "wokwi-weather"  # 订阅的主题,记得修改这里
# 创建一个MQTT客户端
client = mqtt.Client()

# 设置回调函数
client.on_connect = on_connect
client.on_message = on_message

# 连接到MQTT Broker
client.connect(broker, port, 60)

# 开始循环,处理网络流量和调用回调函数
client.loop_forever()
桌面小组件部分
还在不断完善,因为也是刚学tkinter几天没有太掌握。

暂时可以实现实时读取data数据最后并读取全部数据绘制折线图。
python
import tkinter as tk
from tkinter import ttk
from PIL import Image, ImageTk
import matplotlib.pyplot as plt
from matplotlib.backends.backend_tkagg import FigureCanvasTkAgg
import pandas as pd

def line_plot():
    # Read the data from the file
    data = pd.read_csv('data.txt', sep='\t', header=None, names=['Timestamp', 'Temperature', 'Humidity'])
    print("Data loaded for plotting.")

    # Create the figure with a single subplot
    fig, ax = plt.subplots(figsize=(12, 6))

    # Plot the temperature
    temperature_line, = ax.plot(data['Timestamp'], data['Temperature'], color='blue', label='Temperature')
    ax.set_xlabel('Timestamp')
    ax.set_ylim(20, 40)  # Set the y-axis limits for temperature to 20-40
    ax.set_ylabel('Temperature (°C)', color='blue')
    ax.tick_params('y', colors='blue')


    # Create a twin y-axis for the humidity
    ax2 = ax.twinx()
    humidity_line, = ax2.plot(data['Timestamp'], data['Humidity'], color='green', label='Humidity')
    ax2.set_ylabel('Humidity (%)', color='green')
    ax2.set_ylim(20, 80)  # Set the y-axis limits for humidity to 20-80
    ax2.tick_params('y', colors='green')

    # Set the title and grid
    ax.set_title('Temperature and Humidity over Time')
    ax.grid()

    # Add a legend
    lines = [temperature_line, humidity_line]
    labels = [l.get_label() for l in lines]
    ax.legend(lines, labels, loc='upper left')

    # Display 20 evenly spaced x-axis labels
    num_ticks = 20
    start = 0
    end = len(data['Timestamp'])
    tick_locations = [start + i * (end - start) / (num_ticks - 1) for i in range(num_ticks)]
    # def split_timestamp(ts):
    #     return "-".join(":".join(ts.split(":")[:-1]).split("-")[:])

    # tick_locations = tick_locations.apply(split_timestamp)
    tick_locations = [int(loc) for loc in tick_locations]
    ax.set_xticks(tick_locations)
    plt.setp(ax.get_xticklabels(), rotation=30)
    plt.tight_layout()
    # Display the plot
    return fig

class AutoHideWindow:
    def __init__(self, root):
        self.root = root
        self.root.geometry("320x130-100+100")
        self.root.overrideredirect(True)
        self.root.wm_attributes("-topmost", True)
        self.root.wm_attributes("-alpha", 0.9)
        self.is_hidden = False

        self.screen_width = self.root.winfo_screenwidth()
        self.screen_height = self.root.winfo_screenheight()

        self.hidden_window = None
        self.line_chart_window = None
        self.line_chart_open = False  # Track if the line chart window is open

        self.create_main_interface()
        self.create_line_chart_window()

        self.root.bind("<Configure>", self.check_position)
        self.root.bind("<Enter>", self.show_full_window)
        self.root.bind("<Escape>", self.hide_window)
        self.root.bind("<Return>", self.show_full_window)
        self.root.bind("<ButtonPress-1>", self.start_move)
        self.root.bind("<B1-Motion>", self.on_move)

        self.x_offset = 0
        self.y_offset = 0

        self.update_data()

    def create_main_interface(self):
        self.main_frame = ttk.Frame(self.root)
        self.main_frame.pack(fill=tk.BOTH, expand=True)

        self.gif_label = tk.Label(self.main_frame)
        self.gif_label.grid(row=0, column=1, rowspan=4, padx=5, pady=5, sticky=tk.W)
        self.load_gif("功德加一+(1).gif")

        self.numbers_label = ttk.Frame(self.main_frame)
        self.numbers_label.grid(row=0, column=0, rowspan=3, padx=10, pady=10)

        self.number0_label = tk.Label(self.numbers_label, width=20, height=1, bg='green', fg='white', font="Arial 10 bold", text=" ", relief=tk.FLAT, anchor=tk.W)
        self.number0_label.grid(column=0, row=0, sticky=tk.E)

        self.number1_label = tk.Label(self.numbers_label, width=20, height=1, bg='white', fg='black', font="Arial 10", text="温度:", relief=tk.FLAT, anchor=tk.W)
        self.number1_label.grid(column=0, row=1, sticky=tk.E, ipady=3)

        self.number2_label = tk.Label(self.numbers_label, width=20, height=1, bg='white', fg='black', font="Arial 10", text="湿度:", relief=tk.FLAT, anchor=tk.W)
        self.number2_label.grid(column=0, row=2, sticky=tk.E, ipady=3)

        self.button = ttk.Button(self.main_frame, text="温湿度折线图", command=self.show_line_chart_window)
        self.button.grid(column=0, row=3, sticky=tk.E)

    def load_gif(self, path):
        self.gif = Image.open(path)
        self.gif_frames = []
        try:
            while True:
                self.gif_frames.append(ImageTk.PhotoImage(self.gif.copy()))
                self.gif.seek(len(self.gif_frames))
        except EOFError:
            pass

        self.current_frame = 0
        self.update_gif()

    def update_gif(self):
        self.gif_label.configure(image=self.gif_frames[self.current_frame])
        self.current_frame = (self.current_frame + 1) % len(self.gif_frames)
        self.root.after(100, self.update_gif)

    def create_line_chart_window(self):
        x, y = self.root.winfo_x(), self.root.winfo_y()
        width, height = 10, self.root.winfo_height()

        self.line_chart_window = tk.Toplevel(self.root)
        self.line_chart_window.geometry(f"320x500+{x}+{y}")
        self.line_chart_window.withdraw()

        # Bind the close event of the window to a method that resets the open status
        self.line_chart_window.protocol("WM_DELETE_WINDOW", self.close_line_chart_window)

    def check_position(self, event=None):
        if self.is_hidden:
            return
        x, y = self.root.winfo_x(), self.root.winfo_y()
        width, height = self.root.winfo_width(), self.root.winfo_height()
        if x <= 0 or x + width >= self.screen_width:
            self.hide_window()

    def hide_window(self, event=None):
        if self.hidden_window or self.is_hidden:
            return

        x, y = self.root.winfo_x(), self.root.winfo_y()
        width, height = 10, self.root.winfo_height()

        self.hidden_window = tk.Toplevel(self.root)
        self.hidden_window.geometry(f"{width}x{height}+{x}+{y}")
        self.hidden_window.overrideredirect(True)
        self.hidden_window.bind("<Enter>", self.show_full_window)

    def show_full_window(self, event=None):
        if self.hidden_window:
            self.hidden_window.destroy()
            self.hidden_window = None
            self.root.deiconify()
            self.is_hidden = False

    def show_line_chart_window(self):
        if self.line_chart_open:
            self.line_chart_window.deiconify()  # Show existing window
            self.create_line_chart(self.line_chart_window)  # Redraw the chart
        else:
            self.create_line_chart(self.line_chart_window)
            self.line_chart_window.deiconify()
            self.line_chart_open = True  # Update the open status

    def close_line_chart_window(self):
        if self.line_chart_open:
            self.line_chart_window.withdraw()  # Hide the window
            self.line_chart_open = False  # Update the open status

    def start_move(self, event):
        self.x_offset = event.x
        self.y_offset = event.y

    def on_move(self, event):
        x = self.root.winfo_pointerx() - self.x_offset
        y = self.root.winfo_pointery() - self.y_offset
        self.root.geometry(f"+{x}+{y}")

    def update_data(self, file="data.txt"):
        try:
            with open(file, "r") as file:
                lines = file.readlines()
                if lines:
                    last_line = lines[-1]
                    lasttime, temperate0, humi = last_line.split('\t')
                    temperate = temperate0.strip("℃ ")

                    self.number0_label.config(text=f"时间:{' '.join(lasttime.split('_'))}")
                    self.number1_label.config(text=f"温度:{temperate}℃")
                    self.number2_label.config(text=f"湿度:{humi.strip()}%")
        except Exception as e:
            print(f"读取文件出错: {e}")

        self.root.after(10000, self.update_data)

    def create_line_chart(self, window):
        fig = line_plot()

        canvas = FigureCanvasTkAgg(fig, master=window)
        canvas.draw()
        canvas.get_tk_widget().pack(fill=tk.BOTH, expand=True)

if __name__ == "__main__":
    root = tk.Tk()
    app = AutoHideWindow(root)
    root.mainloop()
这两个代码要同时运行就可以实现实时接收数据和实时组件展示,只开第一个就可以实时接收数据。
实验总结
是一次很好的学习电路板模块的小项目,也可作为中学生实践课程项目。
希望大家多多交流讨论啊,本人也是新手,希望有更简单高效的解决方案。